McIDAS images of 4-km resolution GOES-13 6.5 µm water vapor channel data (above; click image to play animation) showed a well-defined warm/dry “arc” feature (denoted by the brighter yellow color enhancement) just upwind of a large Mesoscale Convective System (MCS) that was moving eastward along the northern Gulf of Mexico... Read More
")
GOES-13 6.5 µm water vapor images (click image to play animation)
McIDAS images of 4-km resolution GOES-13 6.5 µm water vapor channel data (above; click image to play animation) showed a well-defined warm/dry “arc” feature (denoted by the brighter yellow color enhancement) just upwind of a large Mesoscale Convective System (MCS) that was moving eastward along the northern Gulf of Mexico and the adjacent Gulf Coast states on 30 March 2011. The MCS eventually produced a number of reports of damaging winds, large hail, and tornadoes across northern Florida. Also note that a subtle signature of what appeared to be gravity waves could be seen within portions of this warm/dry arc feature (especially in the southern portion, over the Gulf of Mexico).
AWIPS images of 1-km resolution MODIS 6.7 µm water vapor channel data (below) offered a more detailed view of the packet of gravity waves that was associated with the southern portion of the dry arc feature. This warm/dry arc seen on the water vapor imagery could have been a signature of a region of strong compensating subsidence along the rear edge of the intense deep convection.

MODIS 6.7 µm water vapor images
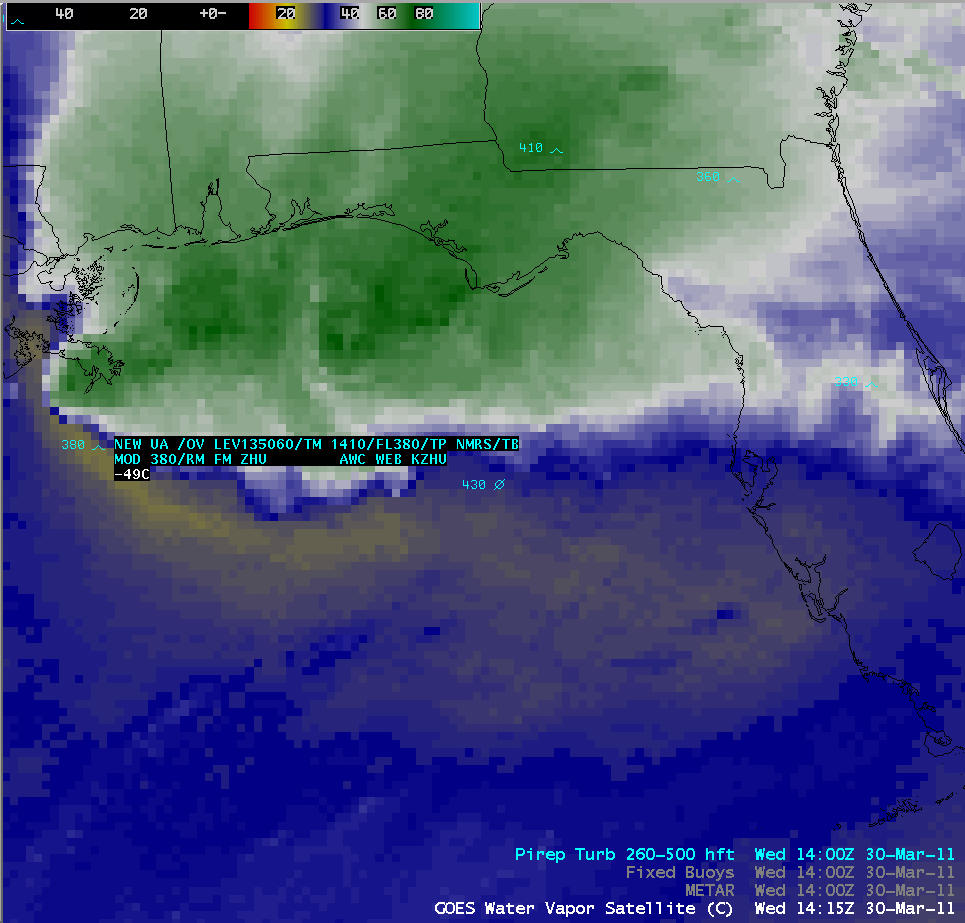
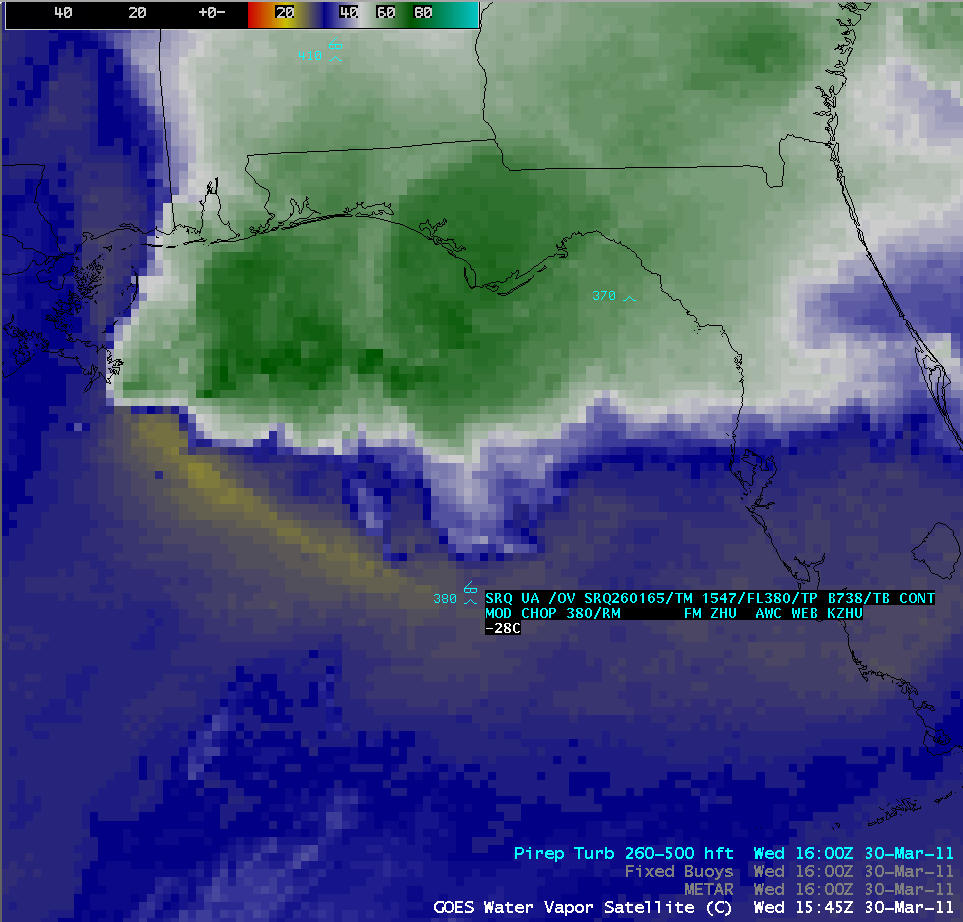
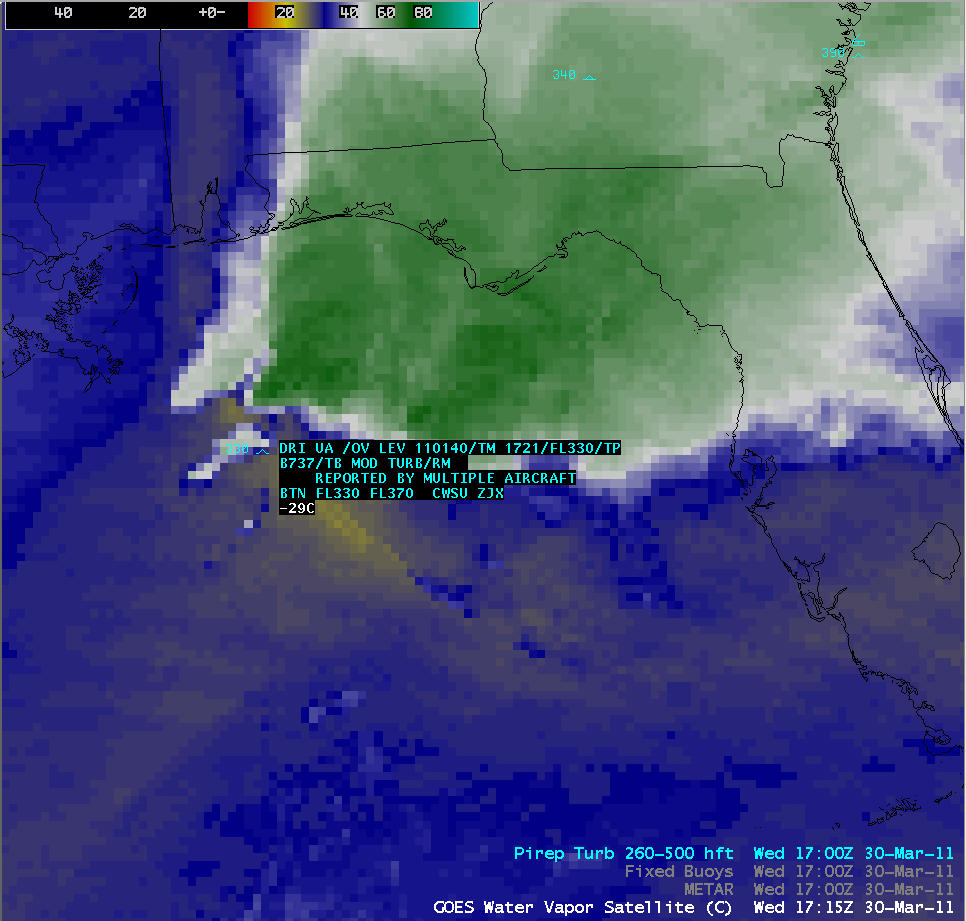
A number of pilot reports of moderate turbulence were co-located within this warm/dry arc feature seen on the water vapor imagery (below; click image to play animation), especially around 14 UTC, 16 UTC, and 17 UTC. There was also a report of severe turbulence along the northern portion of the arc feature as it moved over far southern Alabama at 17:35 UTC. This supports the idea that the warm/dry arc was likely a signature of strong subsidence in the wake of the MCS.
")
GOES-13 6.5 µm water vapor images + pilot reports of turbulence (click to play animation)
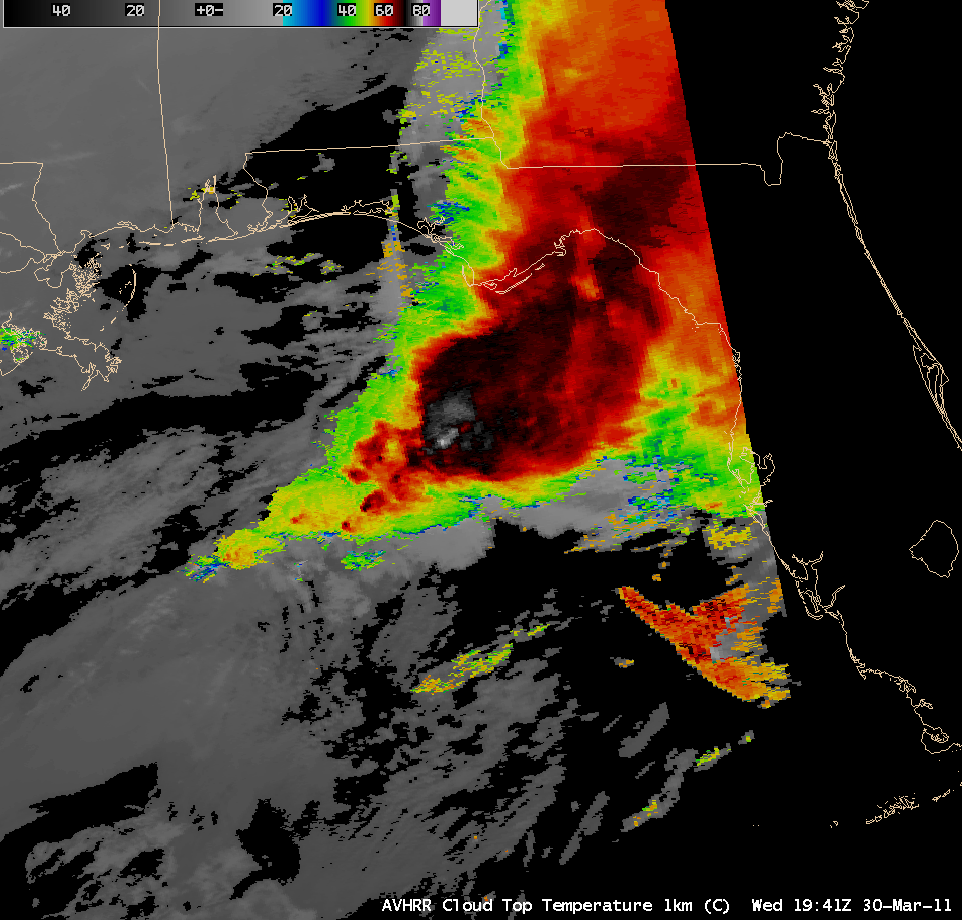
Note that a small patch of clouds developed along the southern portion of the warm/dry arc which contained the gravity waves over the Gulf of Mexico after about 18 UTC — additional information about this cloud patch could offer some clues as to the approximate altitude of the gravity waves. The POES AVHRR Cloud Type product (below) indicated that the cloud patch associated with the gravity wave was a cirrus feature (orange color enhancement).

POES AVHRR Cloud Type product
The corresponding POES AVHRR Cloud Top Height product (below) suggested that the tops of that cloud patch were generally in the 12-13 km range (darker green color enhancement). POES AVHRR cloud top temperatures were in the -55 to -65º C range with this feature.

POES AVHRR Cloud Top Height product
All of the above satellite evidence suggests that the gravity waves seen on the water vapor imagery were not surface-based, but were located at a higher altitude within the middle troposphere. In fact, the GOES-13 water vapor weighting functions calculated using rawinsonde data from Lake Charles, Louisiana (upstream of the MCS) and Tampa, Florida (downstream of the MCS) both peaked around 450 hPa (below), which tells us that the thermal energy being sampled by the water vapor channel in non-cloudy air was originating from within a high-altitude layer.

Lake Charles, Louisiana water vapor weighting function plot

Tampa, Florida water vapor weigting function plot
CIMSS participation in GOES-R Proving Ground activities includes making a variety of MODIS and POES AVHRR images and products available for National Weather Service offices to add to their local AWIPS workstations.
View only this post
Read Less
")


")
")
")
")


