Supercell thunderstorms developed along and ahead of an advancing cold frontal boundary and moved rapidly eastward across parts of northern and central Wisconsin on 10 April 2011. These severe storms produced widespread damaging winds, large hail (up to 3.0 inches in diameter), and a significant number tornadoes (see: NWS La Crosse | NWS Green Bay | NWS Milwaukee | SPC Storm Reports).... Read More
Supercell thunderstorms developed along and ahead of an advancing cold frontal boundary and moved rapidly eastward across parts of northern and central Wisconsin on 10 April 2011. These severe storms produced widespread damaging winds, large hail (up to 3.0 inches in diameter), and a significant number tornadoes (see: NWS La Crosse | NWS Green Bay | NWS Milwaukee | SPC Storm Reports). With 11 tornadoes confirmed so far, this was the largest single-day April tornado outbreak on record in Wisconsin.
")
GOES-13 0.63 µm visible images (click image to play animation)
McIDAS images of GOES-13 0.65 µm visible channel data (above; click image to play animation; also available as a QuickTime movie) showed a number of overshooting tops associated with these severe thunderstorms. The corresponding GOES-13 10.7 µm IR images (below; click image to play animation; also available as a QuickTime movie) showed the cold cloud top IR brightness temperatures (as cold as -67º C at 01:33 UTC), as well as a few enhanced-v and cold/warm couplet signatures.
")
GOES-13 10.7 µm IR images (click image to play animation)
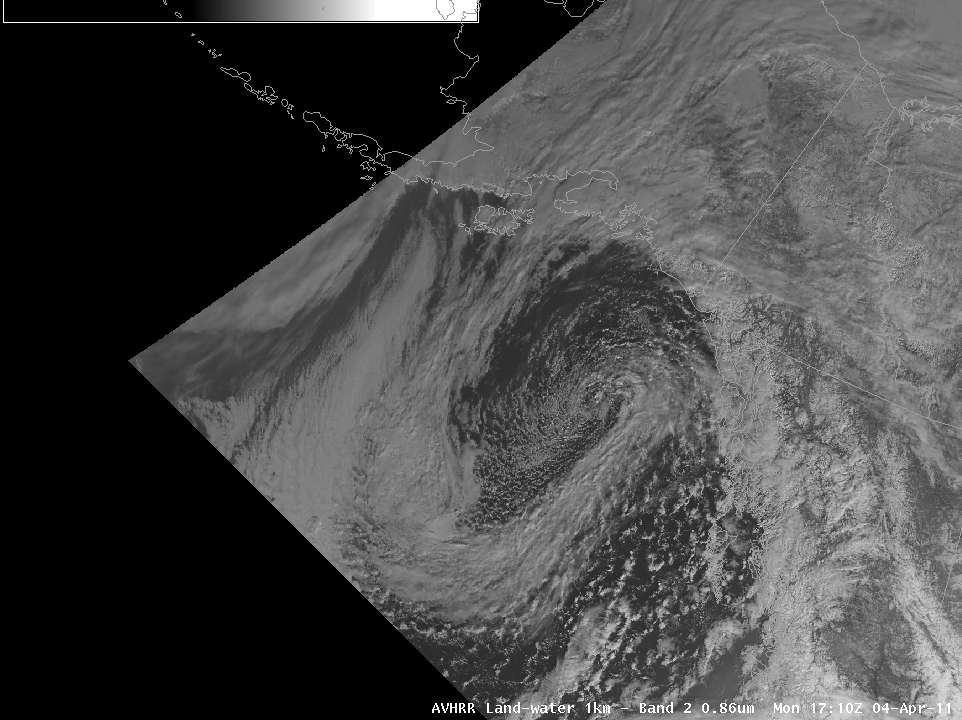
A comparison of a 1-km resolution NOAA-15 AVHRR 10.8 µm IR image with the corresponding 4-km resolution GOES-13 10.7 µm IR image at 21:33 UTC (below) demonstrates the advantage of higher spatial resolution to aid in the detection of enhanced-v and cold/warm thermal couplet storm top signatures, as well as a more accurate depiction of the coldest cloud top IR brightness temperatures associated with the more vigorous overshooting tops (-71º C on the NOAA-15 AVHRR IR image, compared to -58º C on the GOES-13 IR image).

NOAA-15 AVHRR 10.8 µm IR and GOES-13 10.7 µm IR images at 21:33 UTC
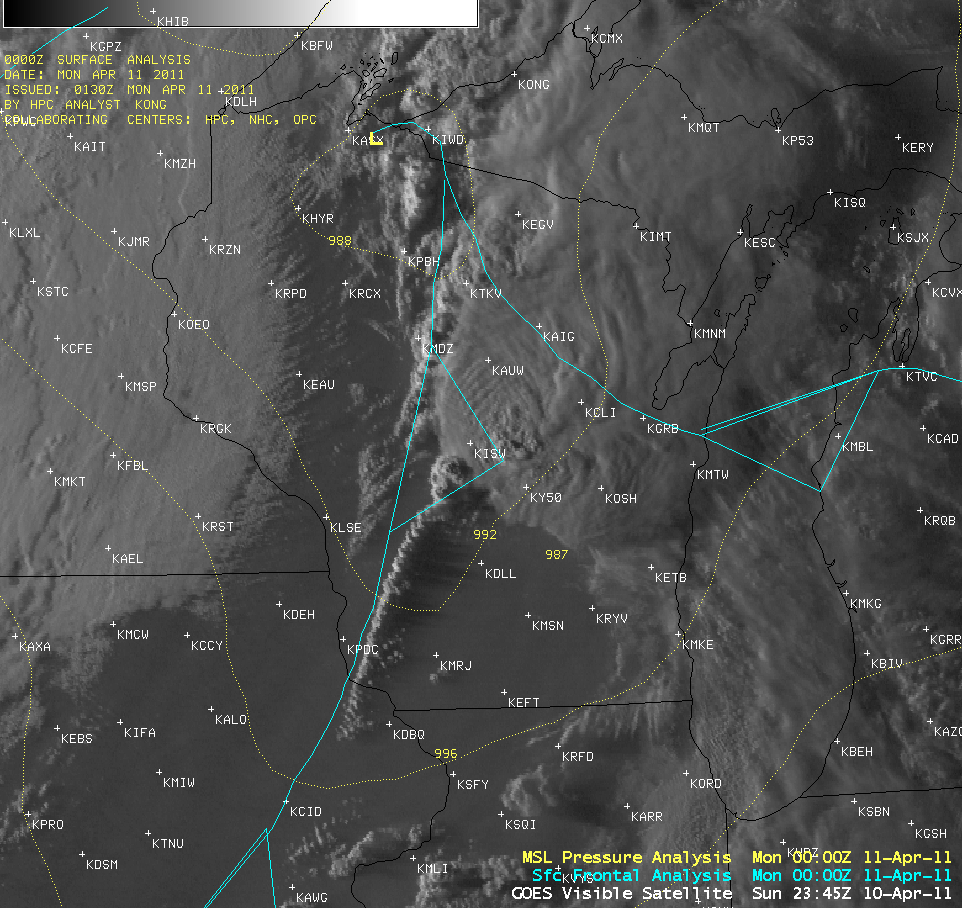
An AWIPS GOES-13 0.65 µm visible image at 23:45 UTC (below) was particularly interesting — a few overshooting tops could be seen over central Wisconsin, as well as long shadows being cast upon the hazy boundary layer by a narrow line of developing convection to the southwest. Cloud-to-ground lightning strikes and storm reports (damaging winds, large hail, and tornadoes) are also overlaid on the visible image.

GOES-13 0.63 µm visible image + cloud-to-ground lightning strikes + storm reports
In an effort to try and locate a satellite signature of the damage path of the EF3-rated tornado that moved from Hamburg to Merrill to Gleason in north-central Wisconsin, a comparison of 250-meter resolution MODIS true color images from 10 April (a few hours before the tornado) and 12 April (2 days after the tornado) were used (below). However, the lack of a deep snow cover or dense vegetation in this area made it very difficult to identify the tornado damage path. Note that on 10 April — the day of the tornado outbreak — there still was some light snow cover just to the northwest of the tornado track, with some sites reporting 2-3 inches of snow remaining on the ground that morning.
")
MODIS true color images on 10 April and 12 April (displayed using Google Earth)
View only this post
Read Less
")


")
")
 image, created using Bands 07/02/01")


