Category two Hurricane Irene (shown in the rocking animation above) is over the South Atlantic Bight after moving through the Bahamas on August 25th. The projected path is over coastal North Carolina and then towards New England. What factors will control future changes in strength?Morphed microwave imagery, above (and available... Read More
 images (click image to play animation)")
GOES-13 Visible (0.63 µm) images (click image to play animation)
Category two Hurricane Irene (shown in the rocking animation above) is over the South Atlantic Bight after moving through the Bahamas on August 25th. The projected path is over coastal North Carolina and then towards New England. What factors will control future changes in strength?
")
Morphed Microwave imagery (click image to play animation)
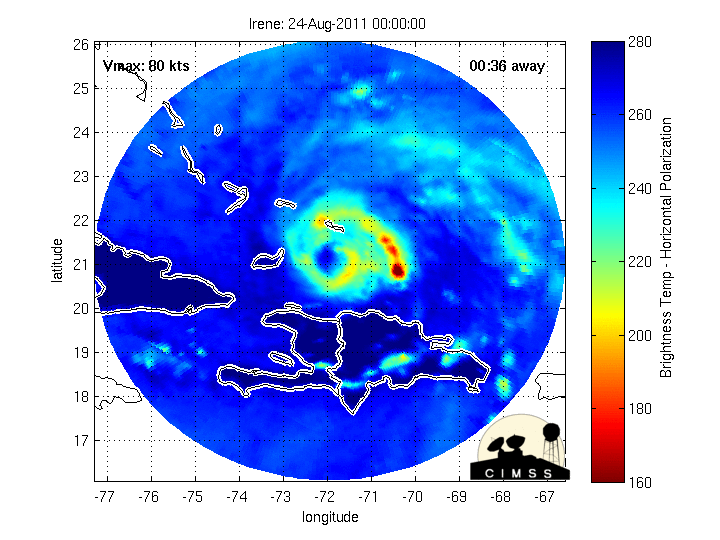
Morphed microwave imagery, above (and available from the CIMSS Tropical Cyclones site) shows a slow erosion in the inner eyewall during the first 12 hours of August 26, which suggests a possibly temporary decrease in organization to the storm. (Morphed microwave imagery from the 24th and 25th of August show how the eyewall structure changed as the hurricane moved through the Bahamas).
 image")
GOES Water Vapor (6.5 µm) image
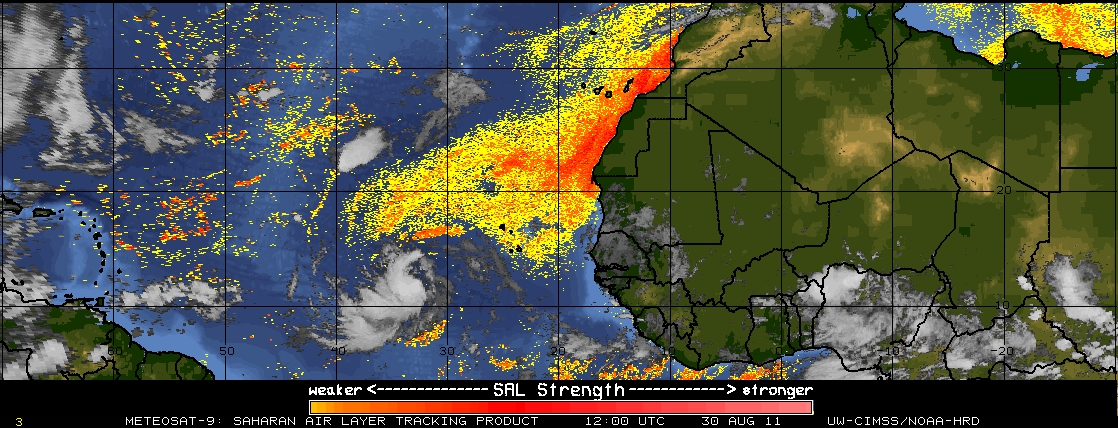
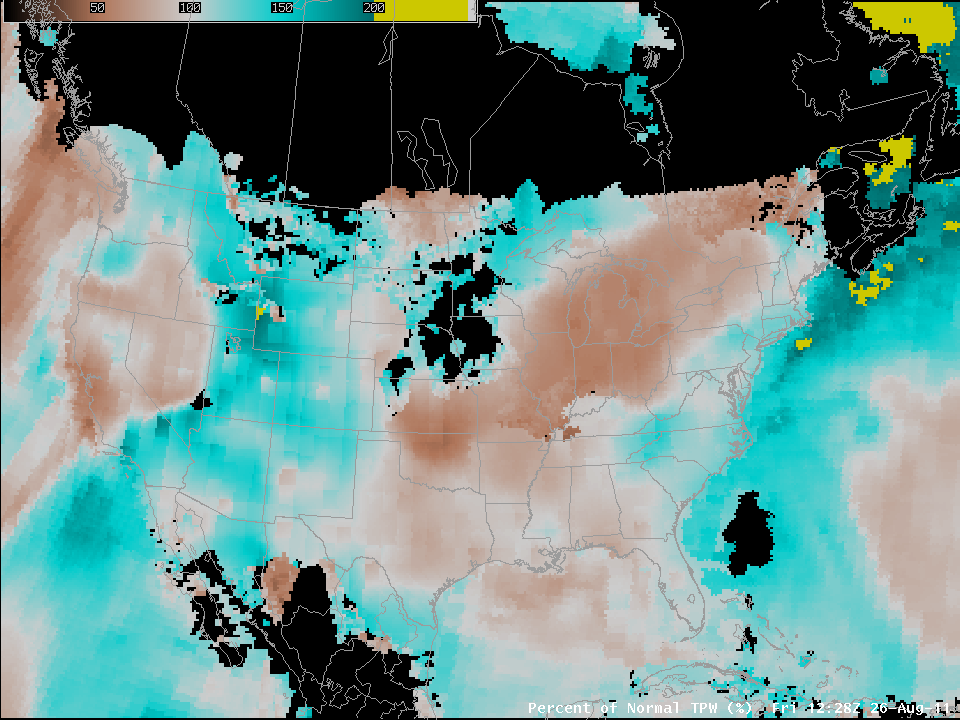
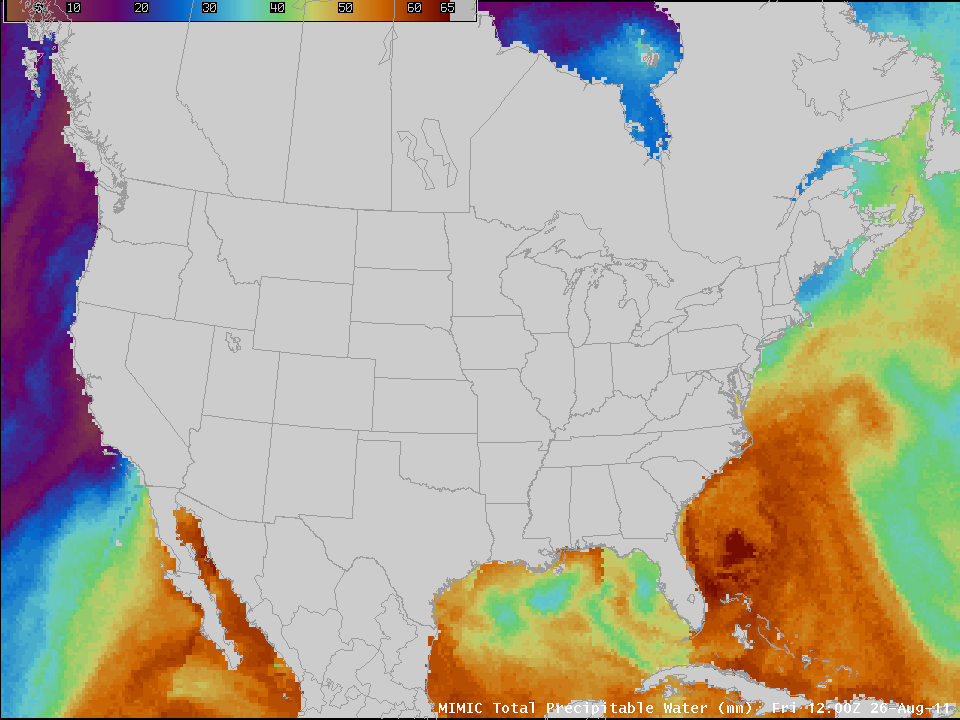
Water vapor imagery (above) shows dry air west of Irene and ahead of Irene. Recall, however, that GOES Water Vapor signals are showing the temperature at the top of the water vapor. Over the hurricane, where water vapor is associated with deep convective clouds, cold temperatures (white and green in the enhancement) are indicated. The yellow enhancement surrounding Irene indicates warm water vapor that is therefore low in the atmosphere, but it does not quantify how much moisture is present. That is, there could be abundant moisture very low in the atmosphere. Total Precipitable Water (TPW) Percent of Normal maps, however, blended from GPS and GOES Sounder data over land, and from Microwave imagery over water, show relatively dry air over the southeastern part of the United States. MIMIC TPW also shows dry air west of Florida over the Gulf of Mexico. If that dry air can be entrained into the circulation of Irene, significant strengthening would not be expected. (Note also that the MIMIC TPW shows a very rich moisture source just off the coast of the northeast United States. As Irene moves northward, that moisture-rich air should fuel heavy rains).
, IR (10.7 µm) and auto-detected Overshooting Tops (click image to play animation)")
GOES-13 Visible (0.63 µm), IR (10.7 µm) and auto-detected Overshooting Tops (click image to play animation)
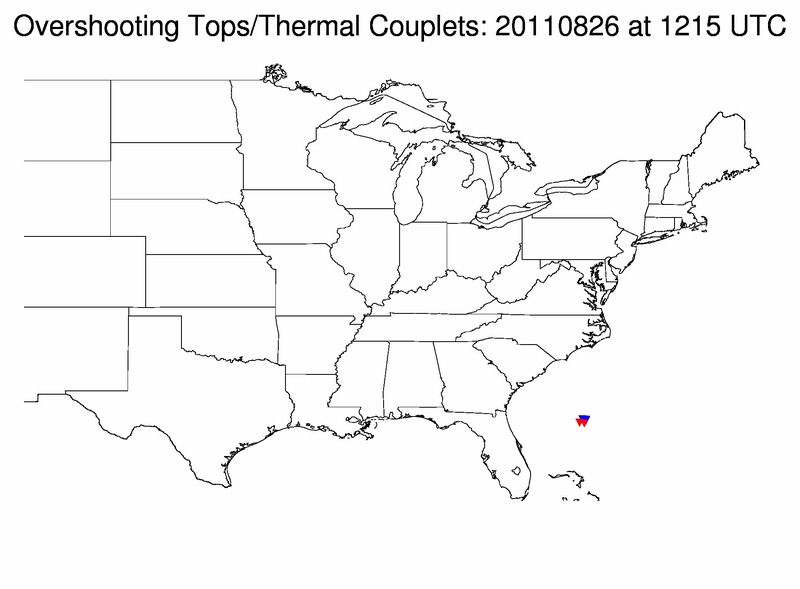
Thunderstorms in the outer rainbands are still producing overshooting tops, a sign of the intensity of the storm, as shown above. Overshooting Tops and Thermal Couplets can also be viewed here. Detections from 1215 UTC on August 26th show overshoots (and thermal couplets) near the eye.

Aqua MODIS False Color RGB Image
The Aqua satellite overflew Irene before sunrise on August 26th. The above false color image, using water vapor, infrared and short-wave infrared data from the MODIS instrument onboard Aqua as red, green and blue input, shows that dry air had suppressed convection north of the center of the storm at that time. Since then, as shown in the visible imagery at the top of this blog entry, convection has eliminated this dryer region. (Aqua MODIS image courtesy of Dave Santek at SSEC).

MODIS 11.0 µm and POES AVHRR 10.8 µm IR images
AWIPS images of 1-km resolution MODIS 11.0 µm and POES AVHRR 10.8 µm IR data (above) displayed cloud top IR brightness temperatures as cold as -85ºC (darker violet color enhancement) at 09:45 UTC within some of the spiral bands of Irene.
 image")
NOAA-19 AVHRR false-color Red/Green/Blue (RGB) image
A NOAA-19 false-color Red/Green/Blue (RGB) image (above; courtesy of Dave Santek, SSEC) showed a well-defined spiral band structure to the storm.
View only this post
Read Less
 images (click image to play animation)")
")


 images (click image to play animation)")
")
, IR (10.7 µm) and auto-detected Overshooting Tops (click image to play animation)")
