At 15:46 UTC on 06 December 2011, GOES-15 replaced GOES-11 as the operational GOES-West satellite. GOES-11 (launched in 2000, and operational since 2006) was one of the older GOES-I/J/K/L/M series of satellites (GOES-8/9/10/11/12), while GOES-15 (launched in 2010; Read More
At 15:46 UTC on 06 December 2011, GOES-15 replaced GOES-11 as the operational GOES-West satellite. GOES-11 (launched in 2000, and operational since 2006) was one of the older GOES-I/J/K/L/M series of satellites (GOES-8/9/10/11/12), while GOES-15 (launched in 2010; Post Launch Test) is one of the newer GOES-N/O/P series of satellites (GOES-13/14/15) — so there are some important differences that users of the new GOES-15 imagery should be aware of:
- Improved water vapor channel (Imager channel 3)
- Slightly different visible channel (Imager chanel 1)
- 13.3 µm IR (Imager channel 6) replaces the 12.0 µm IR (Imager channel 5)
- Improved Image Navigation and Registration (INR)
- Shorter image outages during Spring and Fall season “eclipse periods”
- Less noise on many of the Sounder channels

GOES-11 vs GOES-15 Imager water vapor channel data as the source for GOES-West
The improvement made to the GOES-15 Imager instrument water vapor channel is likely the most important change that operational users will notice. In the sequence of AWIPS images above, the first 3 images are using the 8-km resolution GOES-11 6.7 µm channel as the source for GOES-West water vapor imagery, while the final 3 images use the 4-km resolution GOES-15 6.5 µm channel. Note the change to slightly warmer/drier water vapor brightness temperatures (brighter yellow color enhancement) after the changeover to GOES-15 — this in part due to the fact that the spectral response function of the 4-km resolution water vapor channel on GOES-12 and beyond is much wider than that of the 8-km resolution water vapor channel on GOES-8 through GOES-11. In addition, notice that the north-south “seam” joining the GOES-West and GOES-East water vapor channel images disappears, since the characteristics of the water vapor channels are now identical on those two satellites.
In the sequence of AWIPS images below, the first 2 images are using the GOES-11 Sounder instrument 6.5 µm channel as the source for GOES-West water vapor imagery, while the final 2 images use the GOES-15 Sounder 6.5 µm channel. Note the improvement in noise seen in the Sounder instrument water vapor images after the changeover to GOES-15. Since the 3 GOES Sounder water vapor channels are a component of the GOES Sounder Total Precipitable Water derived product imagery, the quality of that product should also improve.

GOES-11 vs GOES-15 Sounder 6.5 µm water vapor channel data as the source for GOES-West
In terms of the visible imagery, a comparison using GOES-11 (the first 3 images) vs GOES-15 (the final set of 3 images) Imager visible channel data is seen below (during a test on 29 November). Immediately obvious is the fact that the GOES-15 visible channel imagery appears “brighter” than the GOES-11 visible channel imagery — this is due to the fact that the performance of the GOES visible detectors degrades over time. The 0.63 µm visible channel on GOES-15 is also slightly different than the 0.65 µm visible channel on GOES-11, as is discussed in the “GOES-13 is now the operational GOES-East satellite” blog post. GOES-15 is similar to GOES-13, since it is part of the GOES-N/O/P series of spacecraft.

Using GOES-11 vs GOES-15 as the source for GOES-West visible channel images
One of the benefits of GOES-15 is improved Image Navigation and Registration (INR), which leads to less image-to-image “wobble” when viewing an animation. The improved GOES-15 INR is quite evident when compared to GOES-11 for this blowing dust case on 27 November (below; click image to play animation).
")
GOES-11 0.65 µm and GOES-15 0.63 µm visible images (click image to play animation)
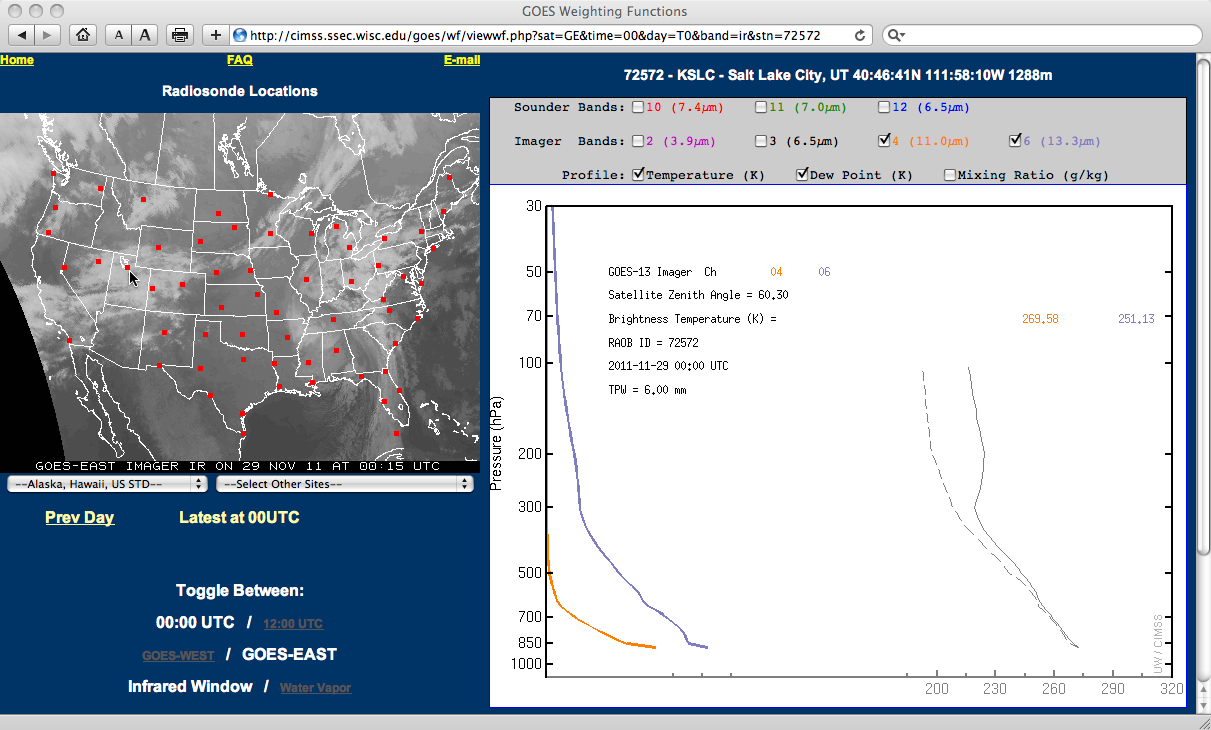
A comparison of the GOES-15 0.63 µm visible channel, the 10.7 µm “IR window” channel, and the 13.3 µm “CO2 absorption” IR channel (below) shows that high cloud features will show up with more clarity on the 13.3 µm images — by examining the weighting function of the 13.3 µm IR channel, it can be seen that this CO2 absorption channel samples radiation from a much deeper, much higher altitude than the standard 10.7 µm IR window channel.

GOES-15 0.63 µm visible channel, 10.7 µm IR channel, and 13.3 µm IR channel images
The 13.3 µm “CO2 absorption” IR channel is also used for the creation of derived products such as Cloud Top Pressure. An example of a combined GOES-15 (GOES-West) + GOES-13 (GOES-East) Cloud Top Pressure product is shown below (courtesy of Tony Schreiner, CIMSS).

GOES-15 + GOES-13 Cloud Top Pressure product
An example of the value of having larger batteries onboard the GOES-13/14/15 spacecraft during eclipse periods can be seen below, as Hurricane Ike was making landfall along the Texas coast in September of 2008. During the approximately 3 hour image outage from GOES-12 during the eclipse period (when the satellite was in the Earth’s shadow, and the solar panels could not generate the power necessary to operate the GOES imager and GOES sounder instrument packages), GOES-13 IR images continued to be available — and these GOES-13 images showed a strong spiral band that was in the process of intensifying and moving inland along the far northeastern Texas and far southwestern Louisiana coastlines.
")
GOES-12 vs GOES-13 IR images (Hurricane Ike making landfall)
Additional information can be found on the VISIT training lesson “GOES-15 Becomes GOES-West“.
HISTORICAL NOTE: GOES-15 became GOES-West on the 45th anniversary of the launch of ATS-1 on 06 December 1966. ATS-1 was the first meteorological satellite to provide geostationary images — an example of an early ATS-1 visible image is seen below, and QuickTime movies are available which show animations of some of the early ATS-1 images.
")
ATS-1 visible image (11 December 1966)
View only this post
Read Less

 image (displayed using Google Earth)")

")
")
