A potent winter storm moved into the southern Plains on 19 December 2011 as a cut-off circulation off the west coast of the US opened up and moved eastward. GOES water Vapor imagery (looped, above) shows a distinct dry slot. Stationary terrain features in the Cordillera of Northern Mexico are... Read More
")
GOES-13 6.5 µm WV images (click image to play animation)
A potent winter storm moved into the southern Plains on 19 December 2011 as a cut-off circulation off the west coast of the US opened up and moved eastward. GOES water Vapor imagery (looped, above) shows a distinct dry slot. Stationary terrain features in the Cordillera of Northern Mexico are visible, suggesting that the surface radiation emitted at 6.5 micrometers is not absorbed by water vapor within the atmosphere (because of the extreme dryness). Cirrus that develops later in the loop along the southern border of the image does obscure some of the surface features. Note also how a strong moisture signal develops over New Mexico. Rising motion over that state moves water vapor to higher and higher levels in the atmosphere. At the start of the loop, most of the water vapor exists below the mid-tropospheric level where the Imager Sensor is detecting water vapor. Persistent rising motion allows the moist layer to deepen, and the imager starts detecting this higher, colder moisture. The loop in the computed weighting function for Albuquerque at 00 UTC and at 12 UTC on 19 December is here. Note that the amount of water vapor in the atmosphere increases between 00 UTC and 12 UTC as indicated on the linked-to charts. The weighting function describes the relative importance of emitted radiation from different levels in the atmosphere.
Lack of moisture in mid-levels (the peak response is around 500 hPa) at 00 UTC means the water vapor signal is being emitted from farther down in the troposphere, where it is warmer. As moisture deepens, the water vapor signal is emitted from colder regions. The water vapor detector on the imager shows the temperature at the top of the moist layer. It does not reveal the total moisture content in the column.
")
GOES-13/MODIS 6.5 µm WV images (click image to play animation)
MODIS and GOES-13 water vapor imagery (above) from between 1630 and 1700 UTC (that is, just after the loop at the top), show significant brightness temperature differences between sensed water vapor. Values from the MODIS instrument shows water vapor brightness temperatures that are uniformly colder than the GOES-13 values. Why? The Spectral Response Functions below (courtesy of Mat Gunshor, SSEC/CIMSS), for GOES-12 (the imager on GOES-12 is similar to that on GOES-13) and for the MODIS WV Channel suggest a possible reason. The Imager water vapor detection (in blue) spans a larger part of the electromagnetic spectrum, including regions at longer wavelengths. (The MODIS water vapor channel is a single sharply defined peak (shown in red)). As the wavelength increases, the level sensed decreases, so a broader spectrum that includes longer wavelengths will show warmer temperatures because it is detecting more energy from lower in the atmosphere where temperatures are warmer. At Nadir, GOES-13 will be about 1 K warmer than the MODIS Brightness temperature. (Use this website to show different weighting functions.

GOES-12/MODIS Spectral Response Functions for Water Vapor Channel
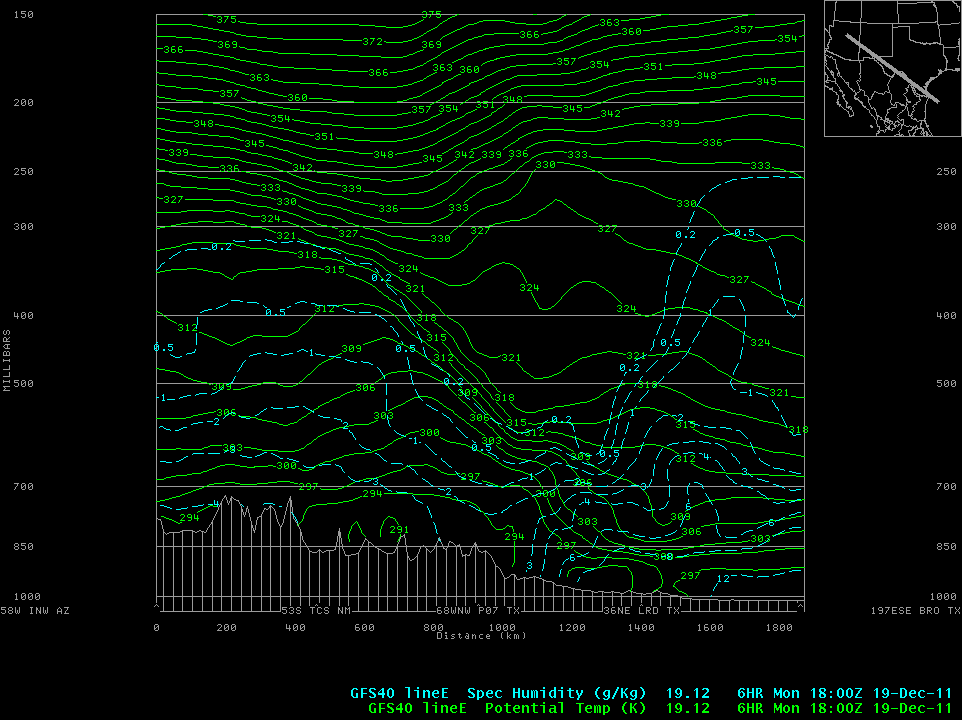
It is common to relate features in the water vapor imagery to structures in the atmosphere. The figure below shows a 325-K Jet maxima aligned, as expected, with the dry slot in the WV imagery. The dry slot is a region of sinking motion. Warm brightness temperatures develop in the dry slot because water vapor is confined to the lowest levels of the atmosphere, so the emitting surface is warm. A cross-section that is nearly orthogonal to the jet (here) shows an isentropic structure that is characteristic of an intrusion of stratospheric air into the mid-troposphere. It also shows extreme dryness in the middle of the tropopshere.

GOES-13 WV/GFS 325K Winds
This storm brought needed precipitation to parts of the southern Plains that have been plagued by drought all year.
===== 21 December Update =====
")
MODIS true color RGB images (viewed using Google Earth)
Two days after the storm, the clouds had cleared to reveal the large swath of fresh snow cover on 21 December 2011, as seen on a composite of MODIS true color Red/Green/Blue (RGB) images from the SSEC MODIS Today site (above; viewed using Google Earth). Across the Southern Plains, the highest storm total snowfall amounts (in inches) in Texas, Oklahoma, Colorado, and Kansas are highlighted on the image.
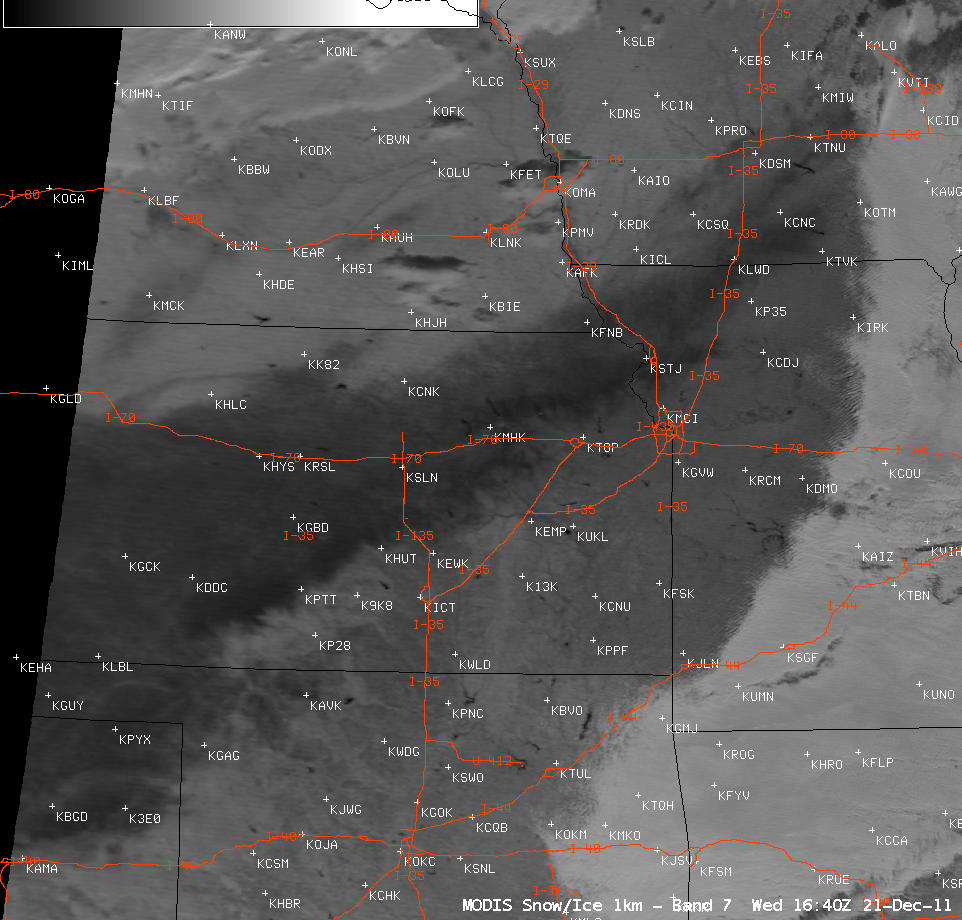
A comparison of AWIPS images of the 1-km resolution MODIS 0.65 µm visible channel and the corresponding MODIS false color RGB image created using the visible and “snow/ice” channels 01/07/07 (below) revealed the swath of snow cover (red on the RGB image) on the 16:40 UTC overpass of the Terra satellite. Note the darker red appearance along the far southeastern edge of the snow cover on the false color image — this is a signature of areas where there was a significant accrual of ice due to freezing drizzle. Near Pratt, Kansas (station identifier KPTT) the thickness of the ice accrual was around 0.25 inch. Since ice is a stronger absorber of radiation than snow cover at the 2.1 µm wavelength, this leads to a darker appearance on a single-channel MODIS Band 7 imagery.

MODIS 0.65 µm visible channel + MODIS false color RGB image
View only this post
Read Less
")


")
")
")


")

")
