AWIPS images of 4-km resolution GOES-13 10.7 µm IR channel images with overlays of surface reports and SPC storm reports (above; click image to play animation) showed the development of thunderstorms across the Panhandle region of Texas on 14... Read More
")
GOES-13 10.7 µm IR images with surface reports and storm reports (click image to play animation)
AWIPS images of 4-km resolution GOES-13 10.7 µm IR channel images with overlays of surface reports and SPC storm reports (above; click image to play animation) showed the development of thunderstorms across the Panhandle region of Texas on 14 December 2012. As these storms intensified into an organized squall line, they produced small hail, widespread damaging winds, and 3 tornadoes. These tornadoes were the first tornadoes on record during the month of December in the Amarillo forecast area (NWS Amarillo news story).
A comparison of McIDAS images of GOES-15 (GOES-West) and GOES-13 (GOES-East) 0.63 µm visible channel images (below; click image to play animation) revealed an interesting cloud-top gravity wave structure with some of these thunderstorms.
 and GOES-13 (right) 0.63 µm visible images (click image to play animation)")
GOES-15 (left) and GOES-13 (right) 0.63 µm visible images (click image to play animation)

POES AVHRR 0.86 µm visible channel images
1-km resolution POES AVHRR 0.86 µm visible channel images (above) and 12.0 µm IR channel images (below) showed the rapid development of a organized cluster of convection west of Amarillo (station identifier KAMA) between 20:24 UTC and 20:52 UTC (3:24 and 3:52 PM local time). Note how the surface winds were backing and becoming more southeasterly at Amarillo, likely helping to enhance surface convergence ahead of the approaching thunderstorms. To the south, winds were gusting in excess of 40 knots at Lubbock (station identifier KLBB), producing blowing dust reducing the surface visibility to 3 miles at times.

POES AVHRR 11.0 µm IR channel images
The Blended Total Precipitable Water (TPW) product (below; click image to play animation) showed the northward transport of moisture from the Gulf of Mexico during the day, with TPW values exceeding 20 mm or 0.79 inch (darker green color enhancement) across the eastern Texas Panhandle by the afternoon hours. These TPW values were in excess of 200 percent of normal for this region during this time of the year.
")
Blended Total Precipitable Water product (click image to play animation)
")
GOES-13 sounder Total Precipitable Water derived product imagery (click image to play animation)
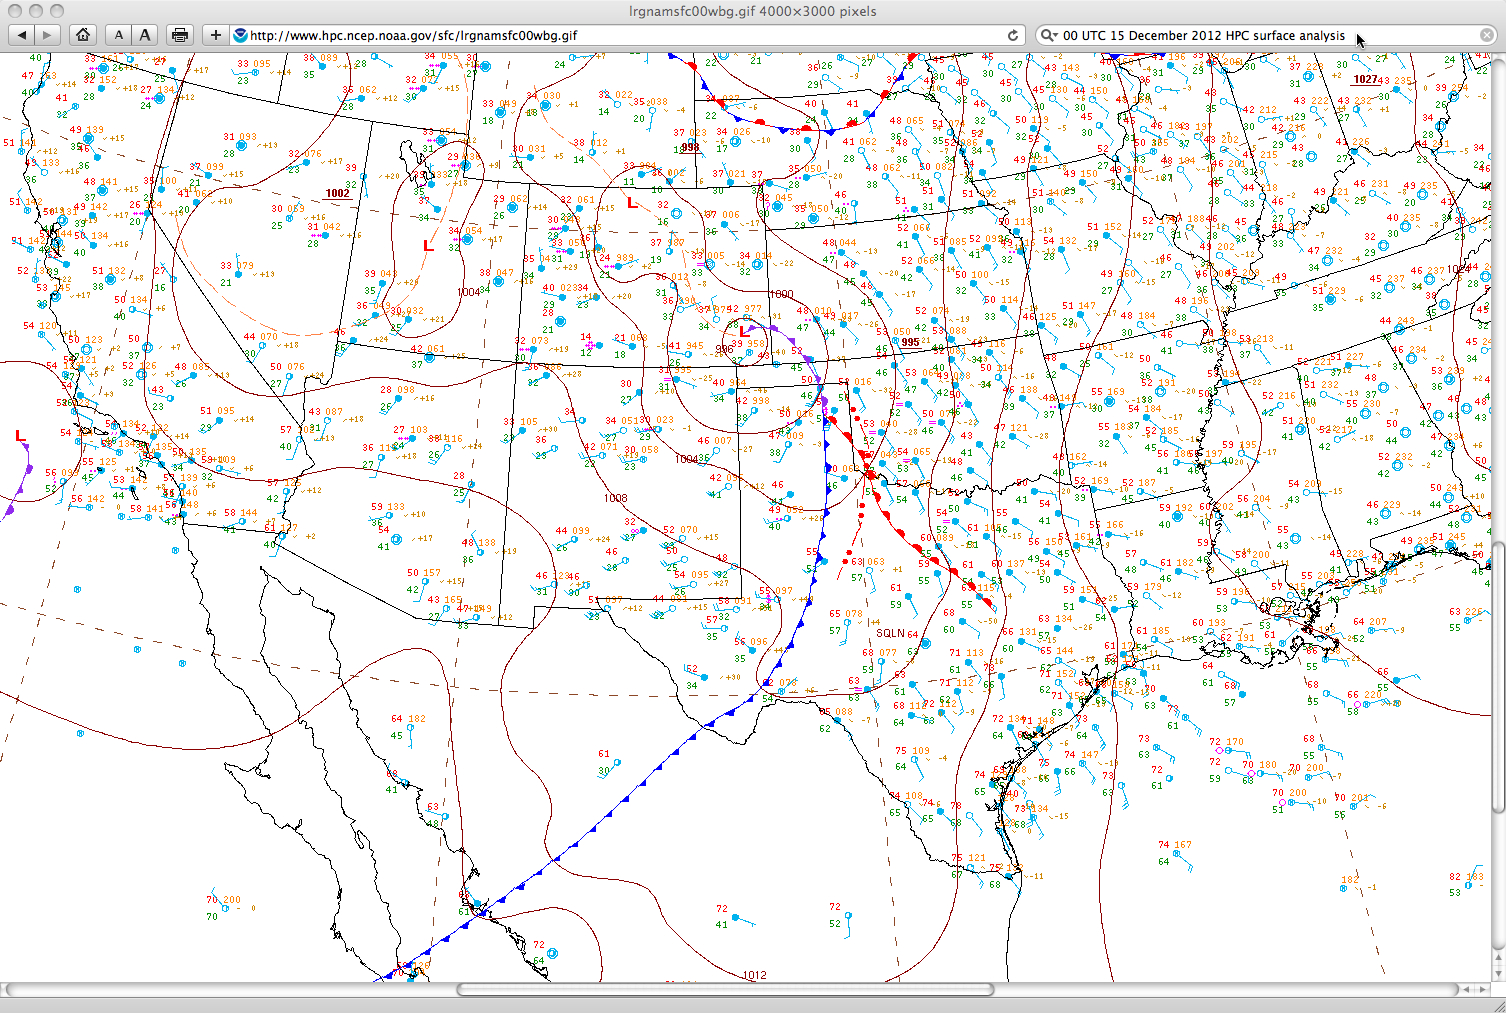
A few breaks in the widespread cloudiness across the region allowed a closer look at the moisture and instability ahead of the advancing cold front (HPC surface analysis), using 10-km resolution GOES-13 sounder Total Precipitable Water (above; click image to play animation) and GOES-13 sounder Lifted Index (below; click image to play animation) derived product imagery — TPW values were as high as 22 mm or 0.87 inch, and there were pockets of instabiity with LI values as low as -5.8º C in cloud-free areas where daytime heating was helping to destabilize the atmosphere.
")
GOES-13 sounder Lifted Index derived product imagery (click image to play animation)
View only this post
Read Less
")
 and GOES-13 (right) 0.63 µm visible images (click image to play animation)")
")
")
")


")
")


 image")
