 |
GOES-R Proving Ground Product Demonstration: Tropical Overshooting Tops (TOTs) Tutorial |
 |
| Product Developers: Sarah Monette and Chris Velden |
| Collaborators: Kristopher Bedka, Chris Rozoff, and Wayne Feltz |
Go to: Description of TOT Algorithm
Go to: TOT Applications
Concept
TOTs are associated with vigorous tropical convection, and may be employed as a proxy for identifying "vortical
hot towers," hypothesized to be important for hurricane genesis and intensity change.
Application
Trends in TOTs associated with pre or existing hurricanes can be related to favorable environmental factors for
genesis or RI, respectively.
TOT Algorithm Synopsis
| Find relative minima in the GOES 4-km or MSG 3-km resolution 11 μm brightness temperature (BT) field colder than 215 K. |
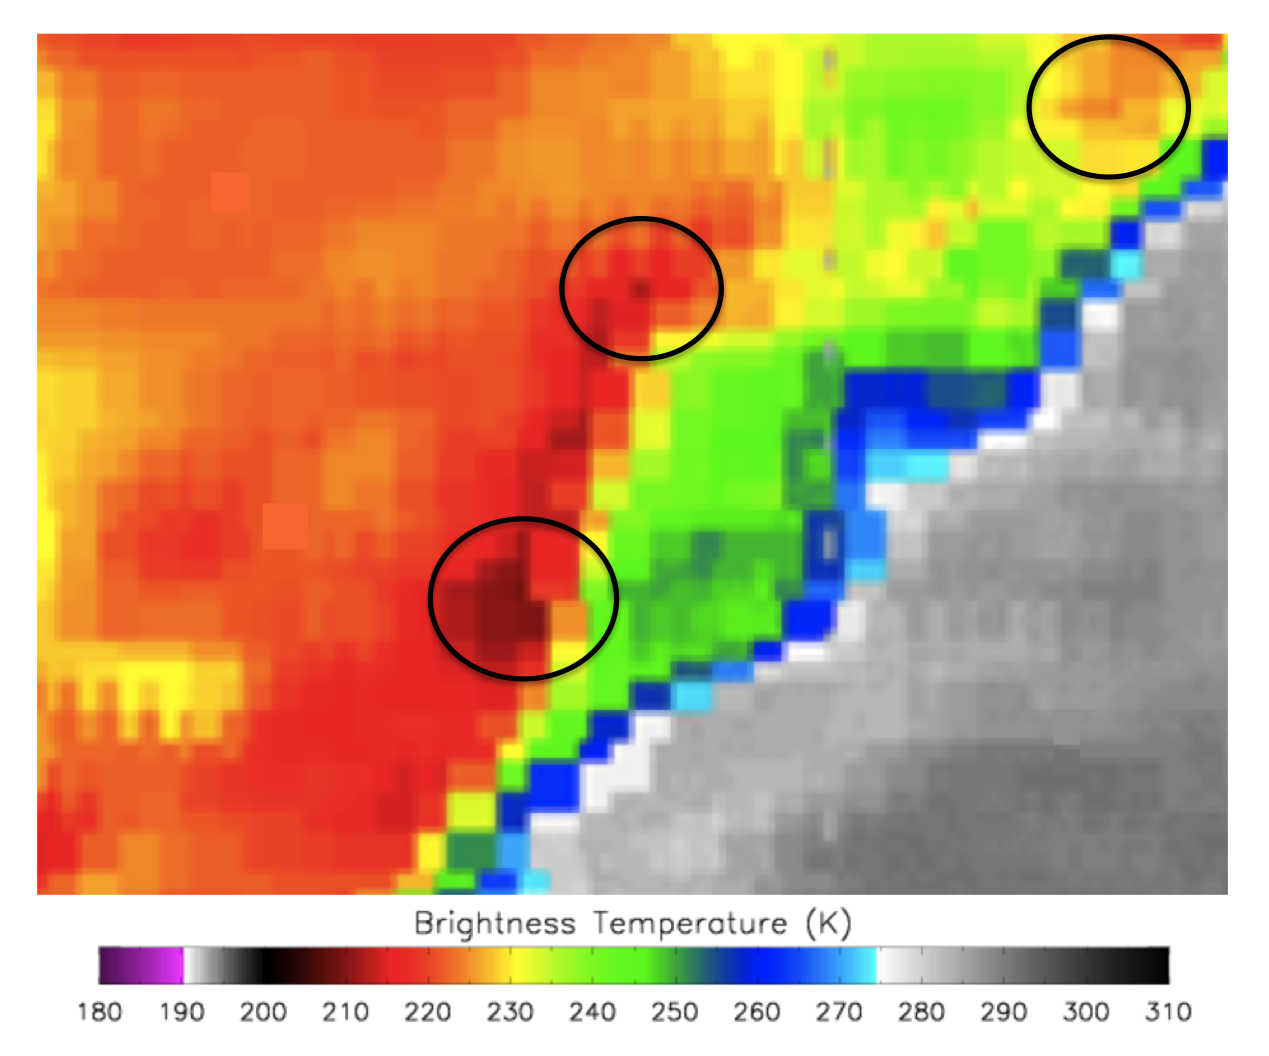 |
Sample the surrounding anvil at an ≈ 8 km radius in 16 radial directions.
At least 9-of-16 anvil cloud pixels must be colder than 225 K.
Compute the mean BT of these pixels. |
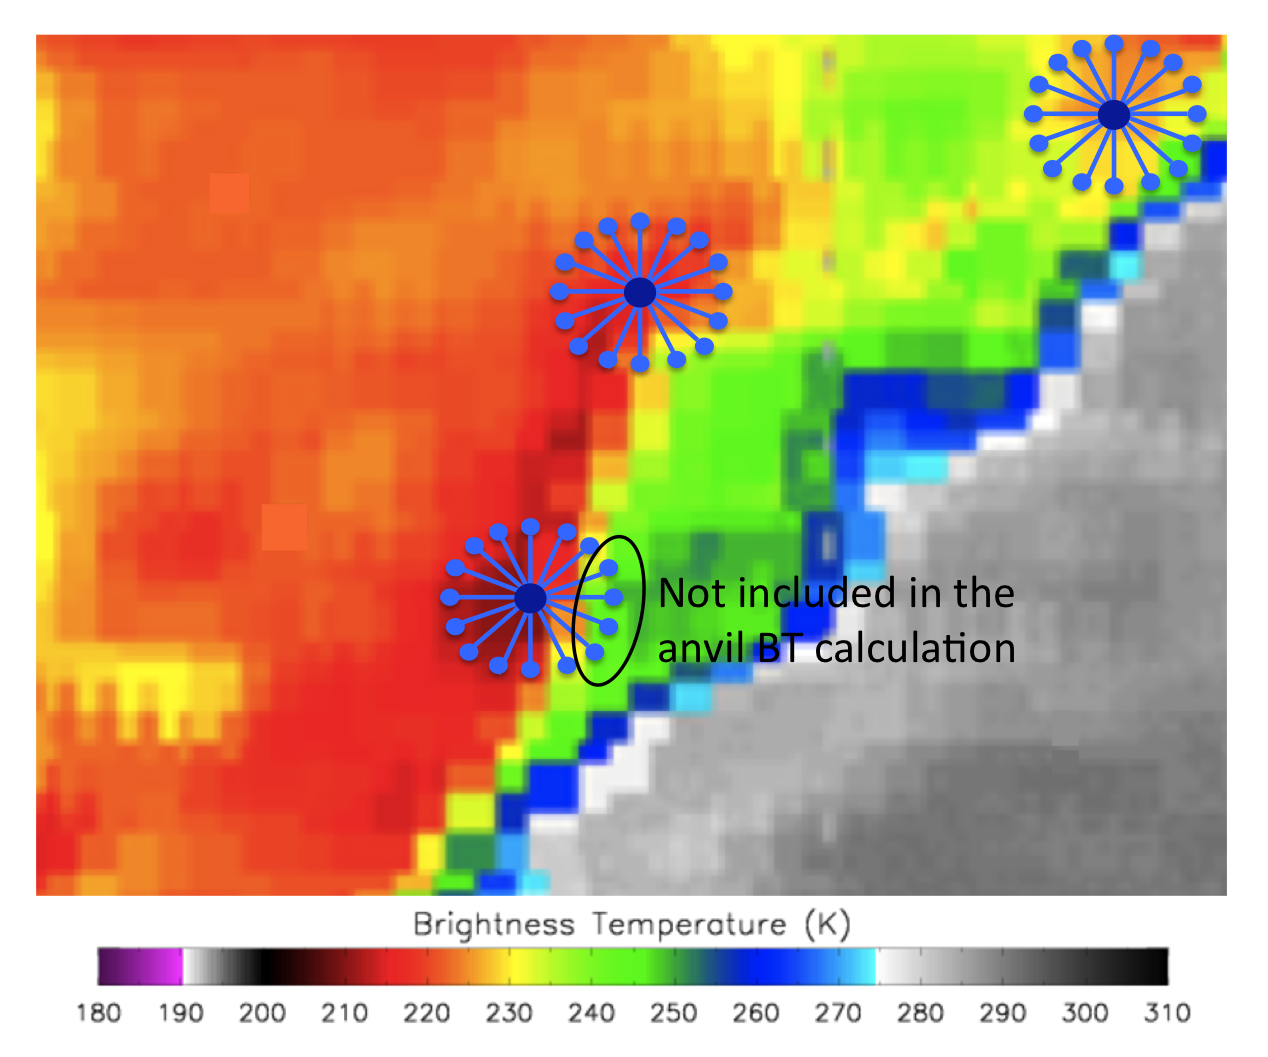 |
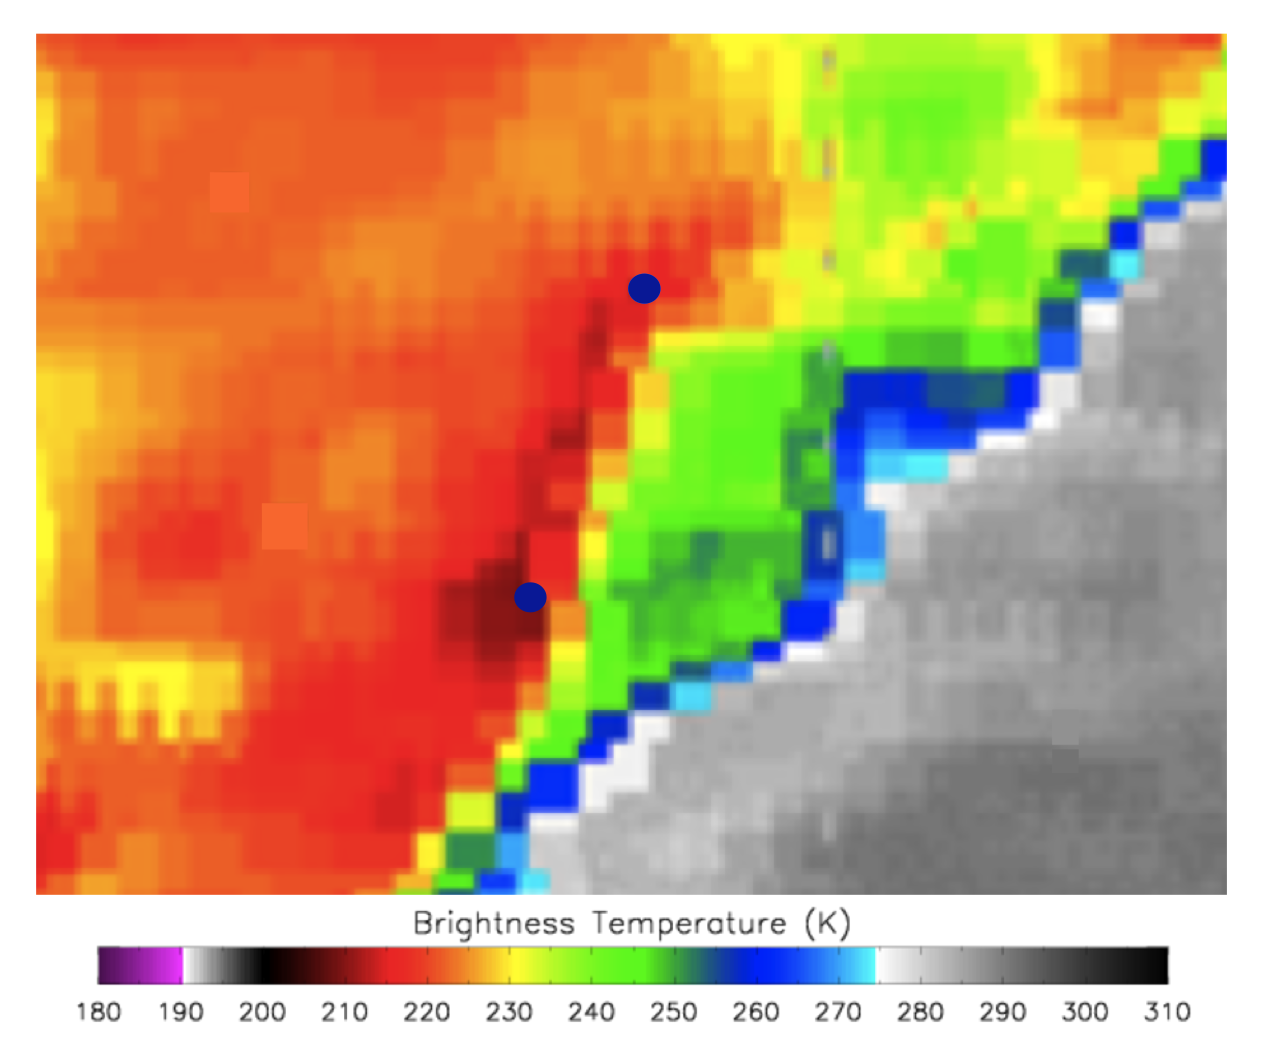
| Cloud pixel minimum at least 9 K colder than the surrounding anvil are flagged as a tropical overshooting top.
|  |
Analysis
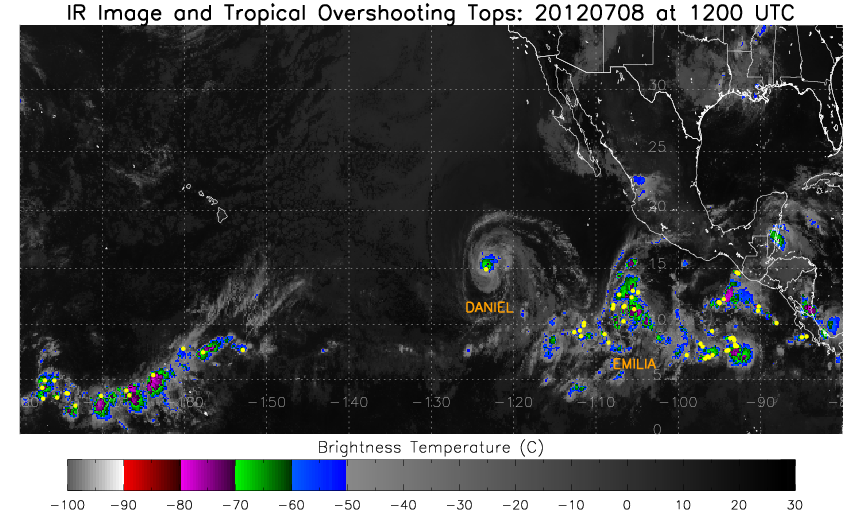
Atlantic TOTs will be analyzed using the METEOSAT-9 and GOES-13 satellite scan areas with a
boundary at 55° W. An example of this area can be seen in the below image from 2011.
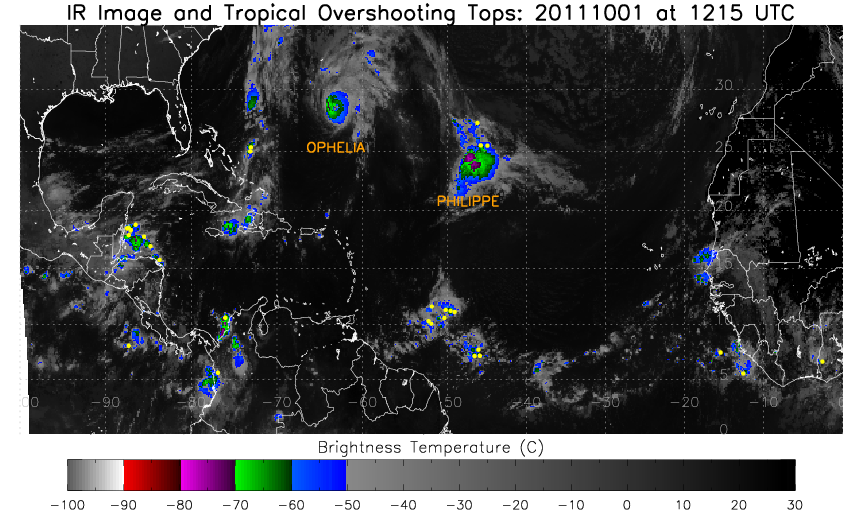
TOT locations are indicated by the yellow dots from the MSG satellite scan to 55° W (proxy for GOES-R demo). West of at 55° W analyzed by GOES-13.
E. Pacific TOTs will be analyzed using the GOES-15 and GOES-13 satellite scan areas with a
boundary at 105° W. The GOES-13 satellite image is 15 mins prior to the GOES-15 satellite image. An example of this area can be seen in the below image from 2012.
TOT locations are indicated by the yellow dots from the GOES-15 satellite scan west of 105° W. East of at 105° W is analyzed by GOES-13.
Monitoring TOT Trends for Tropical Cyclone forecasts
Rapid Intensification:
The number of TOTs within 300 km of the TC center will be monitored. This radius has shown to be skillful at predicting
rapid intensification (Monette et al. 2012). Note the spike in the TOTs prior an RI forecast in Rina (2011).
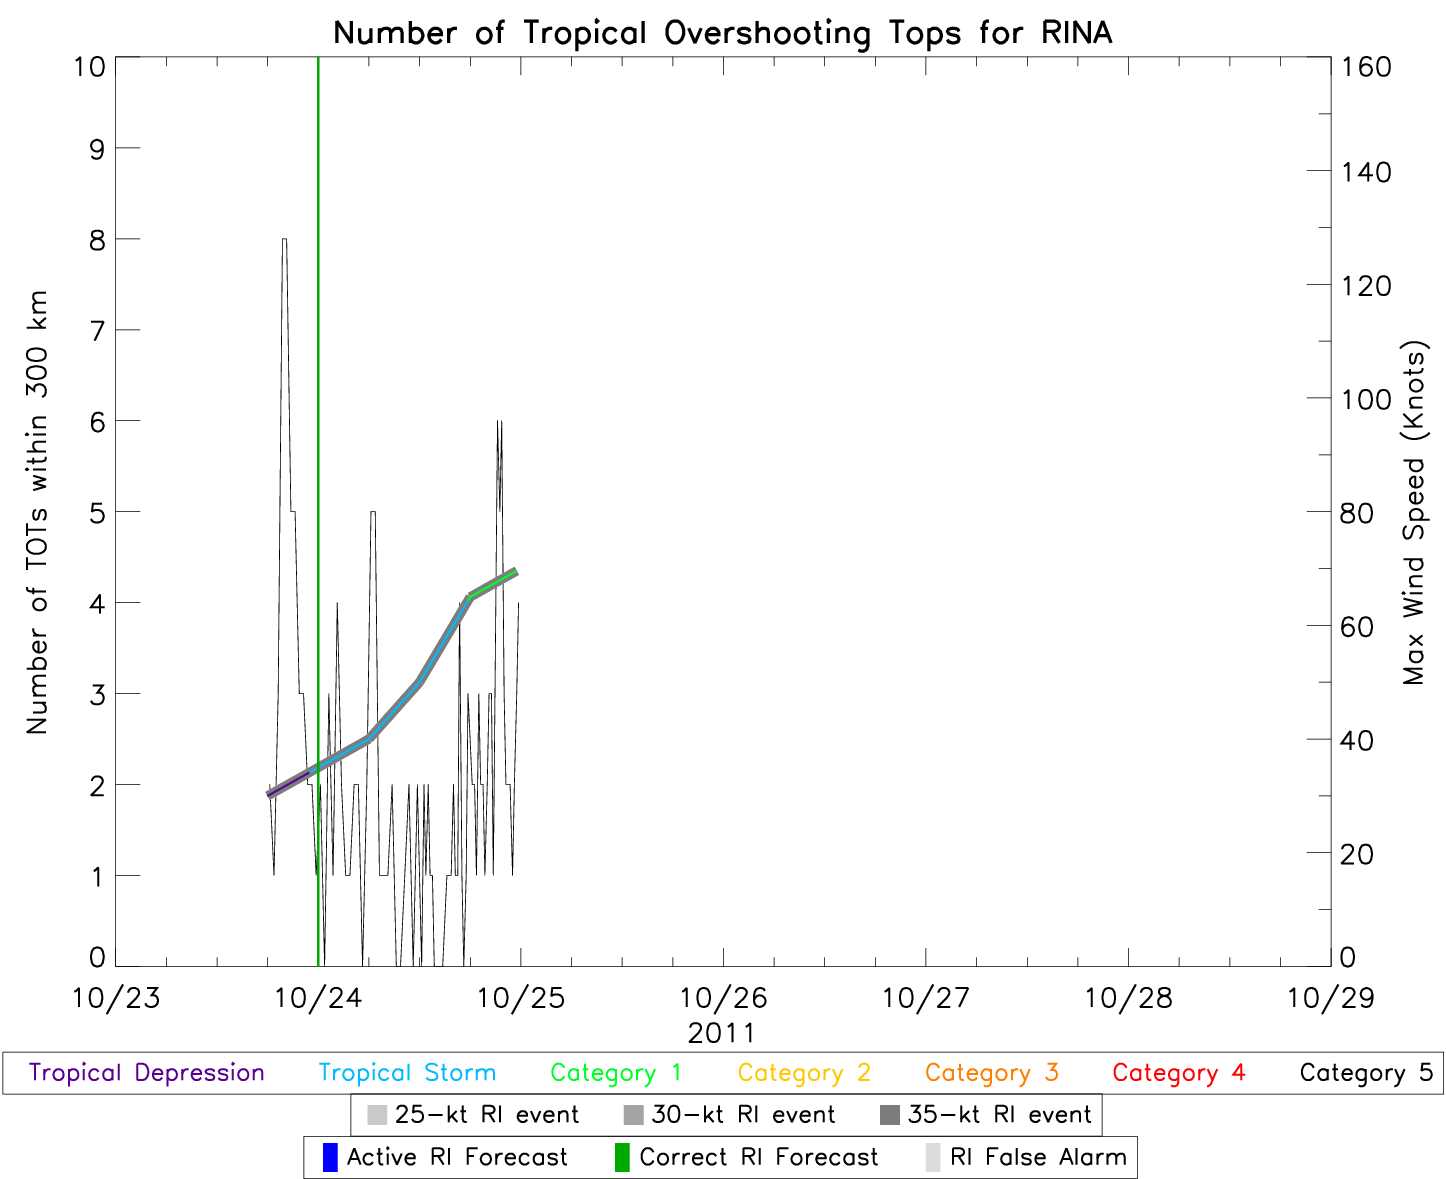
TOTs within 300 km of Rina's center are counted and RI is correctly forecasted at 00Z on 24 Oct 2011.
Genesis:
Research in progress The number of TOTs within 200 km of a pouch will be
monitored. Analysis based on a dependent sample using 2010 and 2011 has been showed to be skillful. Below is an example from Emily (2011). Data from 2012 will be used as independent analysis.
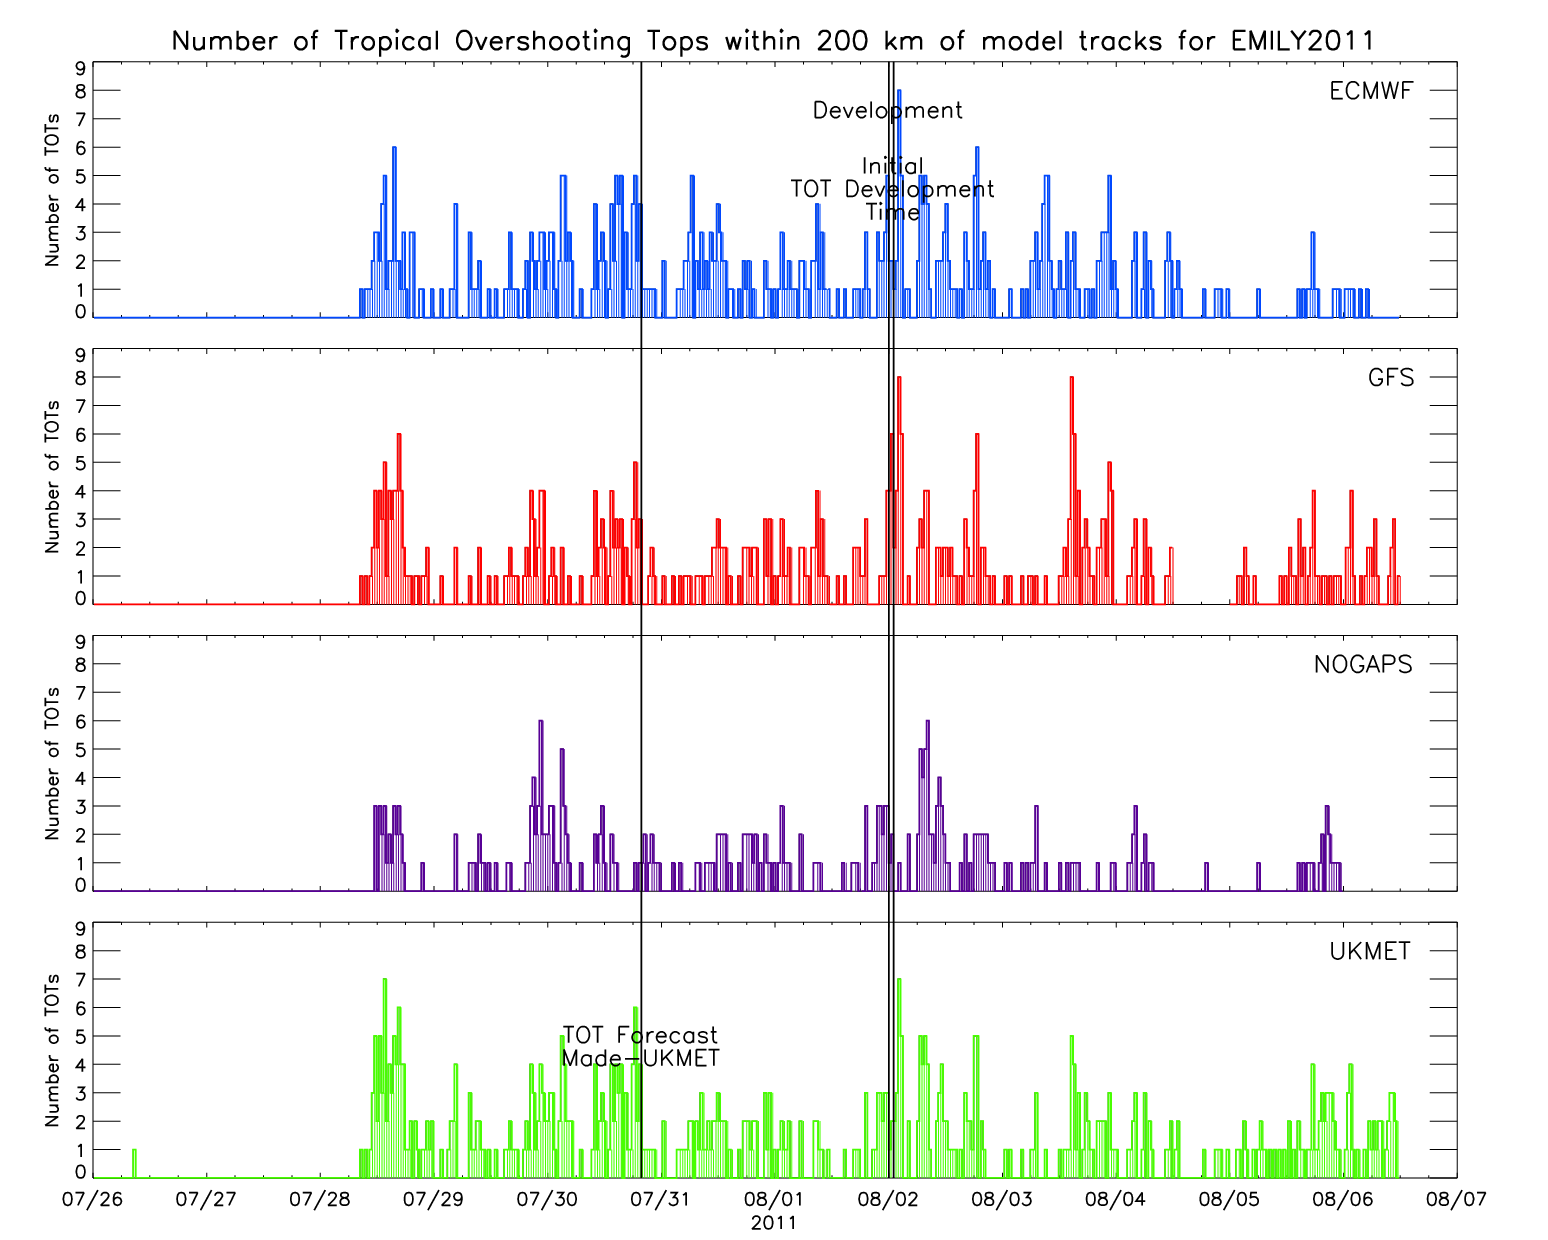
TOTs with 200 km of 4 NWP model pouch centers are counted. The genesis of Emily (2011) is forecasted with a few hours of actual genesis.
Aviation
TOTs have been used to identify potential areas of aircraft turbulence during tropical cyclone field campaigns. An example from the PREDICT mission coordinator
display from 1445 UTC on 28 Sept. 2010, which shows the flight diverting around a TOT(purple square). Future research in this area includes assigning
heights to TOTs and comparing TOT heights/location to Eddy Dissipation Rate (EDR) data from Delta and United flights.
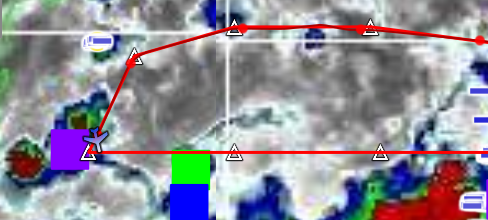
TOT locations (indicated by the colored squares) are represented in the PREDICT mission coordinator display. The aircraft (aircraft symbol) is
diverting from its original (red) track to avoid potential turbulence.