")
GOES-13 10.7 µm IR images + surface frontal analysis (click image to play animation)
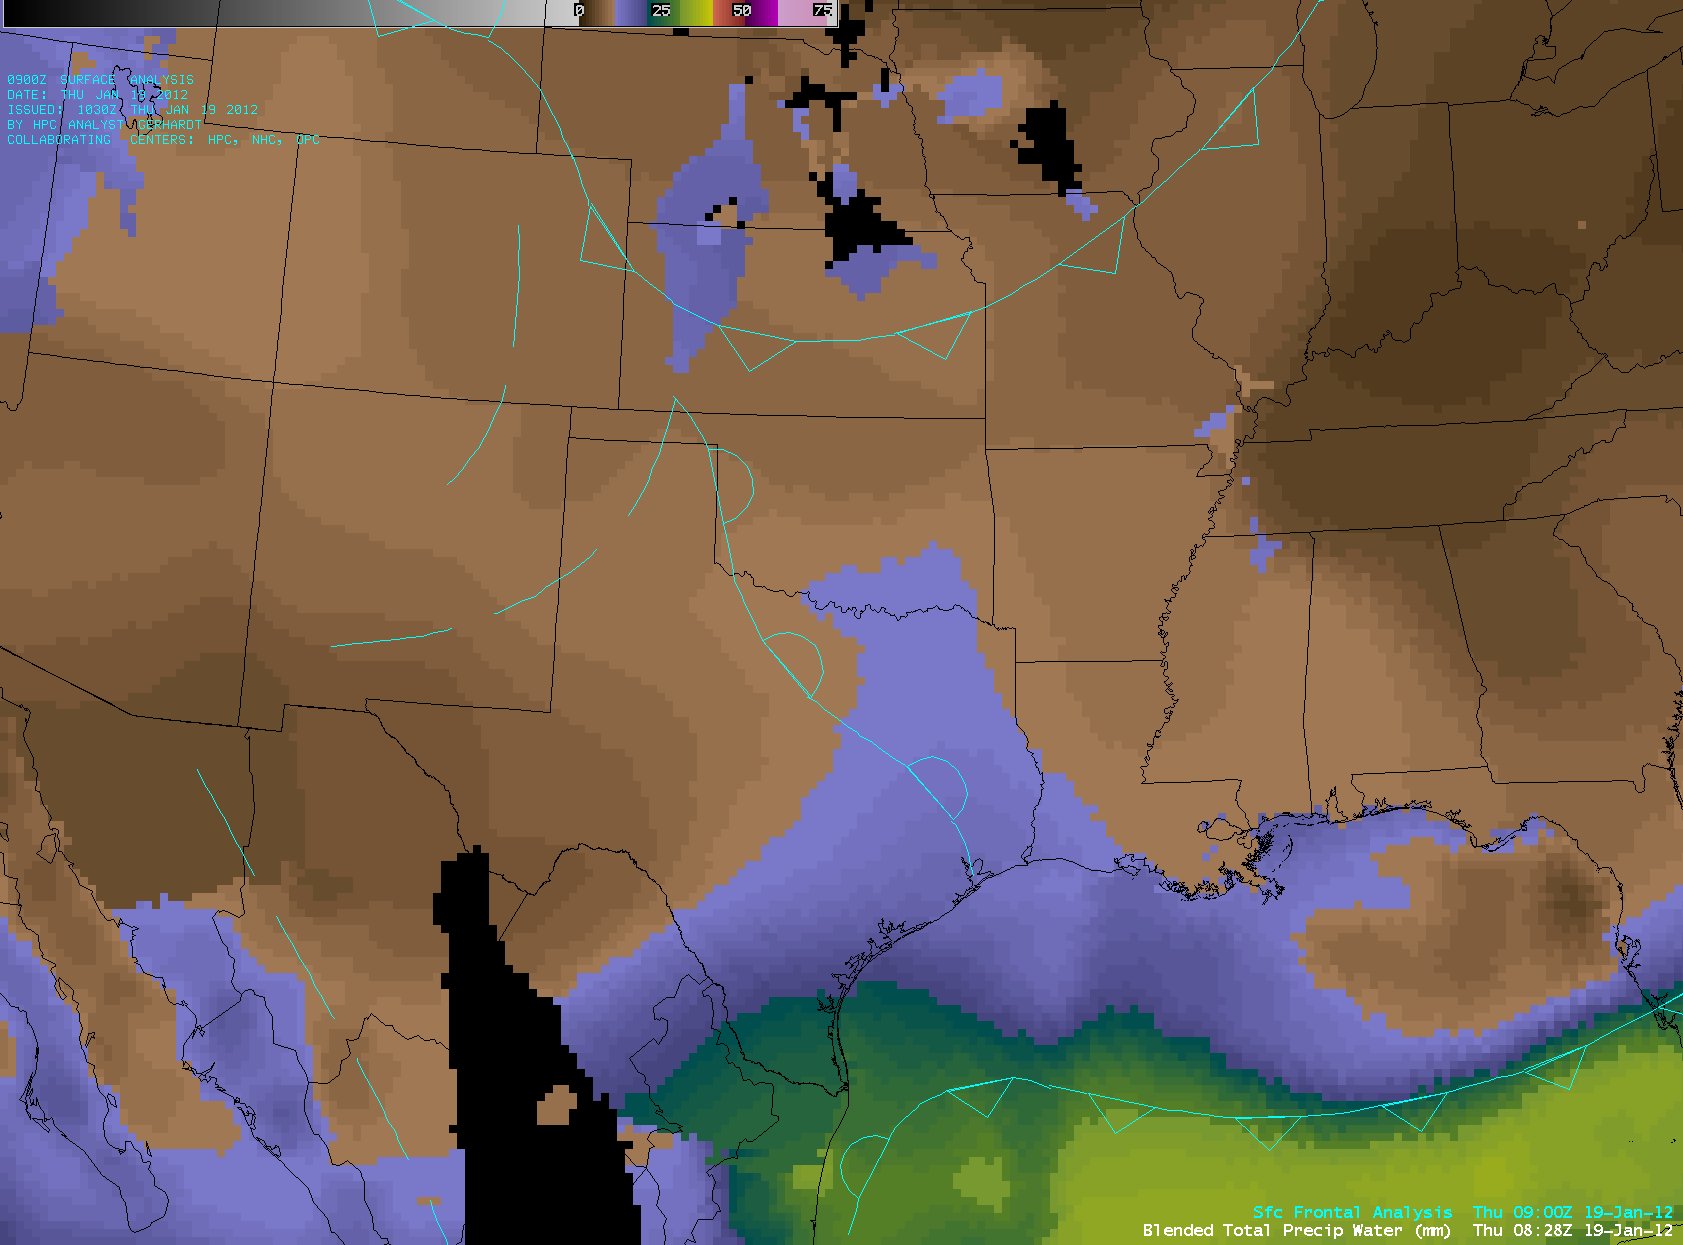
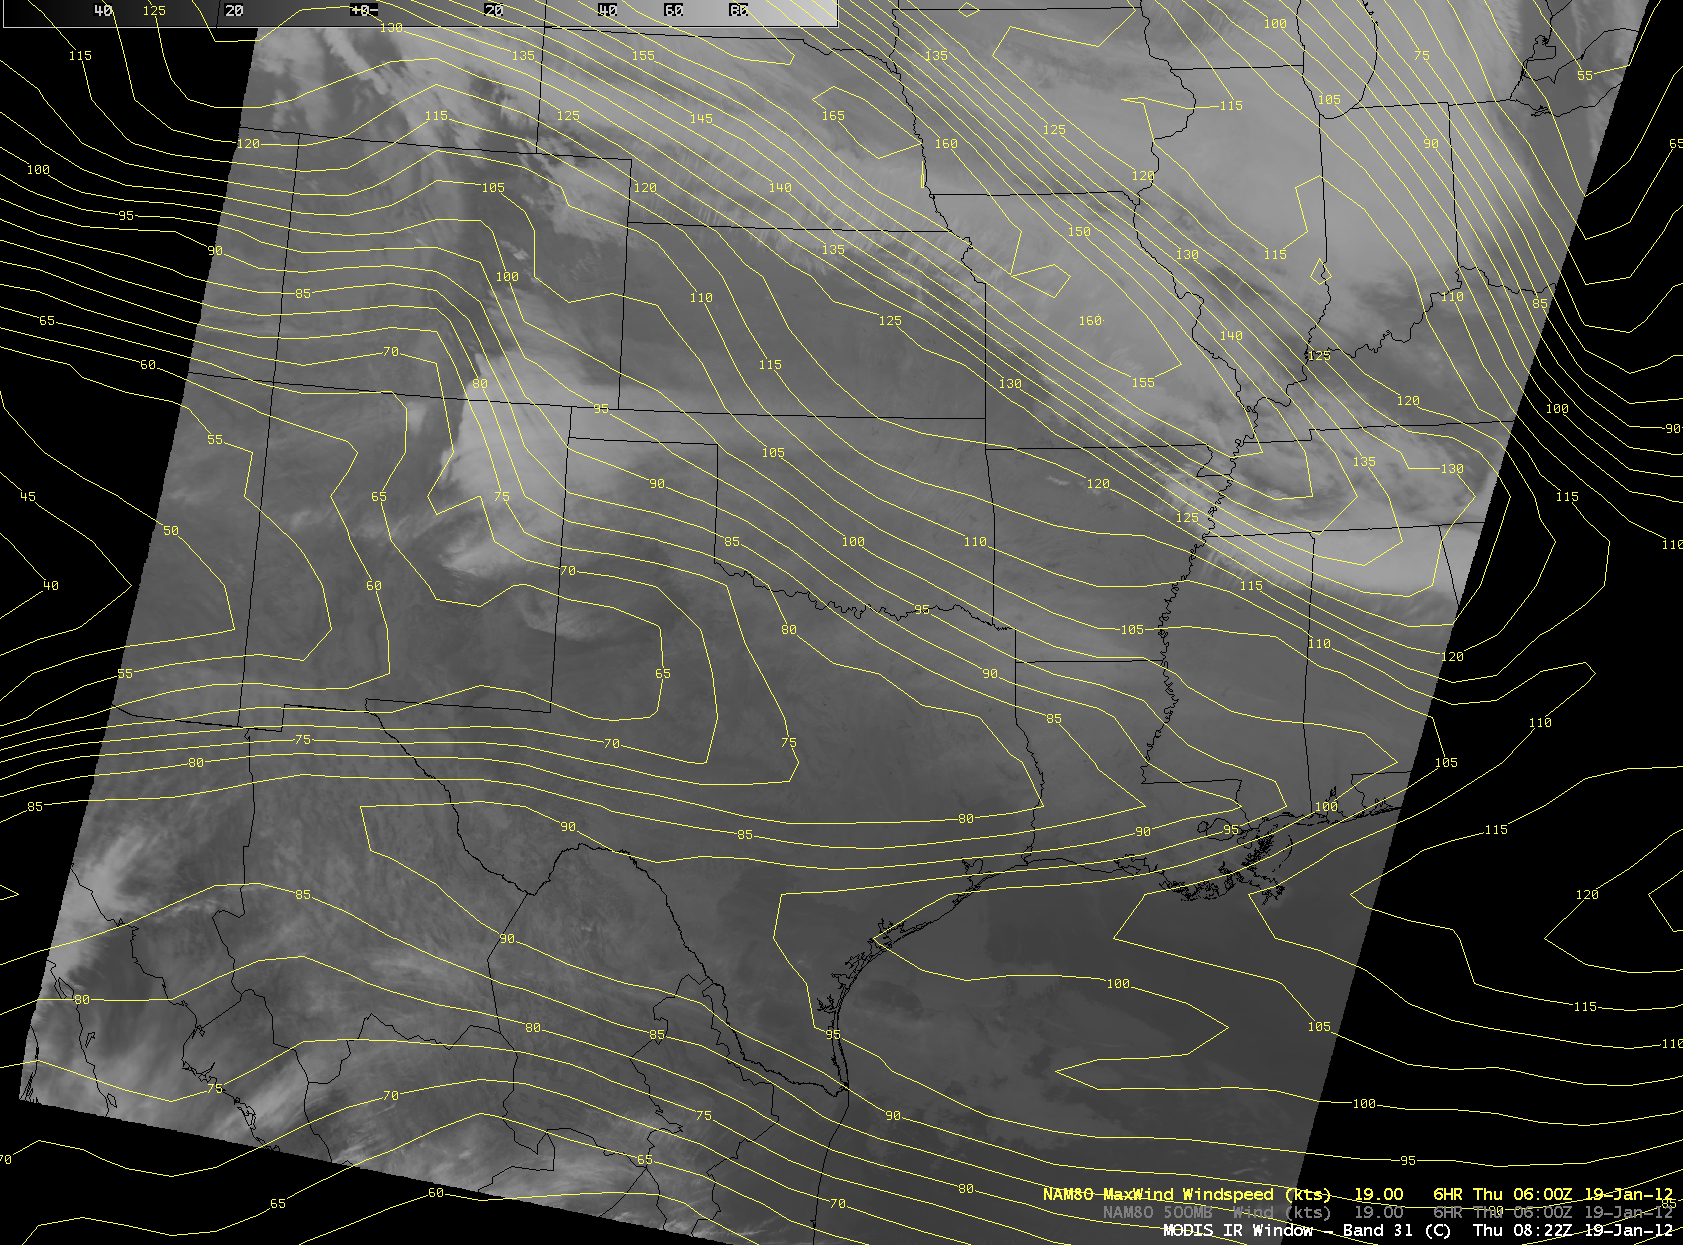
AWIPS images of 4-km resolution GOES-13 10.7 µm IR data (above; click image to play animation) showed a variety of cloud features across the central and southern US between 07:01 UTC and 09:30 UTC on 19 January 2012. In particular, note (1) the darker gray (warmer) low clouds streaming northward from the Gulf of Mexico into Texas, signalling a northward return flow of low-level moisture (Total Precipitable Water values of 15-25 mm); (2) a large lighter gray (colder) banner cloud extending downwind of the Rocky Mountains, due to northwesterly flow aloft interacting with the high terrain; and (3) a long lighter gray (colder) cloud band exhibiting some transverse banding, associated with a strong 165-knot core jet stream flowing southeastward from Nebraska to Tennessee.
Below are corresponding examples of 1-km resolution IR images from polar-orbiting satellites from the 08:22 to 08:43 UTC time period. The oldest “legacy” instrument is the AVHRR, carried on the constellation of NOAA POES satellites. A newer instrument is the MODIS, carried on the NASA Aqua and Terra satellites. The most recently-launched satellite is the NASA NPP, which carries the VIIRS instrument.

POES AVHRR 12.0 µm IR image

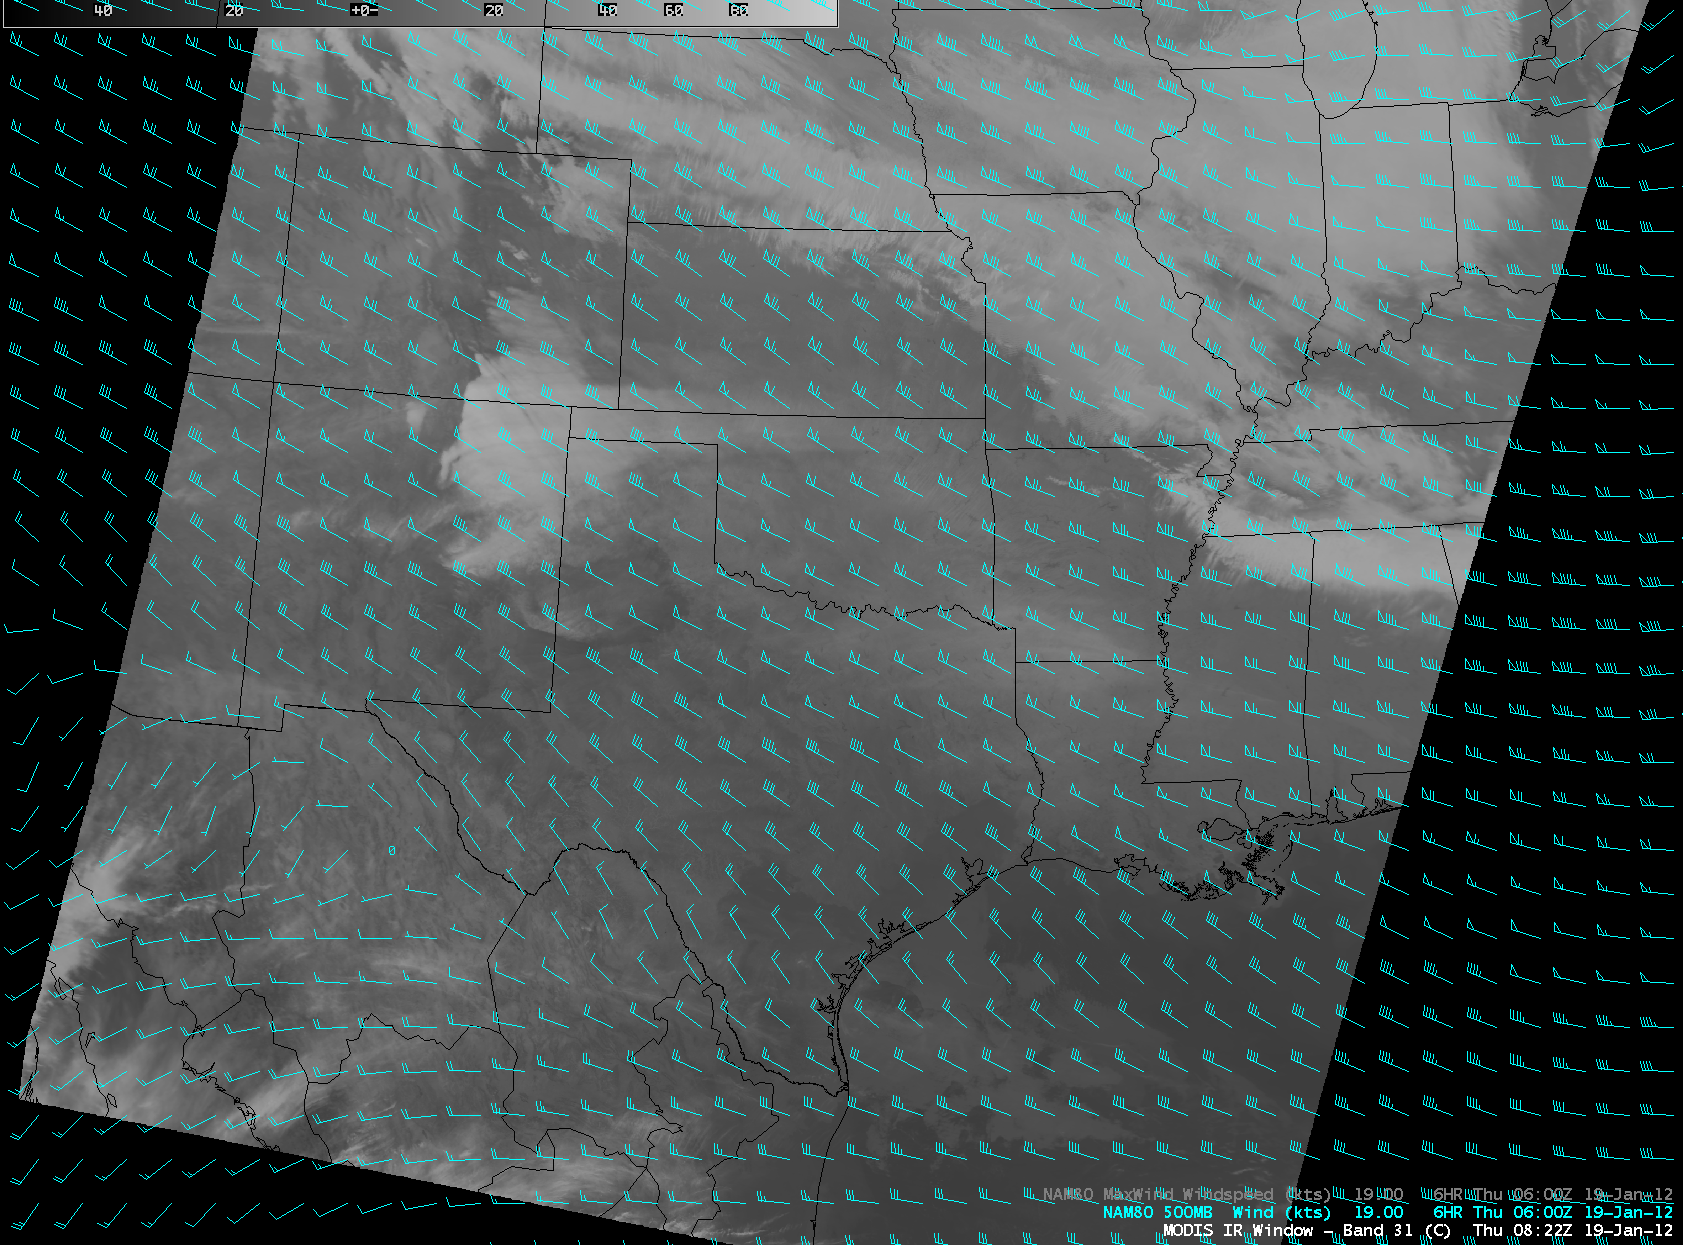
Aqua MODIS 11.0 µm IR image

NPP VIIRS M15 10.763 µm IR image
")
NPP VIIRS 10.763 µm IR image (viewed using Google Earth)
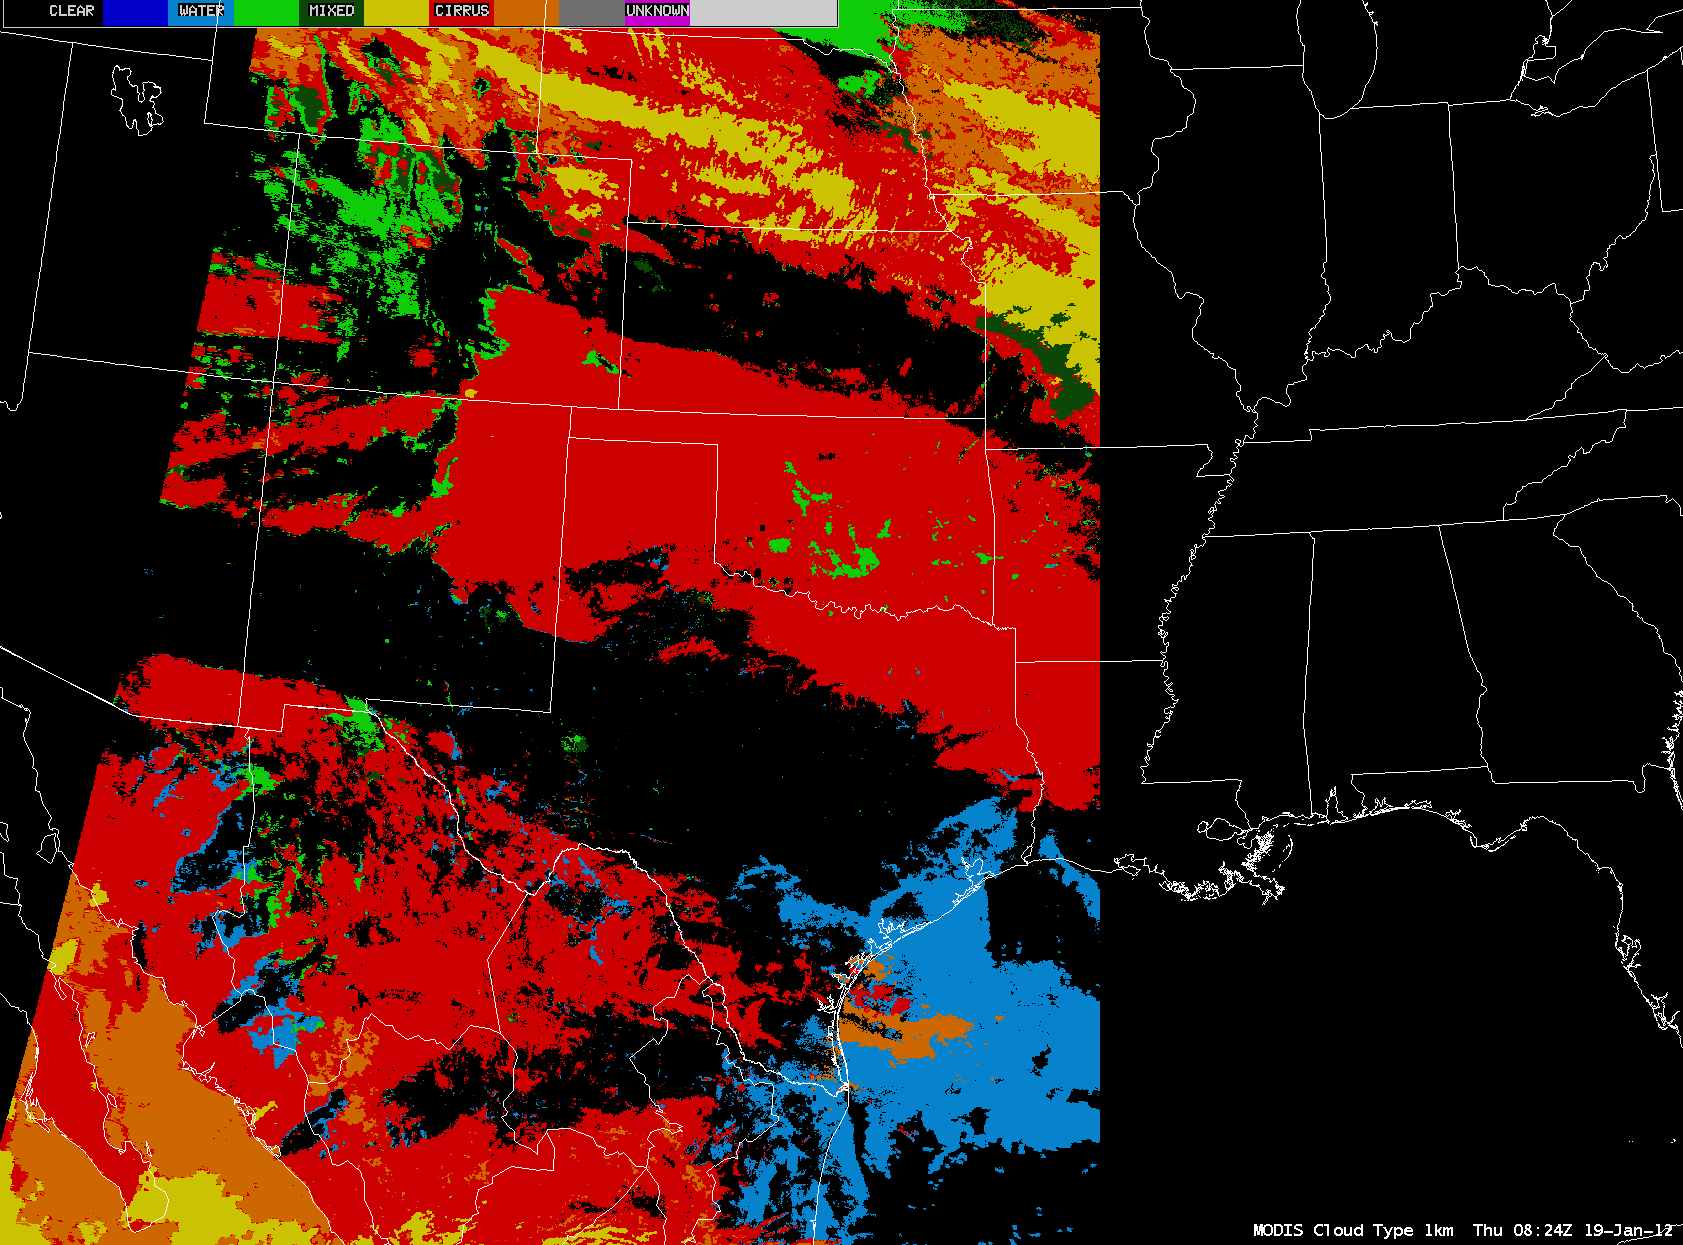
Images such as these from polar-orbiting satellites are available less frequently that those from GOES, but they offer a more detailed view of cloud features due to improved spatial resolution. The more modern instruments such as MODIS and VIIRS also contain many more channels (or spectral bands) than are available from the current generation of GOES satellites. These additional bands allow the creation of a variety of quantitative satellite products.
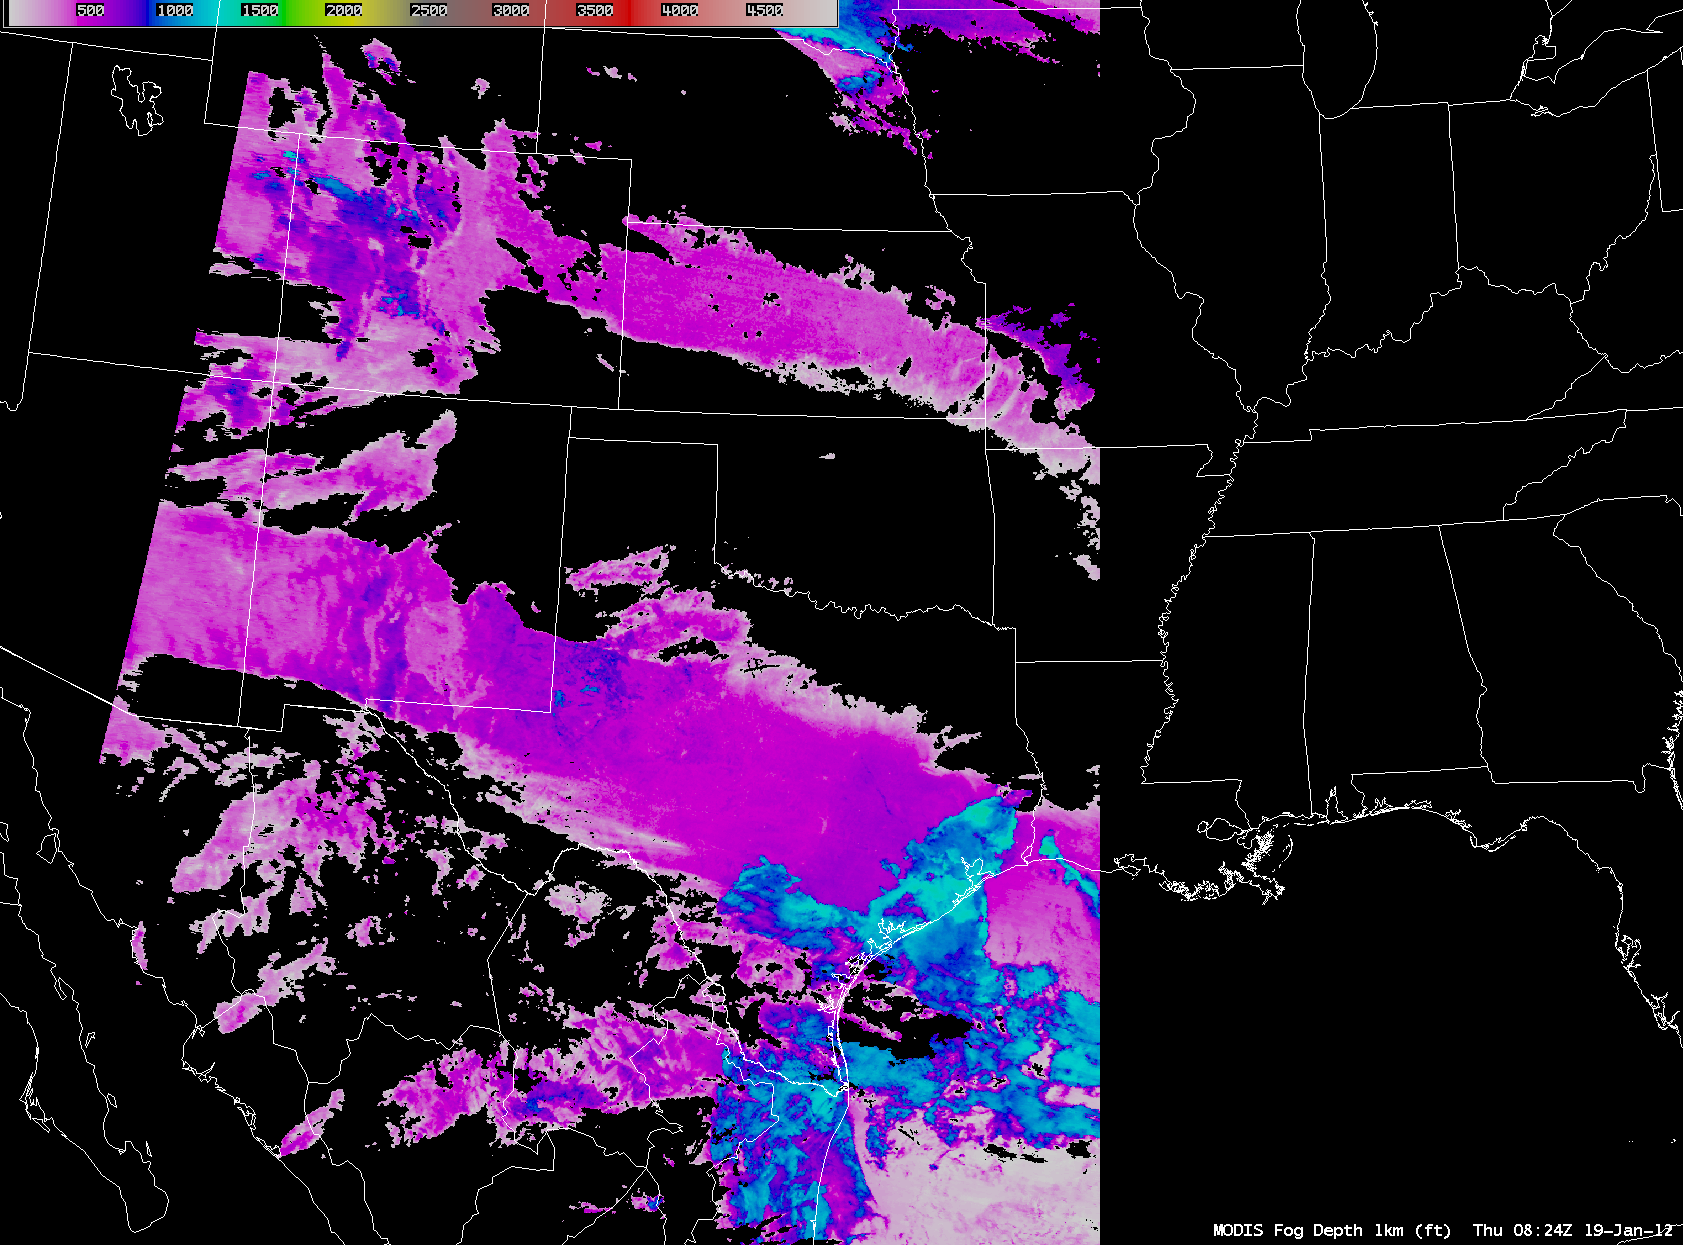
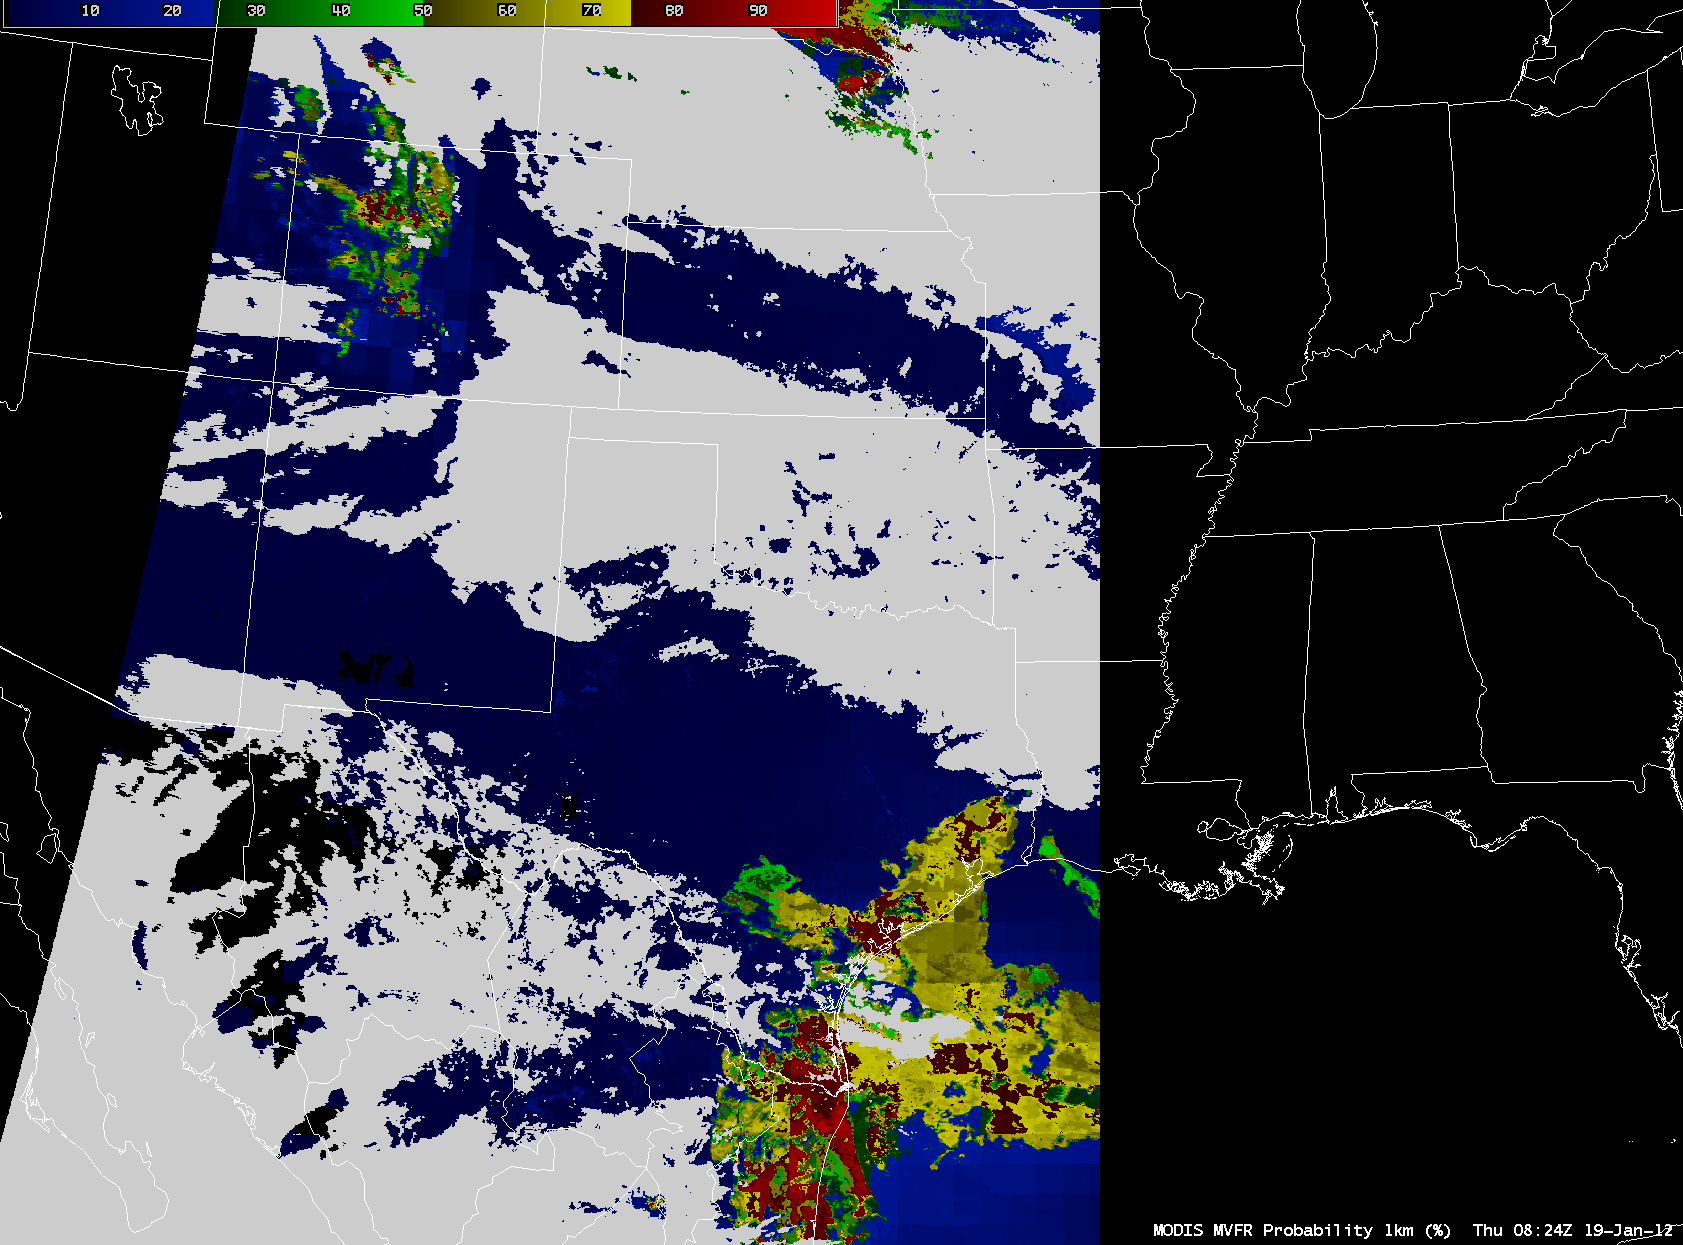
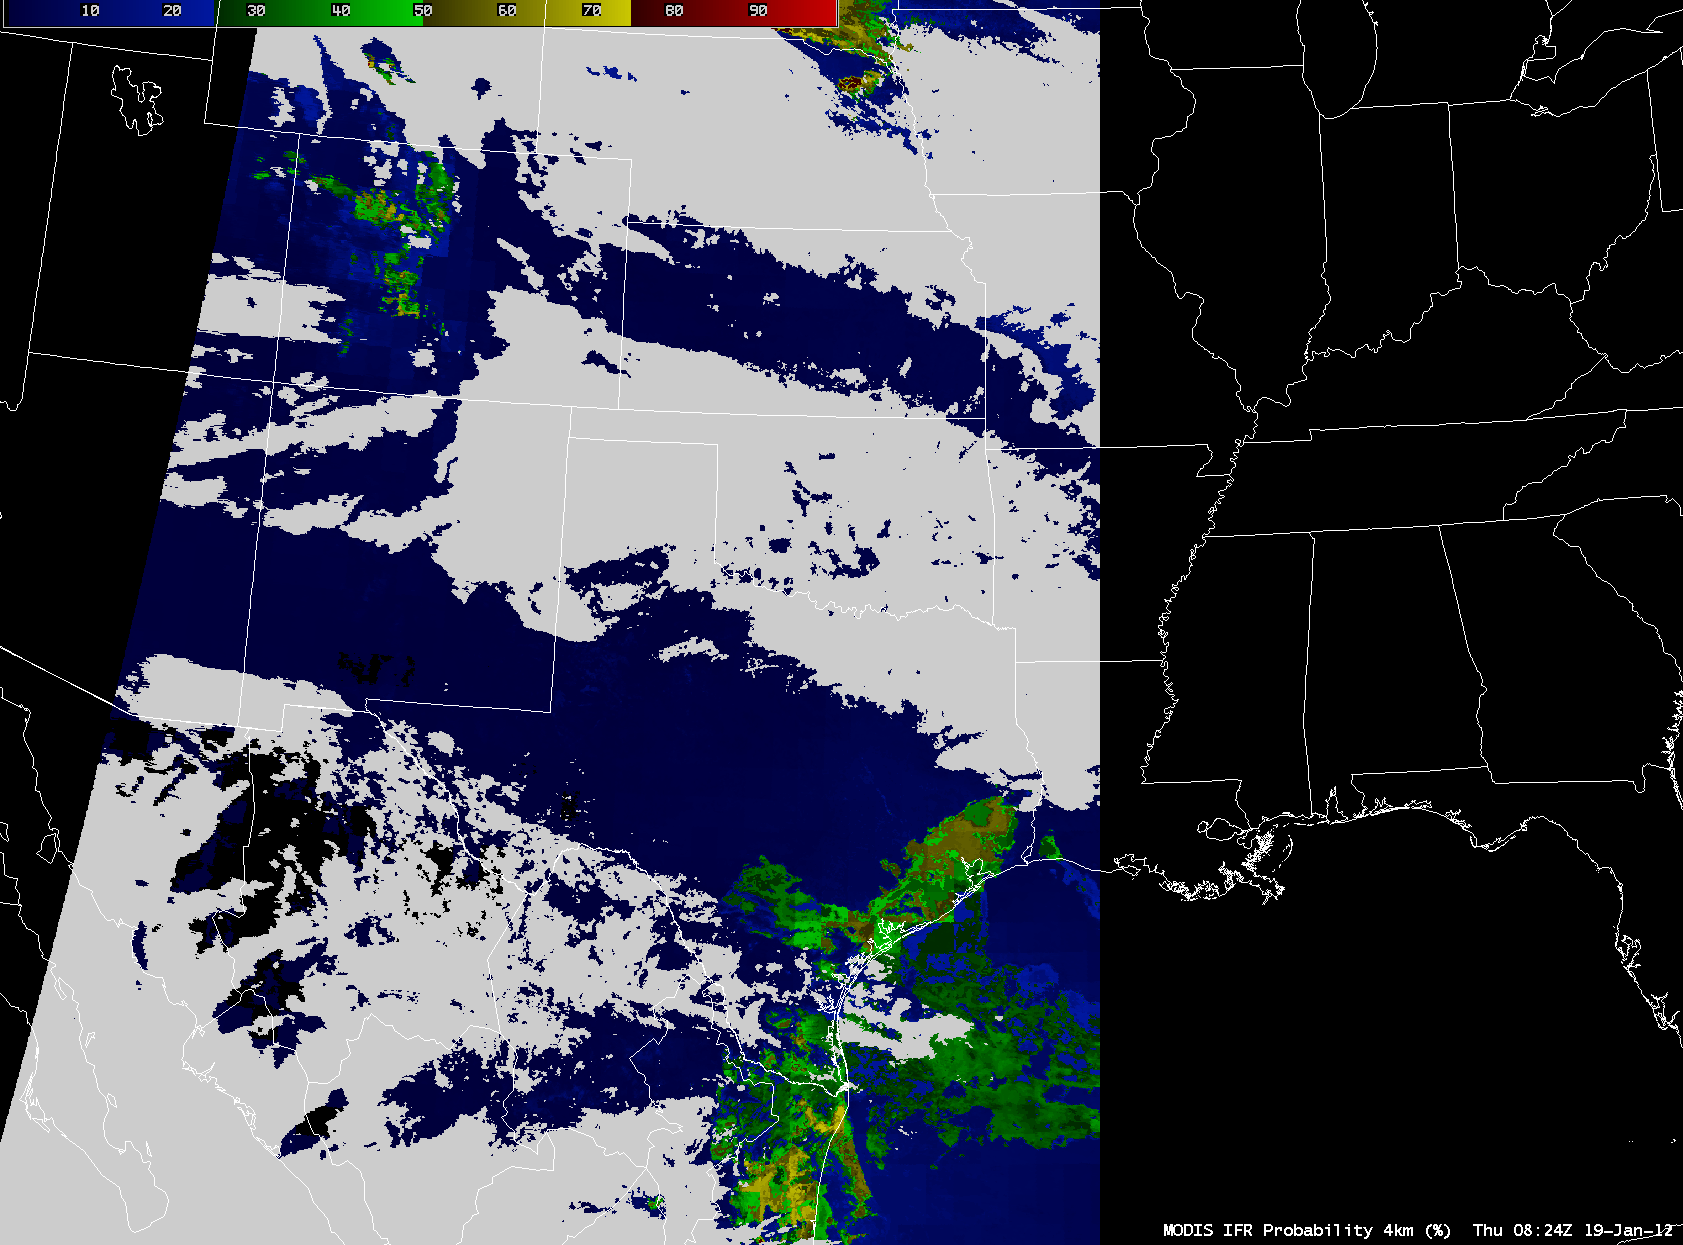
For example, if we focus our attention on the low cloud features in Texas, using MODIS data we can be more descriptive in terms of the Cloud Type (water), Fog Depth (as deep as 1300 feet), and Probability of Marginal Visual Flight Rules MVFR (as high as 70-80%) or Probability of Instrument Flight Rules IFR (as high as 50-60%).
View only this post Read Less
")
")


