 and after (17 September) MODIS false-color Red/Green/Blue (RGB) images")
Before (07 September) and after (17 September) MODIS false-color Red/Green/Blue (RGB) images
A comparison of “before” (07 September 2013) and “after” (17 September 2013) 250-meter resolution MODIS false-color Red/Green/Blue (RGB) images from the SSEC MODIS Today site (above) showed a dramatic change in the appearance of the South Platte River that flows northeastward across northeastern Colorado. Following the record-setting rainfall across much of the Front Range of Colorado (previous blog post), much of this water (darker blue in appearance on the RGB images) was being carried across northeastern Colorado by the South Platte River and its tributaries.
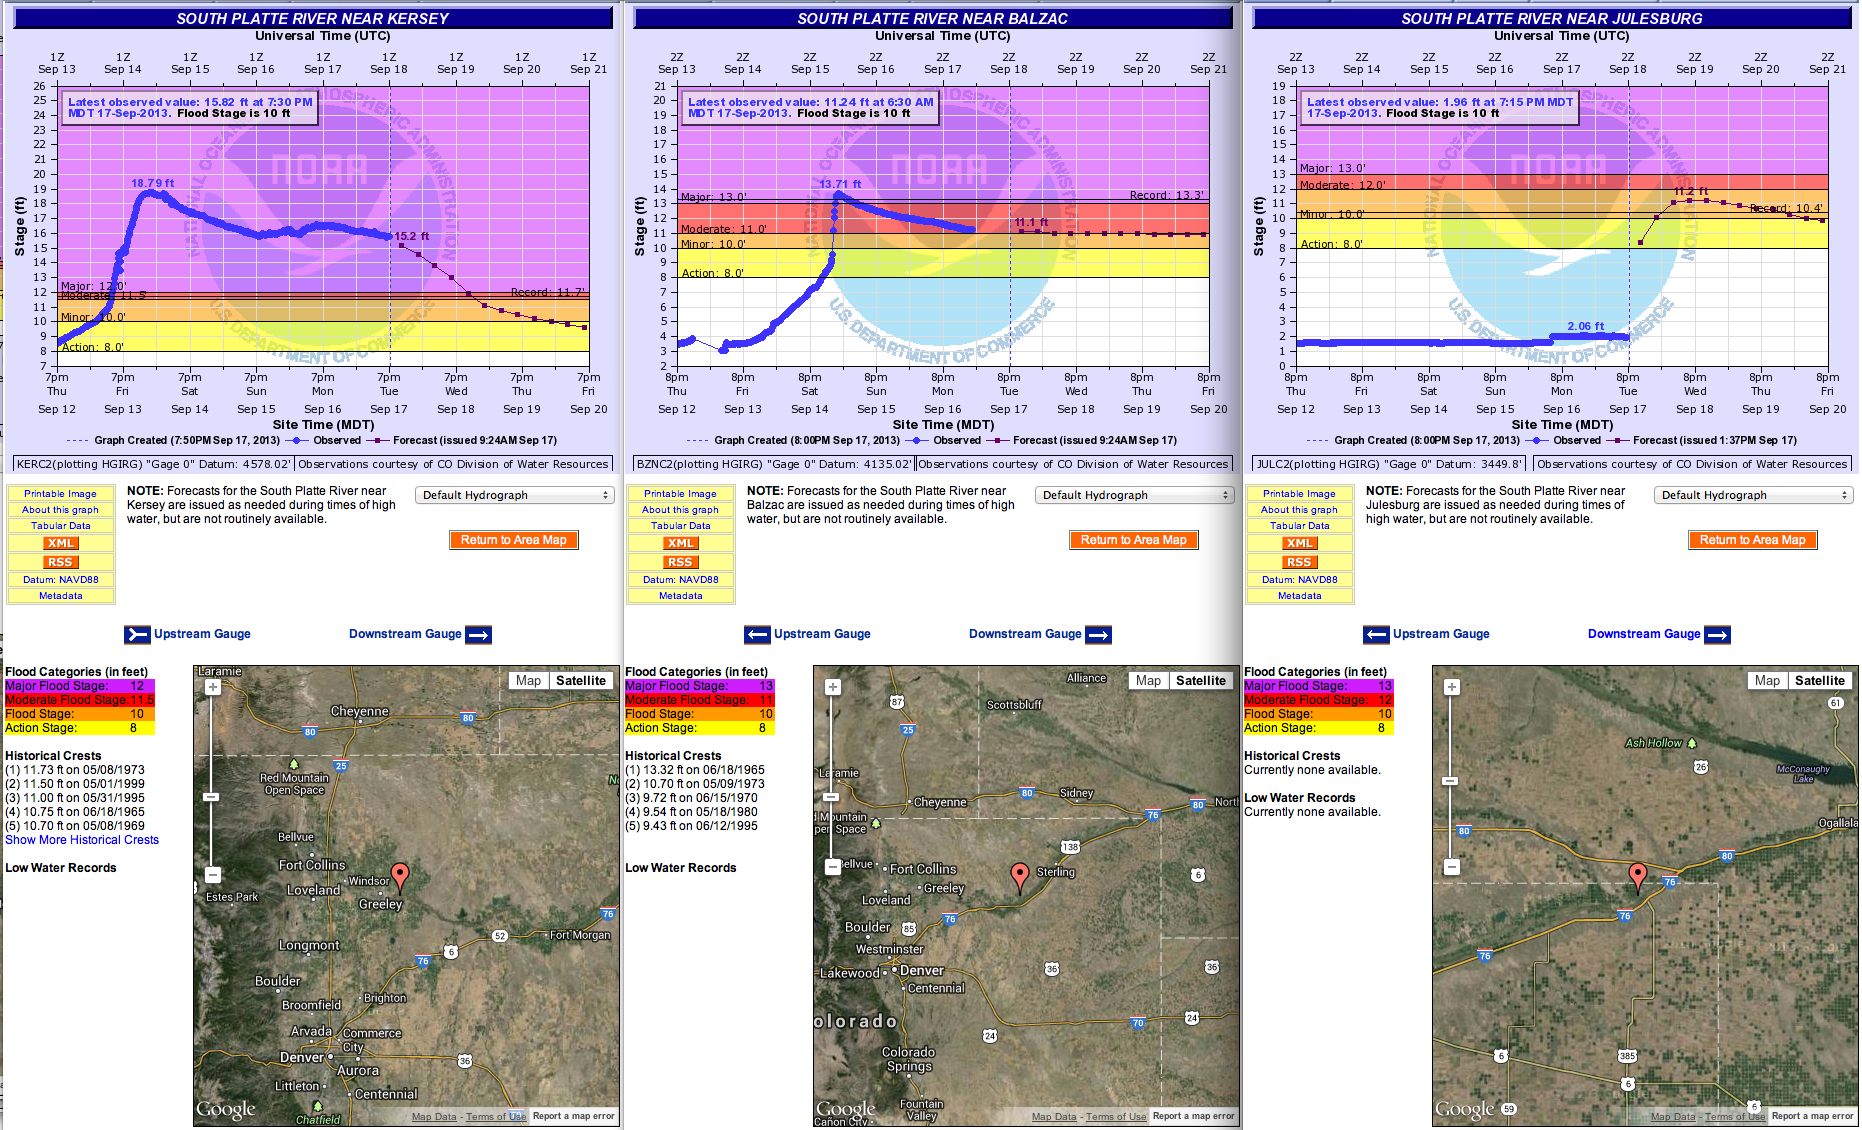
Hydrographs for 3 different locations along the South Platte River in Colorado (Kersey, Balzac, and Julesburg, below) showed the actual and forecast maximum river crests — note that the peak river crest of 18.79 feet at Kersey eclipsed the previous record of 11.7 feet set in 1973.
A comparison of AWIPS images of consecutive overpasses (1 hour and 44 minutes apart) of Suomi NPP VIIRS 1.61 µm near-IR data on 14 September (below) appeared to indicate that the dark signal of the leading edge of the South Platte River flooding could be seen moving rapidly southeastward along that particular portion of the river.
The Suomi NPP VIIRS 1.61 µm image at 19:58 UTC on 17 September (below) showed that the dark signature of flooding along the South Platte River had nearly reached the Colorado/Nebraska border.
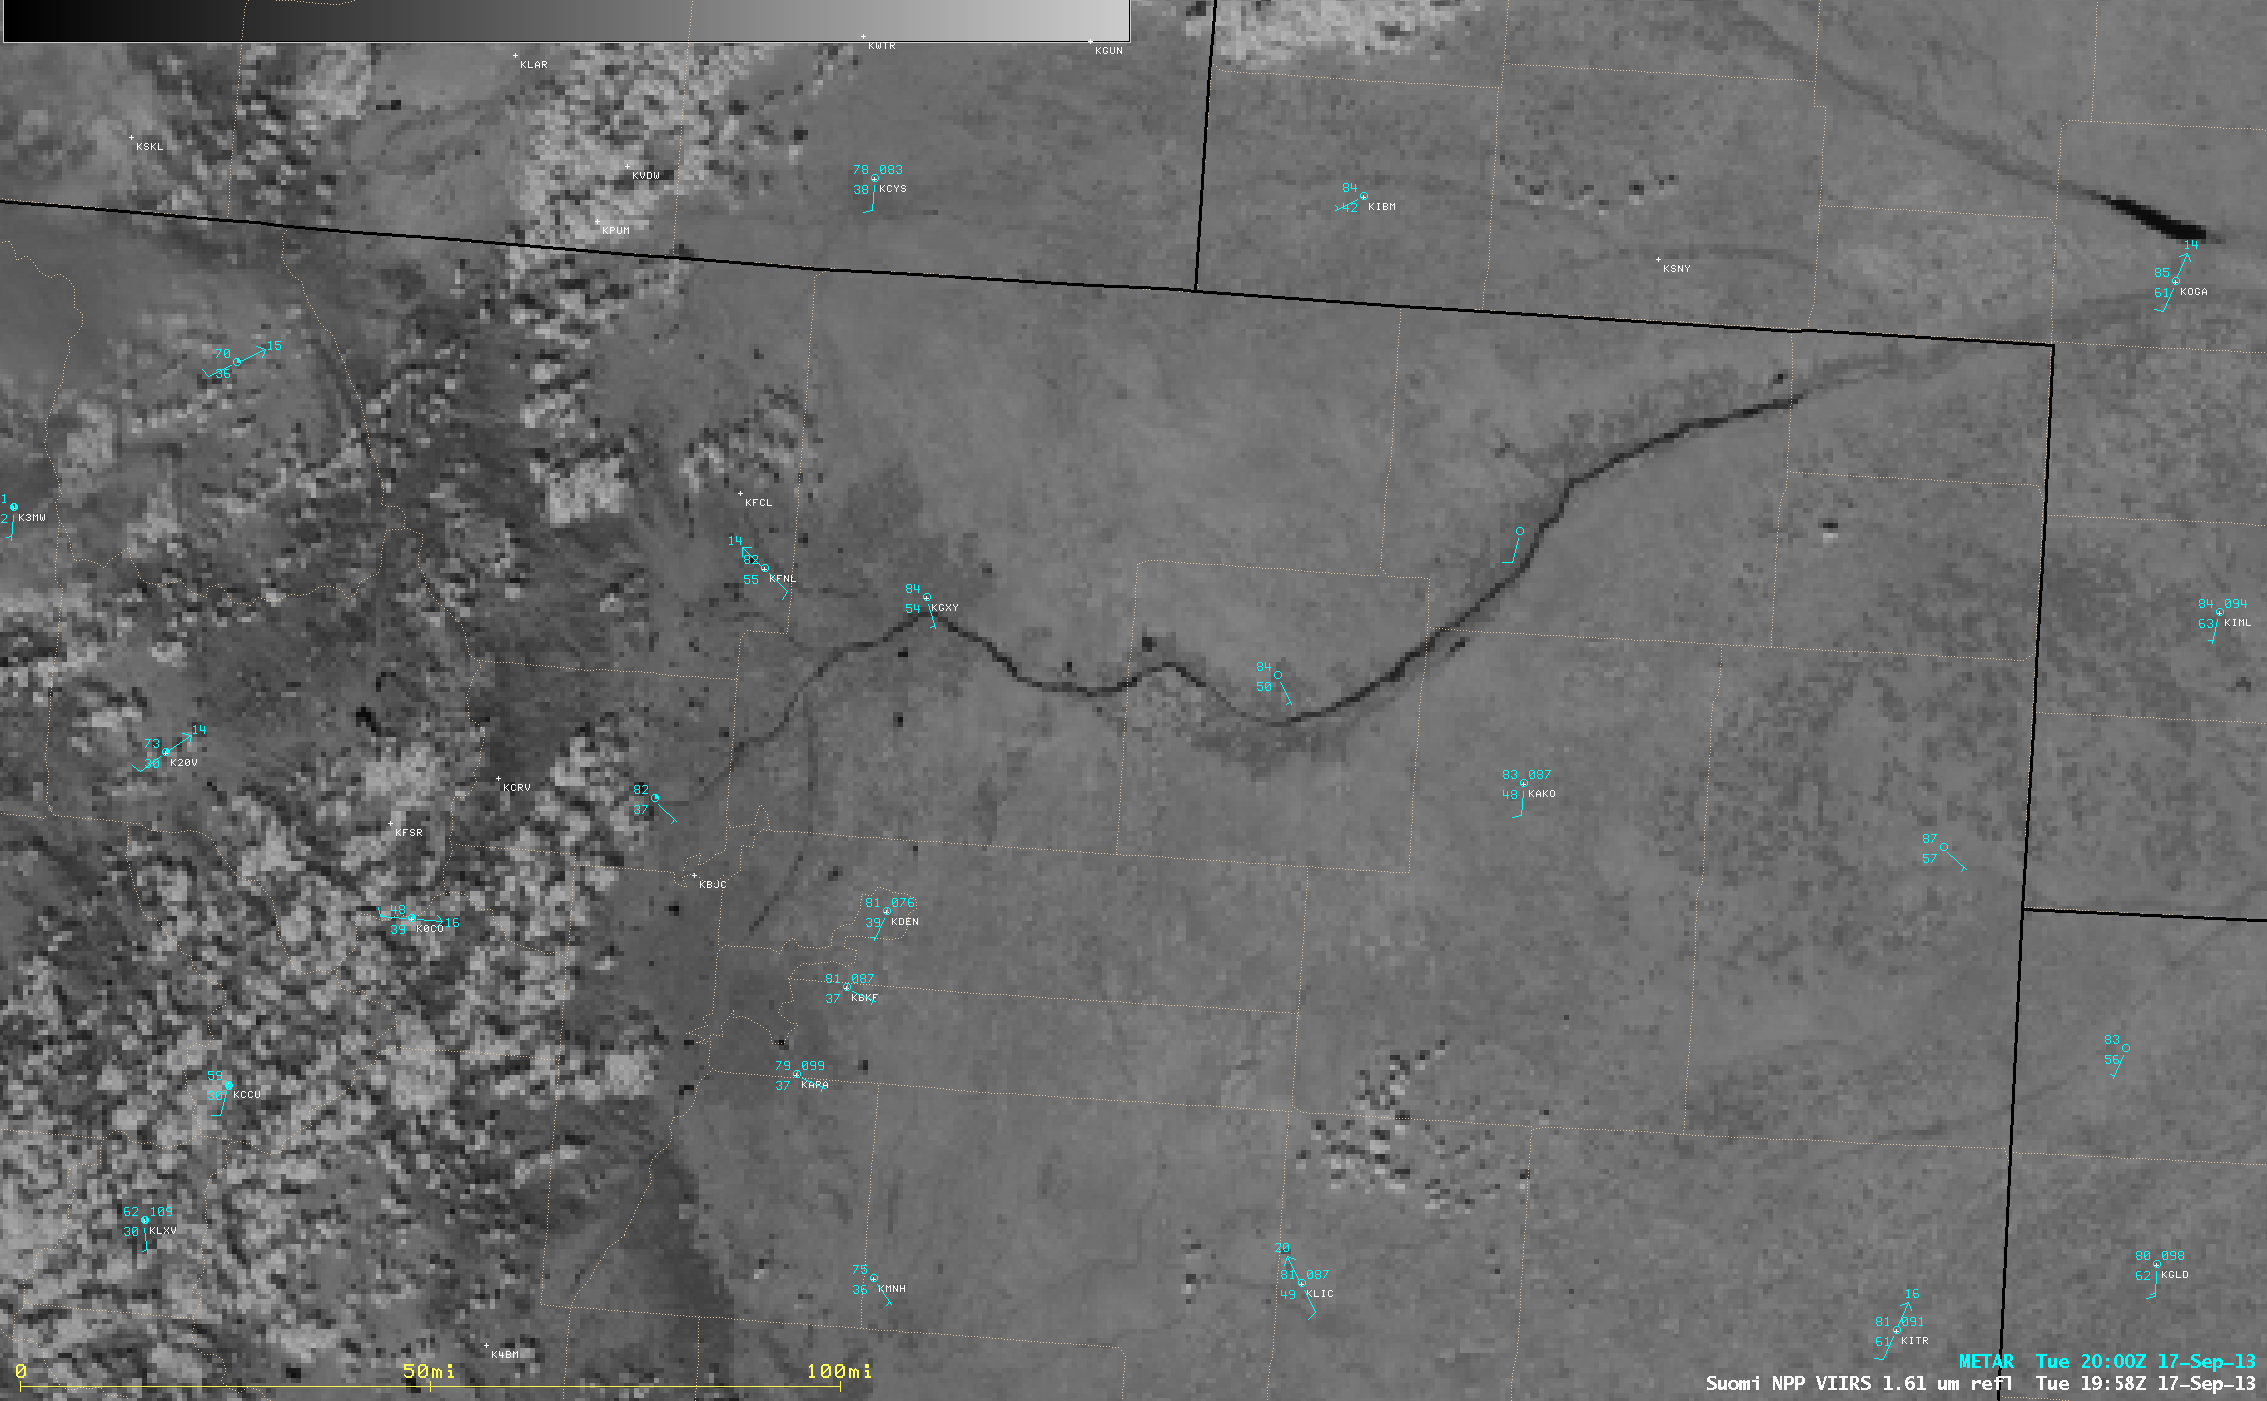
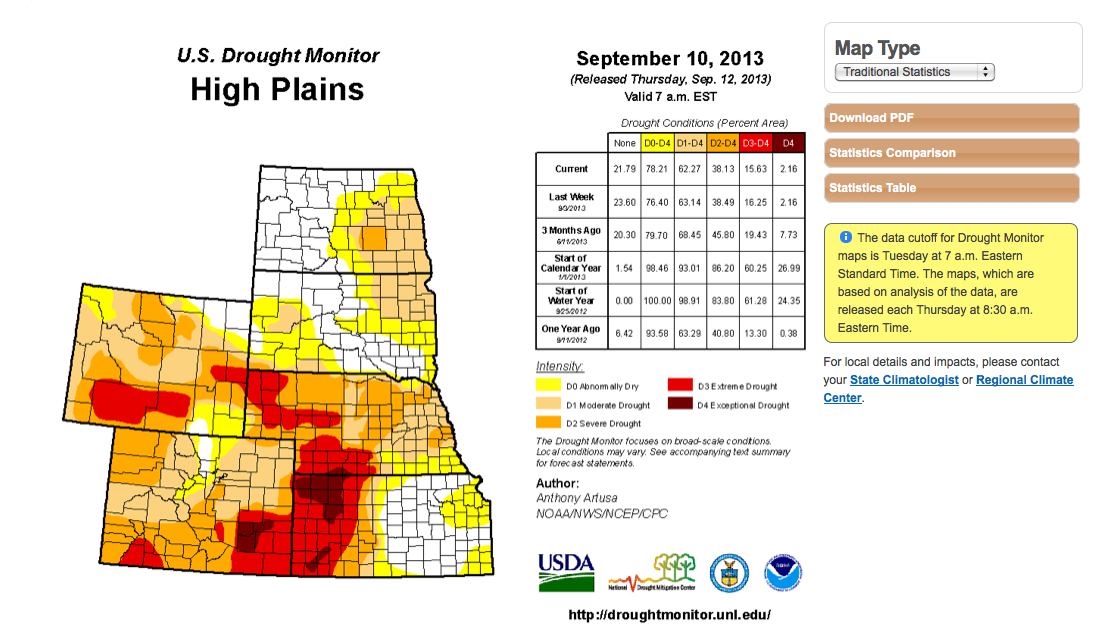
Note that the South Platte River flooding is not evident on the corresponding 0.64 µm VIIRS visible channel image (below) — this is due to the fact that there is not much contrast between the sediment-rich water and the adjacent dry soils (much of northeastern Colorado remains in a drought).

Suomi NPP VIIRS 0.64 µm visible channel and 1.61 µm near-IR channel images
===== 18 September Update =====
")
Suomi NPP VIIRS 1.61 µm near-IR images (17 vs 18 September)
A comparison of AWIPS images of Suomi NPP VIIRS 1.61 µm near-IR images (above) showed the progression of the leading edge of the flooding along the South Platte River in a 24-hour period (from 19:58 UTC on 17 September to 19:42 UTC on 18 September). The dark signal of river flooding had extended northeastward across the Nebraska border.
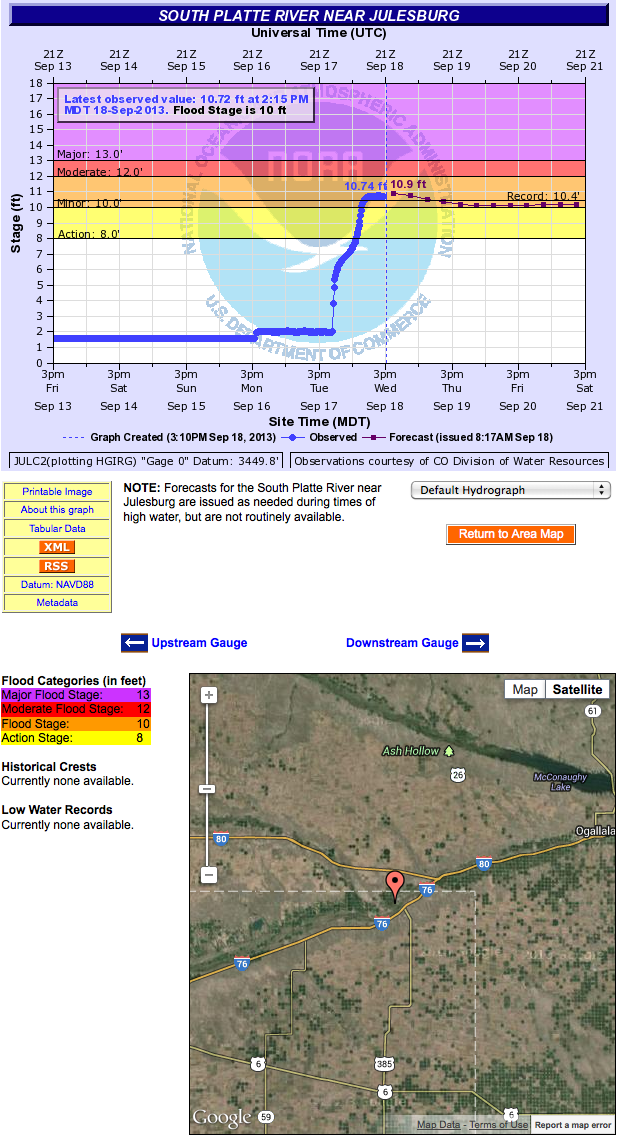
The hydrograph for Julesburg in far northeastern Colorado (below) showed that the river had already crested above the previous record stage of 10.4 feet.

Julesburg, Colorado hydrograph
View only this post Read Less
")
")
")


")

")
