
Suomi NPP VIIRS 0.7 µm Day/Night Band image
The first accumulating snowfall of the season reported in the higher elevations of Colorado was on 19 September 2013 in the vicinity of Breckenridge Ski Resort, but a cold front associated with an upper-level trough of low pressure passing through the state on 22 September brought several inches of snow accumulation to much of the higher elevation mountain ranges. Once clouds had cleared the region, the coverage of the resulting snowfall could be seen on satellite imagery. A “visible image at night” was provided by Suomi NPP VIIRS 0.7 µm Day/Night Band data at 09:43 UTC or 3:43 AM local time on 24 September (above), which not only showed the bright lights from cities and towns, but also moonlight reflected by the snow cover located in the higher terrain (the Moon on this date was in the Waning Gibbous phase at 70% of full, providing ample illumination of the snow).
The following afternoon remained cloud-free over Colorado, allowing a good daytime view of the snow-covered mountains on a VIIRS 0.64 µm visible channel image at 19:29 UTC or 1:29 PM local time (below). A comparison with the corresponding VIIRS false-color Red/Green/Blue (RGB) image — which depicts snow as varying shades of red, depending on depth and water content — verified that the brighter white features seen on the visible image were areas with snow cover, and not clouds.

Suomi NPP VIIRS 0.64 µm visible channel and false-color RGB composite images
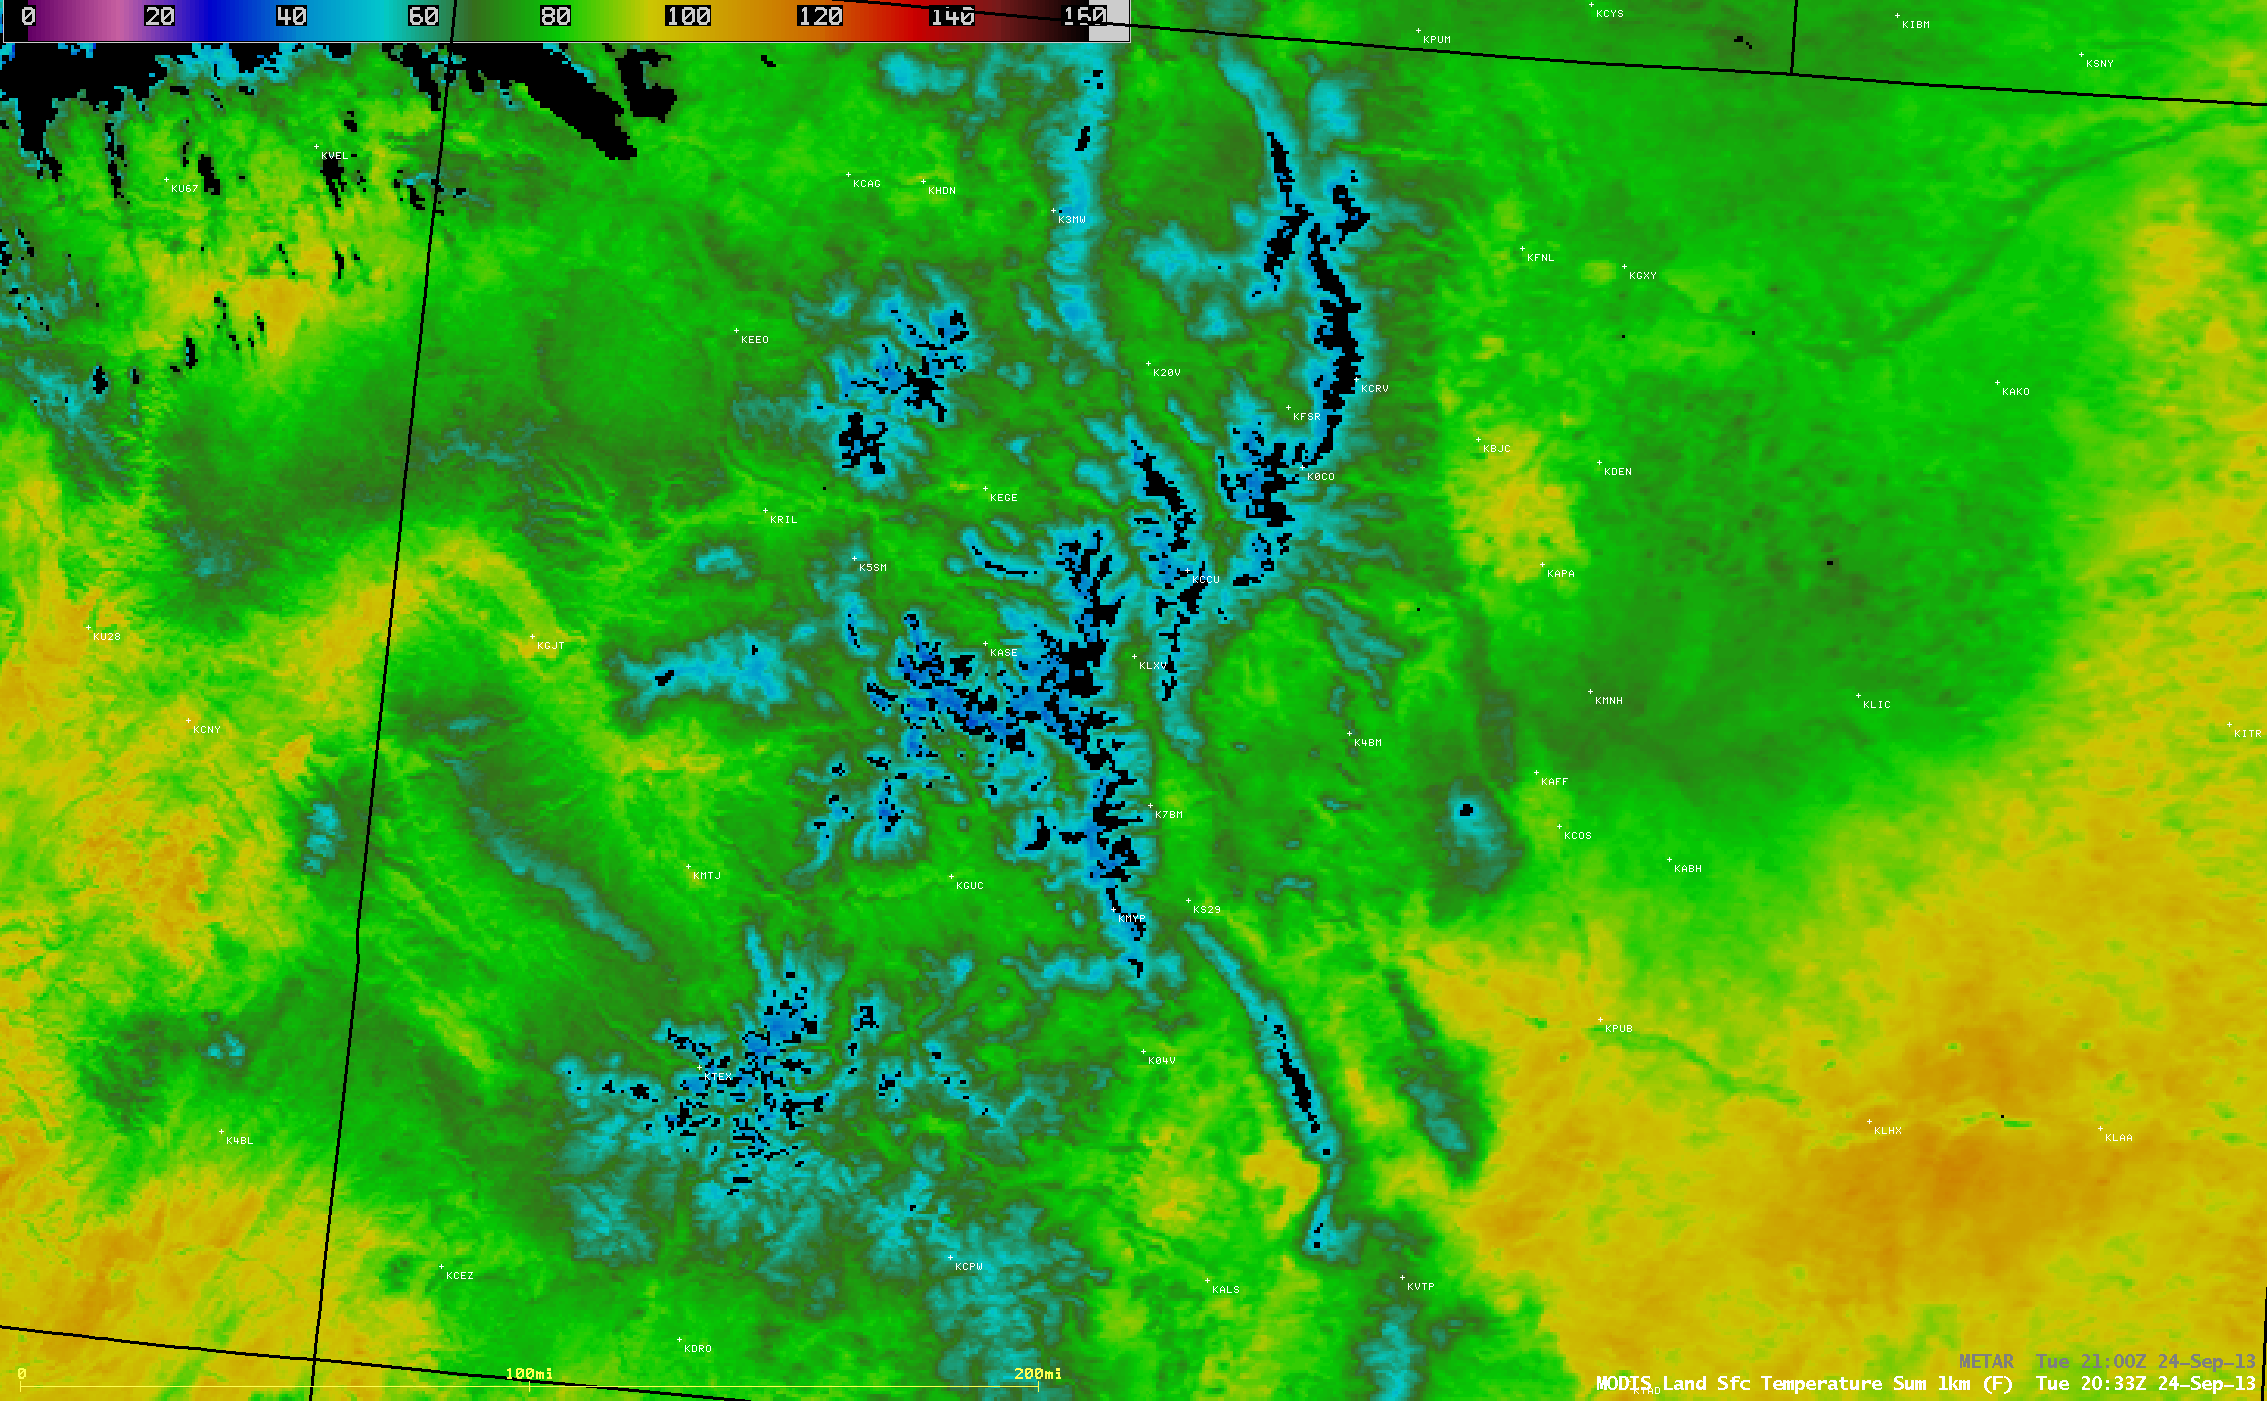
The MODIS Land Surface Temperature (LST) product at 20:33 UTC or 2:33 PM local time (below) showed a large range in LST values across the state, from 100-110º F (darker orange color enhancement) over the dry soils of the southeast, to lower to middle 30s F (darker blue color enhancement) over some the snow-covered higher elevations of the Rocky Mountains. The areas of black appearing within the coldest LST values were mistakenly identified by the LST algorithm as cloud, due to the very large gradient in LST values over the highest elevations.

MODIS Land Surface Temperature product
Note that the LST values over much of northeastern Colorado were significantly cooler (darker green color enhancement) than those over southeastern Colorado — the wet soils from the historic rainfall event about a week earlier in and east of the Front Range were not able to warm up as quickly as the dry soils farther to the south.
View only this post Read Less
")


")

")


")


