The volcano Chapparastique in eastern El Salvador near the city of San Miguel experienced a brief eruption on Sunday the 29th of December (YouTube video). Half-hourly 0.63 µm visible channel imagery from GOES-13 or GOES-East (the most frequent imagery available at 13.5º N, the... Read More
")
GOES-13 0.63 µm visible imagery during Chaparrastique eruption (click to play animation)
The volcano Chapparastique in eastern El Salvador near the city of San Miguel experienced a brief eruption on Sunday the 29th of December (YouTube video). Half-hourly 0.63 µm visible channel imagery from GOES-13 or GOES-East (the most frequent imagery available at 13.5º N, the latitude of the volcano), above, plainly shows the appearance of the volcanic ash cloud between 16:15 and 16:45 UTC (media sources reported that the time of the eruption was 16:32 UTC). Most of the ash cloud then moved westward across the coast and over the adjacent waters of the Pacific Ocean, although parts of the ash cloud also moved eastward over Honduras. This is the first complete Chapparastique advisory from the VAAC in Washington DC on this eruption. The most recent volcanic ash advisories can be found here.
GOES-15 or GOES-West, positioned at 135º W, was also able to view the ash cloud, and that animation is below. El Salvador is near the eastern edge of the satellite view. Routine scanning that was taking place on Sunday 29 December only viewed El Salvador every three hours.
")
GOES-15 0.63 µm visible imagery during Chaparrastique eruption (click to play animation)
It happens occasionally that useful information about volcanic eruptions can be gleaned from extreme limb views from geostationary satellites (see here, for example, or this animation from this blog post). In the present case, the MTSAT-2 visible imagery, below, was a bit too far to the west to view the atmosphere over central America.
")
MTSAT-2 0.73 µm visible imagery during Chaparrastique eruption (click to play animation)
Meteosat-10 data possibly saw the eruption; however, the remapped imagery that is broadcast does not include pixels for which a latitude/longitude value can be computed, such as pixels that are at the extreme edge of the limb, in outer space. To ascertain the presence of a signal in the satellite data would require access to the raw data from the satellite, and that is not routinely available. Meteorsat-10 visible images surrounding the eruption time are shown below.
")
METEOSAT-10 0.6 µm visible imagery during Chaparrastique eruption (click to play animation)
Note that when GOES-R ABI is broadcasting data, its limb edge will resemble the METEOSAT-10 data above rather than the more complete MTSAT-2 data. Level 0 data from ABI includes space looks at the limb; that level 0 data will be calibrated, navigated and remapped and distributed as level 1 GOES-R series ReBroadcast (GRB) data that will not include points at the limb that are un-navigable (but that nevertheless can include interesting data).
As part of CIMSS/ASPB participation in GOES-R Proving Ground activities, various volcanic ash detection and analysis products have been developed. Below is an animation of GOES-13 multi-spectral false-color Red/Green/Blue (RGB) images that also show the dispersion of the volcanic ash cloud.
")
GOES-13 multi-spectral RGB images (click to play animation)
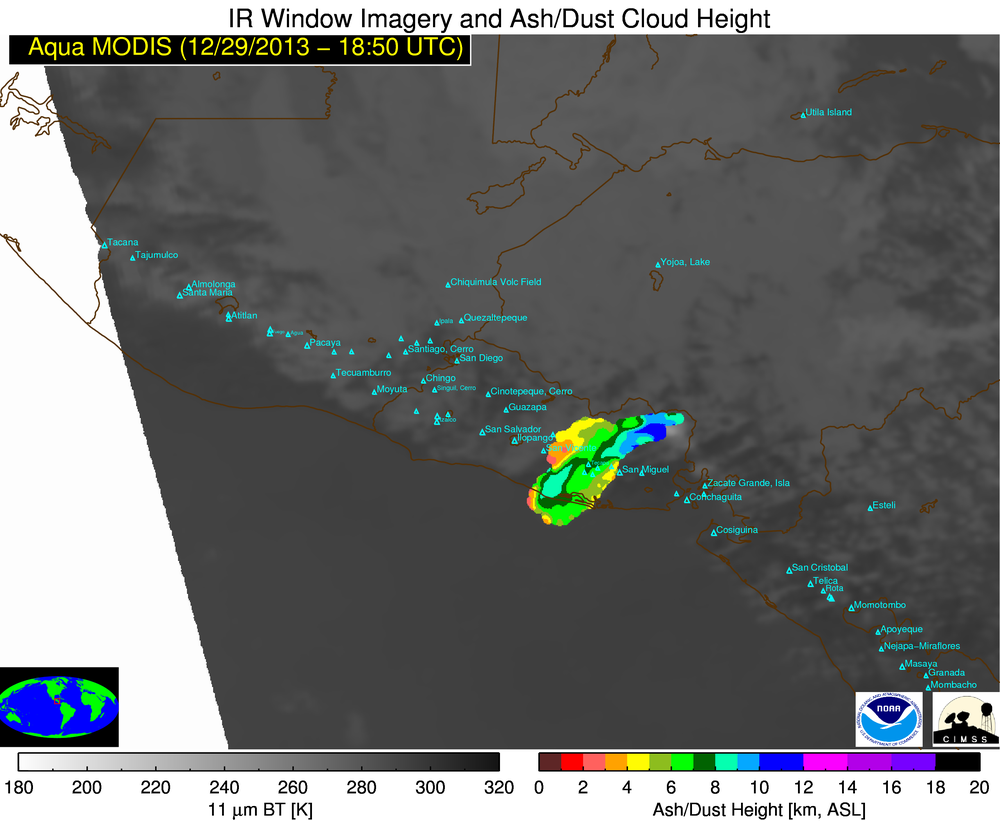
Examples of some of the quantitative volcanic ash products are shown below, using MODIS data from an overpass of the Aqua satellite at 18:50 UTC. The maximum ash height appeared to be around 10 km along the eastern end of the cloud; the maximum ash loading approached 6 g/m2 on the western edge of the plume; the maximum ash particle effective radius was in the 14-16 µm range along the edges of the cloud.

Aqua MODIS Ash/Dust Cloud Height product

Aqua MODIS Ash/Dust Loading product

Aqua MODIS Dust/Ash Particle Effective Radius product
View only this post
Read Less
")

")
")
")
")
")


