")
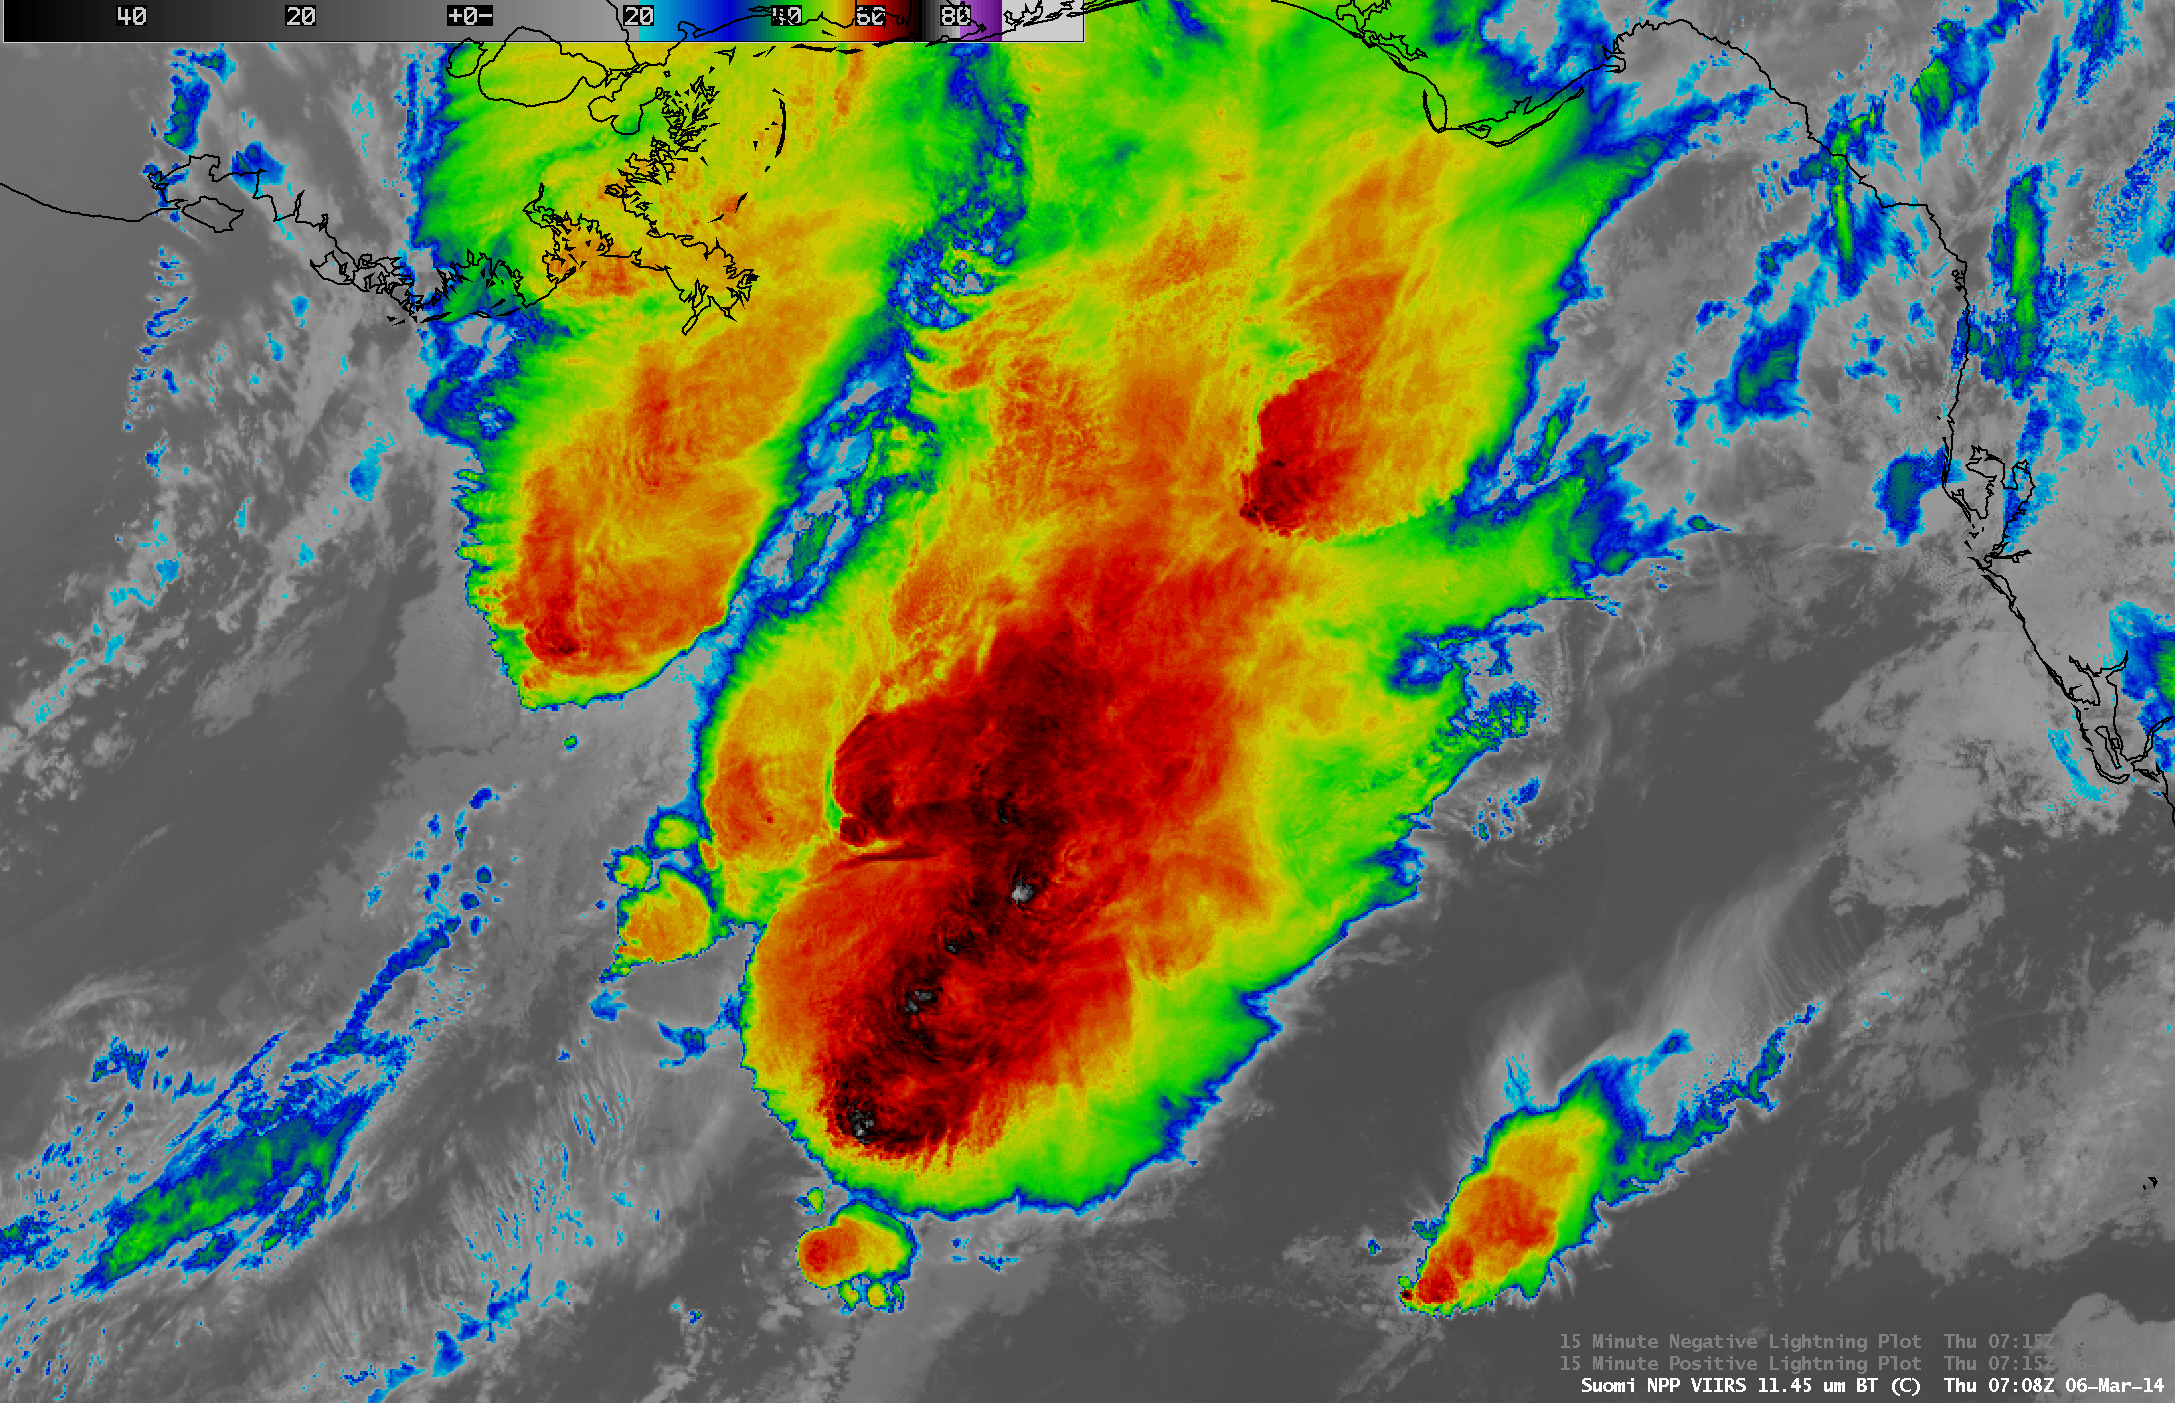
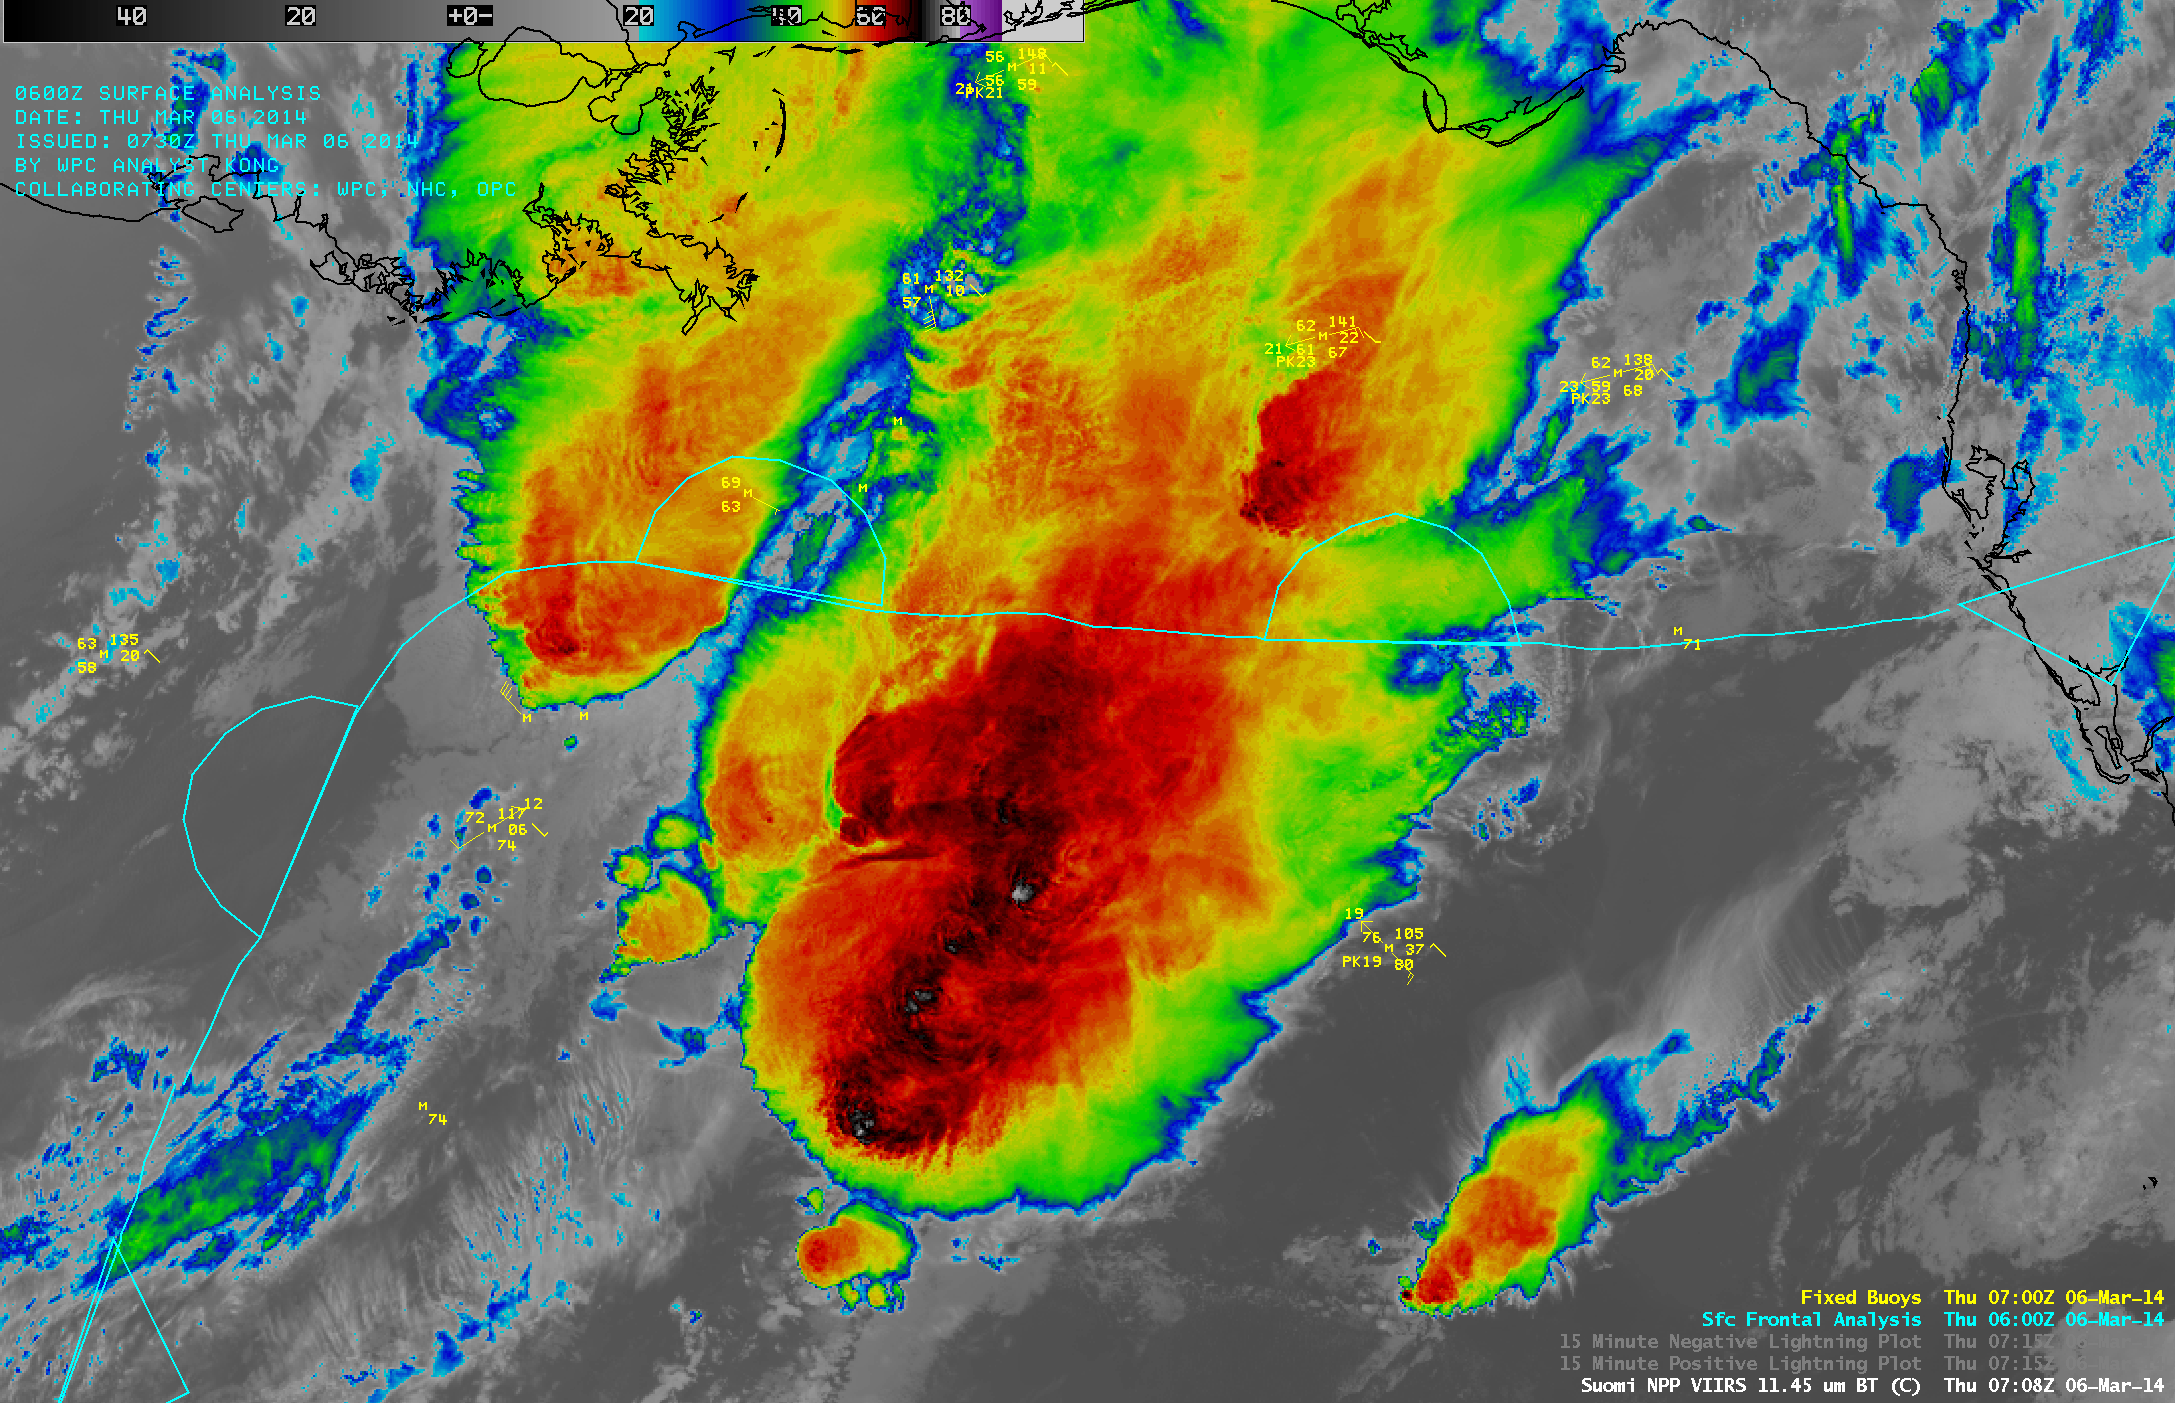
Suomi NPP VIIRS 11.45 µm IR channel and 0.7 µm Day/Night Band images (with CG lightning strikes)
A night-time AWIPS image comparison of Suomi NPP VIIRS 11.45 µm IR and 0.7 µm Day/Night Band data (above) showed a large mesoscale convective system (MCS) over the Gulf of Mexico at 07:08 UTC (2:08 AM local time) on 06 March 2014. On the IR image, brightness temperatures were as cold as -80º C on the far southern end of the storm, which had developed in the warm sector of a developing area of low pressure (surface frontal analysis). The Day/Night Band image revealed: (1) numerous bright west-to-east oriented “lightning streaks” caused by intense lightning activity illuminating the MCS cloud and cloud top — note that there were over 1300 cloud-to-ground (CG) lightning strikes detected in a 15-minute period, and (2) arc-shaped mesospheric airglow waves propagating northward and northeastward away from the region of vigorous overshooting tops at the southern end of the MCS.
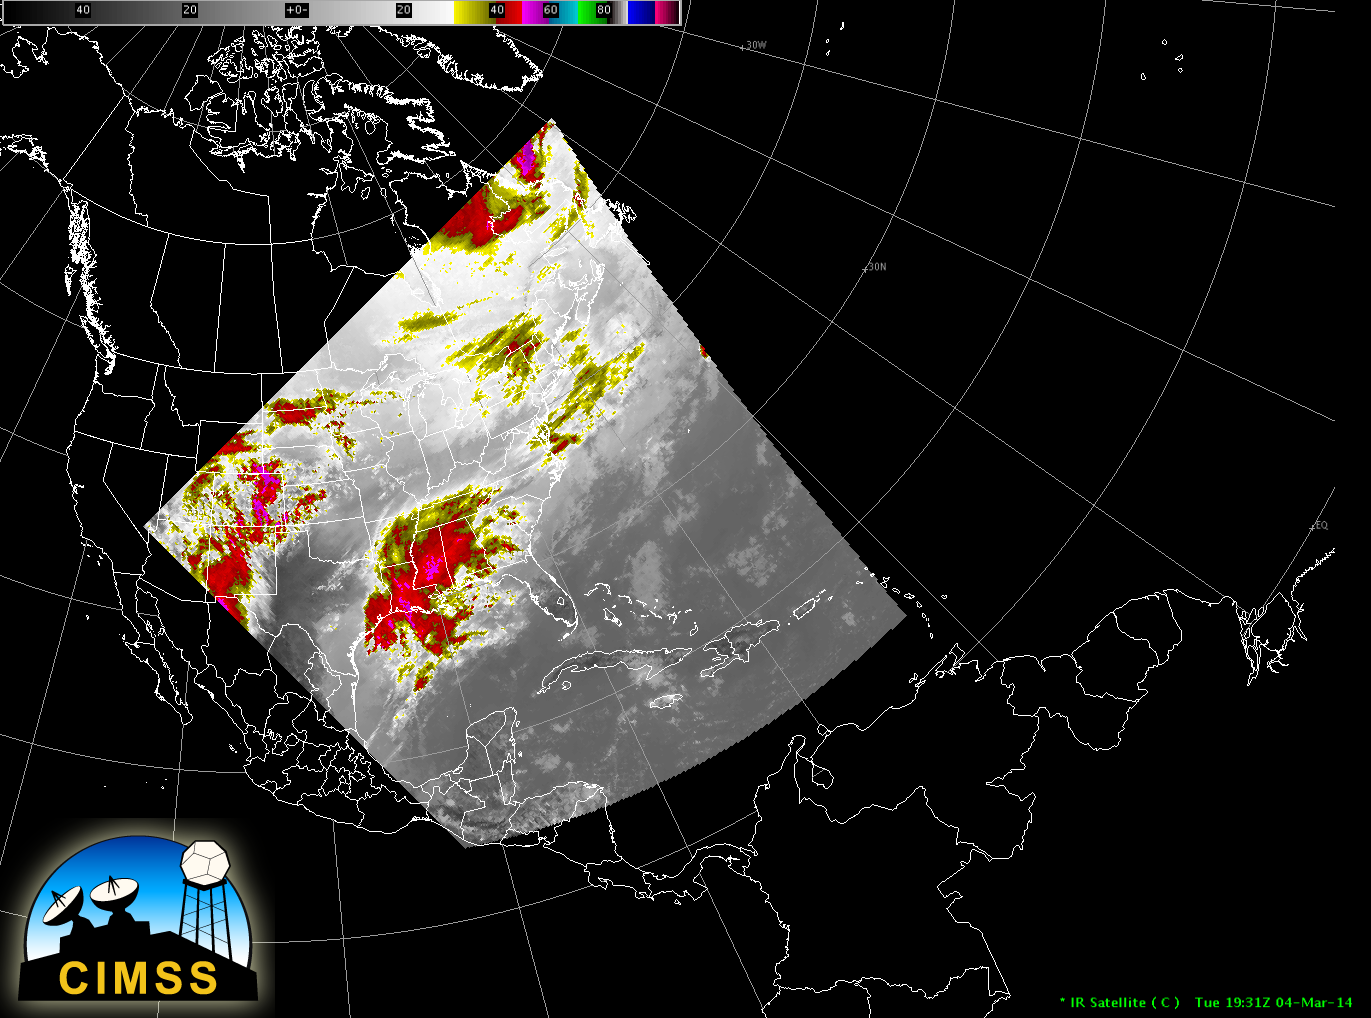
A comparison of the 375-meter resolution Suomi NPP VIIRS 11.45 µm IR image with a 4-km resolution GOES-13 10.7 µm IR image (below) showed that the higher spatial resolution of the VIIRS data provided much clearer view of the various cloud structures along with a better depiction of the values of the cloud-top IR brightness temperatures.

Suomi NPP VIIRS 11.45 µm IR and GOES-13 10.7 µm IR channel images
")
GOES-13 10.7 µm IR channel images (click to play animation)
GOES-13 10.7 µm IR channel images (above; click image to play animation) showed the evolution of the MCS as it continued to move eastward toward Florida. A squall line developed along the leading edge of the MCS, which played a role in producing a few tornadoes and areas of damaging winds over the southern half of the Florida peninsula (below).

Plot of SPC storm reports
View only this post Read Less
")

")

")
")
 and Optimized CONUS from 4 March, 1730 UTC (right) (click to enlarge)")
 and March 4, 2014 (right, optimized schedule). (click to animate)")
")


")


