 and GOES-13 (right) 10.7 µm IR channel images (click to play animation)")
GOES-13 10.7 µm IR channel images (click to play animation)
AWIPS images of 4-km resolution GOES-13 (GOES-East) 10.7 µm IR channel images with overlays of cloud-to-ground lightning strikes and surface frontal positions (above; click image to play animation) showed the explosive development of a thunderstorm just ahead of a cold frontal boundary that was moving southeastward across southern Texas during the overnight hours on 04 April 2014 (06 UTC surface analysis). This relatively small thunderstorm was very active in terms of lightning production, and eventually produced hail of 1.0 to 1.75 inches in diameter and damaging winds (SPC storm reports) as it approached the coast of Texas. Cloud-top IR temperatures were as cold as -73º C on the GOES-13 images.
A 1-km resolution POES AVHRR 12.0 µm IR image at 08:41 UTC or 3:41 AM local time (below) exhibited cloud-top IR brightness temperatures as cold as -79º C. Overlays on the IR image include cloud-to-ground lightning strikes around the time of the IR image, along with the eventual reports of hail that this storm produced about an hour later. South of the thunderstorm, the banded signatre of a pre-frontal lower-tropospheric undular bore could also be seen across deep south Texas.

POES AVHRR 12.0 µm IR channel image, with cloud-to-ground lightning strikes and hail reports
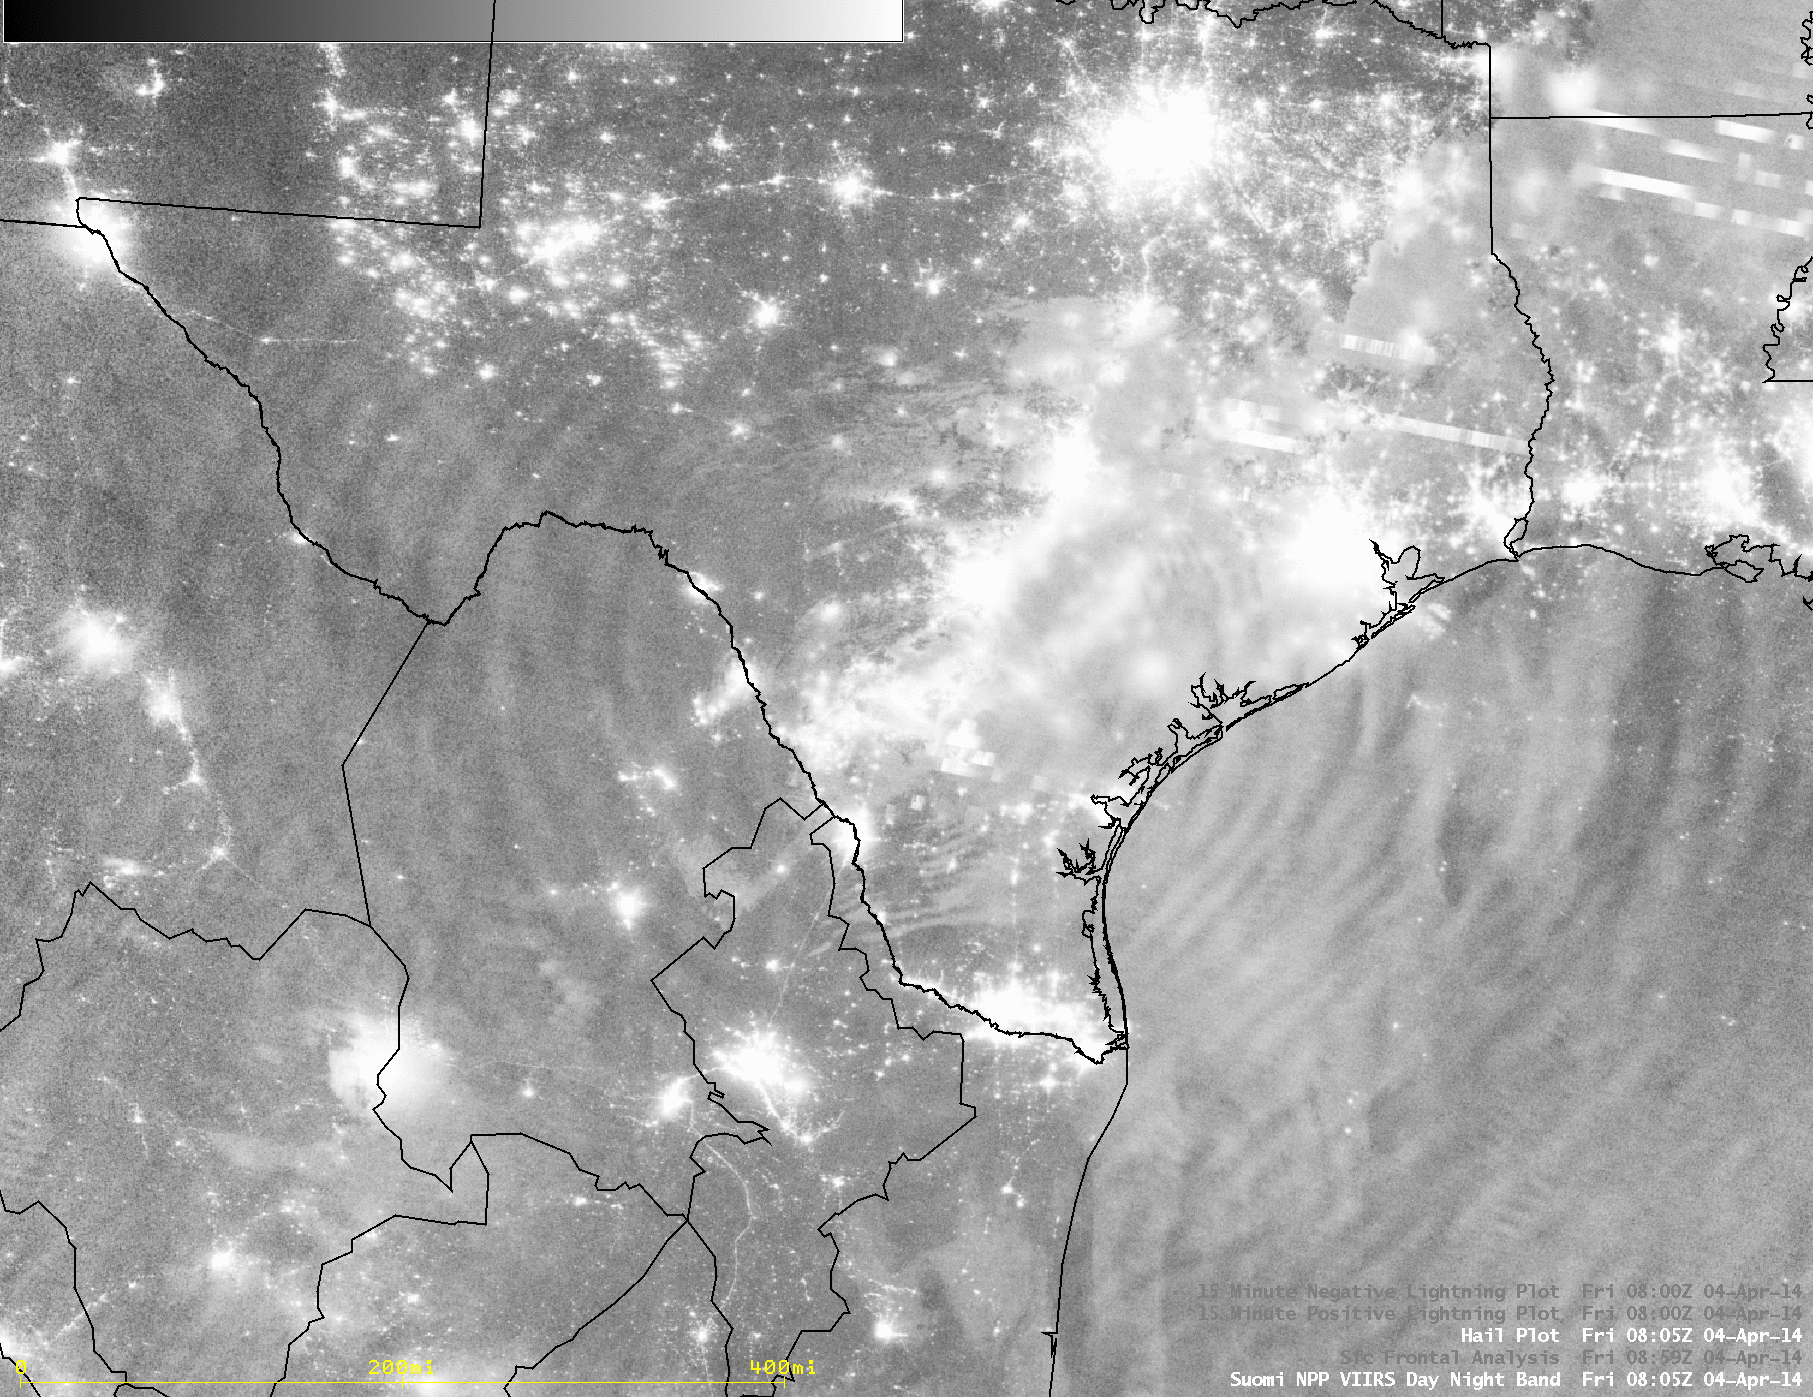
A comparison of 1-km resolution Suomi NPP VIIRS 11.45 µm IR and 0.7 µm Day/Night Band images at 08:05 UTC or 3:05 AM local time (below) showed an “enhanced-V” signature associated with the thunderstorm, with very cold IR brightness temperatures of -86º C at the vertex of the enhanced-V. The Day/Night Band (DNB) image also showed a number of very bright “streaks” near McMullen, Texas (station identifier KNMT), a signature of portions of the cloud which were illuminated by intense lightning activity. The blurred signatures of bright city lights could even be seen through the clouds. Also, note on the DNB image the presence of curved bands off the Texas coast, over the Gulf of Mexico: what could those be?

Suomi NPP VIIRS 11.45 µm IR channel and 0.7 µm Day/Night Band images, with overlays of positive and negative cloud-to-ground lightning strikes
A larger-scale view of the VIIRS IR and Day/Night Band images (below) revealed a remarkably large pattern of concentric mesospheric airglow waves (reference) propagating radially outward away from the region where the thunderstorm had explosively developed and penetrated the tropopause about an hour earlier. Unlike the cloud bands associated with the lower-tropospheric undular bore in deep south Texas, there was no signature of these mesospheric airglow waves on the VIIRS IR image.

Suomi NPP VIIRS 0.7 µm Day/Night Band and 11.45 µm IR channel images
A Skew-T / Log-p plot of the 12 UTC rawinsonde data from Corpus Christi, Texas (below) indicated that the coldest temperature above the tropopause was around -71º C — so the -86º C IR brightness temperature seen on the VIIRS IR image suggests a vigorous thunderstorm overshooting top which penetrated the tropopause and ascended a significant distance into the lower stratosphere. Such a vigorous overshooting top likely triggered the upward-propagating mesospheric airglow waves. The sounding profile also showed how unstable the airmass was ahead of the advancing cold front: the Lifted Index was -11.6º C, and the Convective Available Potential Energy (CAPE, which is labelled on the sounding analysis as “POSITIVE ENERGY ABV LFC”) of 4218 J/kg. Such high convective instability would allow a thunderstorm updraft to reach a high upward vertical velocity.

Plot of 12 UTC Corpus Christi, Texas rawinsonde data
10-km resolution GOES-13 sounder Cloud Top Height derived prodcut images (below) indicated maximum thunderstorm top values of 44,230 feet (brightest white color enhancement), which was around the altitude of the tropopause level on the Corpus Christi rawinsonde data.

GOES-13 sounder Cloud Top Height derived product images
For additional information and images of this mesospheric airglow wave event, see the CIRA/RAMMB VIIRS Imagery and Visualization Team blog.
View only this post Read Less

 and GOES-13 )GOES-East) 6.5 µm water vapor channel images (click to play animation)")
")
")


")

![MTSAT-2 0.675 µm visible channel images [click to play animation]](https://cimss.ssec.wisc.edu/satellite-blog/wp-content/uploads/sites/5/2014/03/140323_mtsat_vis_gillian_anim.gif "MTSAT-2 0.675 µm visible channel images (click to play animation)")
 plot for Cyclone Gillian")

")
")
![GOES-13 Sounder imagery (all 19 bands) [click to enlarge]](https://cimss.ssec.wisc.edu/satellite-blog/wp-content/uploads/sites/5/2014/03/GOES13_BNDALL_SPS10_2_9MAR2014.GIF "GOES-13 Sounder imagery (all 19 bands) [click to enlarge]")
![GOES-13 Sounder imagery (all 19 bands) produced with new processing software [click to enlarge]](https://cimss.ssec.wisc.edu/satellite-blog/wp-content/uploads/sites/5/2014/03/GOES13_BNDALL_SPS10_4_1_9MAR2014.GIF "GOES-13 Sounder imagery (all 19 bands) produced with new processing software [click to enlarge]")
