This website works best with a newer web browser such as Chrome, Firefox, Safari or Microsoft Edge. Internet Explorer is not supported by this website.

Thunderstorms in Kansas

AWIPS images of 4-km resolution GOES-13 10.7 µm IR channel data (above; click image to play animation) showed clusters of strong to severe thunderstorms that moved across Kansas during the overnight (pre-sunrise) hours on 30 March 2013. Brief “enhanced-V” storm top signatures could be seen with a few of the stronger thunderstorms.... Read More

GOES-13 10.7 µm IR channel images (click image to play animation)

GOES-13 10.7 µm IR channel images (click image to play animation)

AWIPS images of 4-km resolution GOES-13 10.7 µm IR channel data (above; click image to play animation) showed clusters of strong to severe thunderstorms that moved across Kansas during the overnight (pre-sunrise) hours on 30 March 2013. Brief “enhanced-V” storm top signatures could be seen with a few of the stronger thunderstorms. There were numerous reports of hail, as large as 2.5 inches in diameter (SPC storm reports).

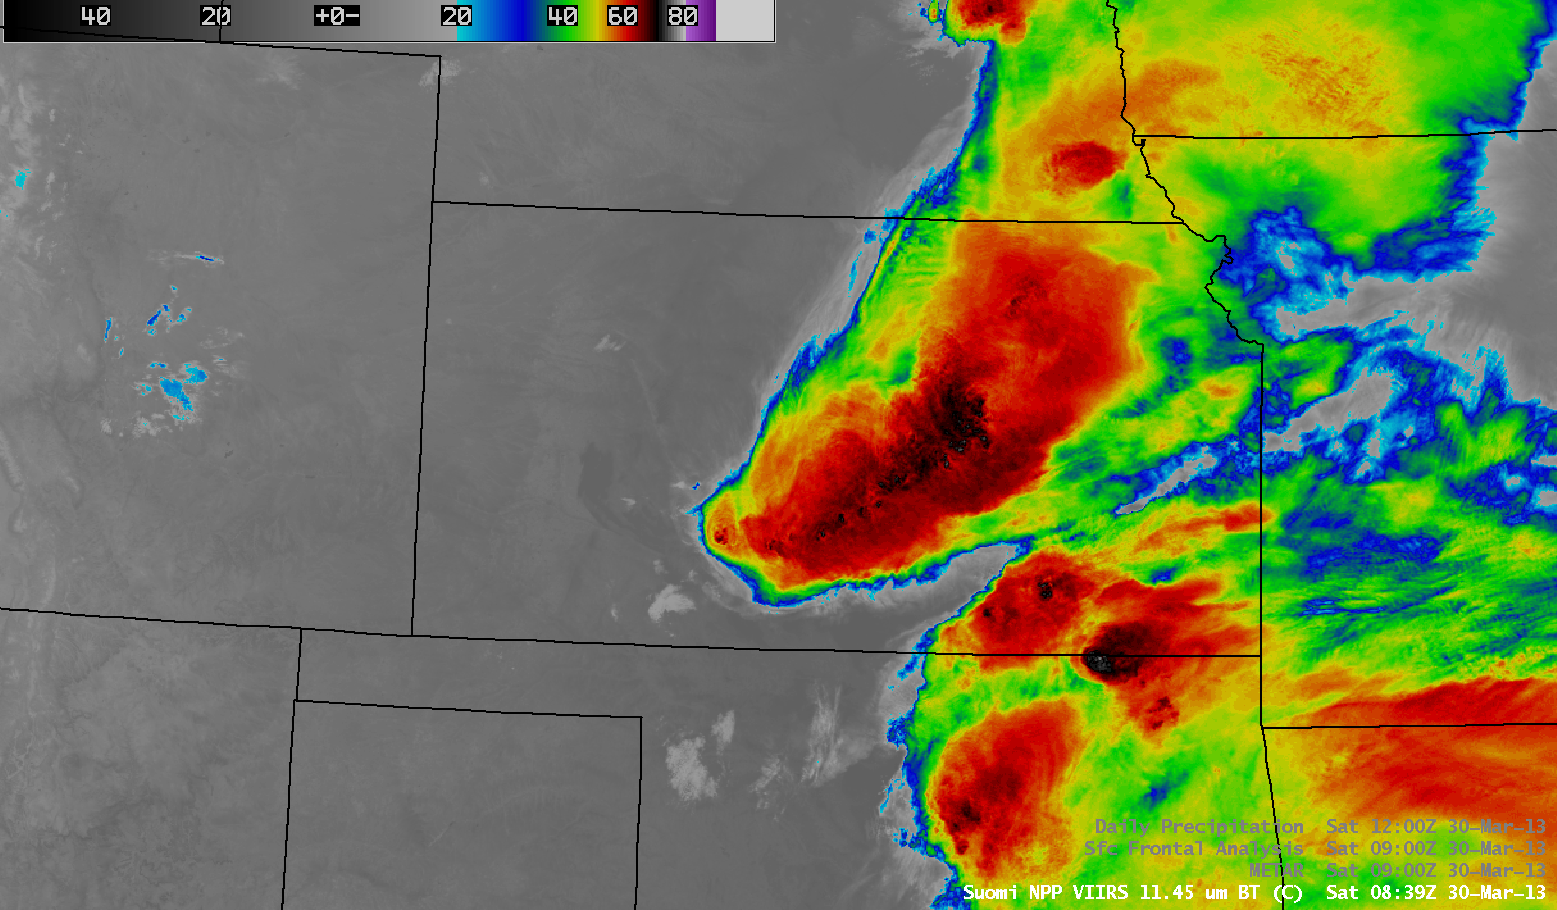
A more detailed view of the storms at 08:39 UTC or 3:39 AM local time can be seen on a comparison of 1-km resolution Suomi NPP VIIRS 11.45 µm IR channel and 0.7 µm Day/Night Band images (below). With ample illumination from a nearly-full moon (Waning Gibbous phase, 86% of full), the Day/Night Band provided a “visible image at night” which showed shadows from numerous overshooting tops. The coldest cloud-top IR brightness temperatures with these storms were -77º C along the Kansas/Oklahoma border and -75º C in central Kansas. Other features of interest on the Day/Night Band image included: (1) an arc of cloud bands associated with a low-level thunderstorm outflow boundary near Dodge City, Kansas (station identifier KDDC), and (2) the darker signature of swaths of wet soil from the thunderstom rainfall (which included 0.83 inches at Catharine and 0.60 inches near Hays) — since much of the Great Plains region was experiencing extreme to exceptional drought, these darker wet soil areas stood out against the adjacent very dry soil.

Suomi NPP VIIRS 11.45 µm IR channel and 0.7 µm Day/Night Band images

Suomi NPP VIIRS 11.45 µm IR channel and 0.7 µm Day/Night Band images

View only this post Read Less

Mesovortex formation in northwestern Wisconsin

AWIPS images of GOES-13 0.63 µm visible channel data (above; click image to play animation) revealed the formation of a mesoscale vortex over far northwestern Wisconsin during the day on 26 March 2013. Overlays of MADIS 1-hour interval atmospheric motion vectors (below) showed... Read More

GOES-13 0.63 µm visible channel images (click image to play animation)

GOES-13 0.63 µm visible channel images (click image to play animation)

AWIPS images of GOES-13 0.63 µm visible channel data (above; click image to play animation) revealed the formation of a mesoscale vortex over far northwestern Wisconsin during the day on 26 March 2013. Overlays of MADIS 1-hour interval atmospheric motion vectors (below) showed that the satellite-derived winds were indicating some degree of cyclonic flow into the western portion of the mesovortex.

GOES-13 0.63 µm visible channel images with MADIS 1-hour interval atmospheric motion vectors

GOES-13 0.63 µm visible channel images with MADIS 1-hour interval atmospheric motion vectors

A comparison of Suomi NPP VIIRS 0.64 µm visible channel and 11.45 µm IR channel images (below) showed that the cloud elements comprising the mesoscale vortex appeared convective in nature, with many exhibiting IR cloud top brightness temperatures of -20º C or colder (light blue color enhancement). The morning rawinsonde data from Minneapolis, Minnesota indicated that a very unstable layer was present just above the surface between 950 and 750 hPa — so with a convective temperature of only 36º F the convective elements were quick to develop once surface temperatures began to warm after sunrise.

Suomi NPP VIIRS 0.64 µm visible channel and 11.45 µm IR channel images

Suomi NPP VIIRS 0.64 µm visible channel and 11.45 µm IR channel images

===== 27 April Update =====

During the following overnight hours, the cyclonic swirl signature of the mesoscale vortex could still be seen over northwestern Wisconsin at 07:53 UTC or 2:53 AM local time on the Suomi NPP VIIRS IR brightness temperature difference “fog/stratus product” (below). Due to ample illumination by a full Moon,  a “night-time visible image” provided by the corresponding 0.7 µm Day/Night Band (DNB) showed that city lights could still be seen through the low cloud deck; other features of interest on the DNB image included ice in Green Bay and a few areas along the south shore of Lake Superior, and the southern extent of the snow cover from far eastern South Dakota into southern Minnesota.

Suomi NPP VIIRS IR brightness temperature difference

Suomi NPP VIIRS IR brightness temperature difference “fog/stratus product” + 0.7 µm Day/Night Band image

View only this post Read Less

Formation of a warm seclusion off the US East Coast

McIDAS images of GOES-13 0.63 µm visible channel data (above; click image to play animation) revealed the formation of an eye-like signature that suggests the formation of a warm seclusion off the US East Coast on 25 March 2013.AWIPS images of Suomi NPP... Read More

GOES-13 0.63 µm visible channel image (click image to play animation)

GOES-13 0.63 µm visible channel image (click image to play animation)

McIDAS images of GOES-13 0.63 µm visible channel data (above; click image to play animation) revealed the formation of an eye-like signature that suggests the formation of a warm seclusion off the US East Coast on 25 March 2013.

AWIPS images of Suomi NPP VIIRS 0.64 µm visible channel and 11.45 µm IR channel data at 18:16 UTC (below) showed the early stages of the development of the cloud-free core of the warm seclusion. Strong convective squalls were developing along the occluded frontal zone in the eastern portion of the satellite scene.

Suomi NPP VIIRS 0.64 µm visible channel and 11.45 µm IR channel images (with surface analysis and ocean buoy observations)

Suomi NPP VIIRS 0.64 µm visible channel and 11.45 µm IR channel images (with surface analysis and ocean buoy observations)

View only this post Read Less

Severe thunderstorms produce hail and damaging winds across Florida

AWIPS images of GOES-13 10.7 µm IR channel data (above; click image to play animation) showed a band of strong to severe thunderstorms that moved eastward across central Florida during the afternoon hours on 24 March 2013. These storms produced a few reports of hail up to 1.0 inch in diameter, as... Read More

GOES-13 10.7 µm IR channel images (click image to play animation)

GOES-13 10.7 µm IR channel images (click image to play animation)

AWIPS images of GOES-13 10.7 µm IR channel data (above; click image to play animation) showed a band of strong to severe thunderstorms that moved eastward across central Florida during the afternoon hours on 24 March 2013. These storms produced a few reports of hail up to 1.0 inch in diameter, as well as a number of damaging wind reports which included a gust to 75 knots or 86 mph at Orlando International Airport at 18:40 UTC or 2:40 PM local time (SPC storm reports).

1-km resolution Suomi NPP VIIRS 0.64 µm visible channel and 11.45 µm IR images with overlays of surface METAR reports and SPC storm reports (below) revealed that there was a cluster of overshooting tops with cloud-top IR brightness temperature values as cold as -67º C (darker red color enhancment) that appearaed to be associated with the reports of high wind gusts at the surface.

Suomi NPP VIIRS 0.64 µm visible channel and 11.45 µm IR channel images (with overlays of surface reports and severe weather reports)

Suomi NPP VIIRS 0.64 µm visible channel and 11.45 µm IR channel images (with overlays of surface reports and severe weather reports)

A comparison of a 1-km resolution Suomi NPP VIIRS 11.45 µm IR image with the corresponding 4-km resolution GOES-13 10.7 µm IR image (below) demonstrated the advantage of higher spatial resolution for aiding in the identification of the location and magnitude of the coldest cloud-top IR brightness temperatures (-67º C with VIIRS, vs -60º C with GOES). In addition, the effect of parallax was evident on the GOES-13 IR image, with features being displaced to the northwest.

Suomi NPP VIIRS 11.45 µm IR and GOES-13 10.7 µm IR images

Suomi NPP VIIRS 11.45 µm IR and GOES-13 10.7 µm IR images

GOES-13 sounder Lifted Index (LI) and Total Precipitable Water (TPW) derived product images (below) indicated that moisture (TPW values as high as 45 mm or 1.78 inches) and instability (LI values as low as -10.4º C) were in place in the pre-convective environment across central Florida at 16:00 UTC or 12:00 PM local time.

GOES-13 sounder Lifted Index and Total Precipitable Water derived product images

GOES-13 sounder Lifted Index and Total Precipitable Water derived product images

View only this post Read Less