![GOES-13 Visible (0.63µm) imagery [click to play animation]](https://cimss.ssec.wisc.edu/satellite-blog/wp-content/uploads/sites/5/2015/08/960x1280_EASTL_B1_G13_VIS_animated_2015214_104500_180_2015215_014500_180_GRAY.gif)
GOES-13 Visible (0.63µm) imagery [click to play animation]
![GOES-13 Sounder DPI Lifted Index, times as indicated [click to play animation]](https://cimss.ssec.wisc.edu/satellite-blog/wp-content/uploads/sites/5/2015/08/GOESSounderDPI_LI_2-3August-24anim.gif)
GOES-13 Sounder DPI Lifted Index, times as indicated [click to play animation]
Strong thunderstorms developed over the upper midwest ahead of a cold front in the afternoon of 2 August 2015. Large Hail (up to 4.25″ diameter in Ogemaw County Michigan) fell and strong winds were observed (up to 70 mph in Portage County Wisconsin) over parts of eastern Wisconsin and lower Michigan. (SPC Storm Report). The visible animation from GOES-13, top (available here as an mp4), shows the development of the storms.
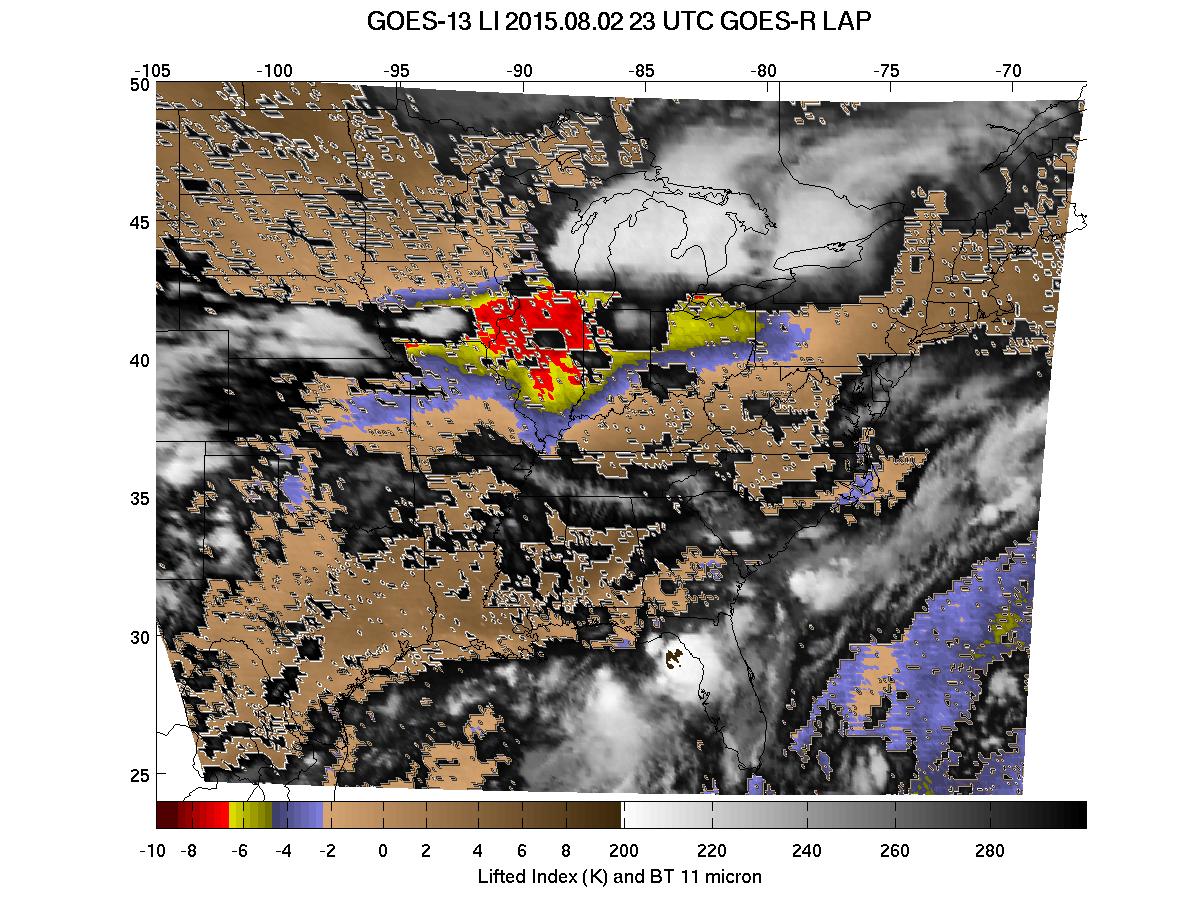
The destabilization of the atmosphere was captured well with the GOES Sounder depiction of Lifted Index, shown above. Values exceeding -10º C were common in the moist air feeding into the developing thunderstorms. The GOES-R Legacy Atmospheric Profile (LAP) Algorithm for 2 August similarly shows the strong instability around Lake Michigan. Lifted Indices also exceeded -10º C.
![GOES-R LAP Lifted Index, times as indicated [click to play animation]](https://cimss.ssec.wisc.edu/satellite-blog/wp-content/uploads/sites/5/2015/08/LIGOESRP1_20150802_17_23Zanim.gif)
GOES-R LAP Lifted Index, times as indicated, times as indicated [click to play animation]
![GOES-13 Sounder DPI Convective Available Potential Energy (CAPE), times as indicated [click to play animation]](https://cimss.ssec.wisc.edu/satellite-blog/wp-content/uploads/sites/5/2015/08/https://cimss.ssec.wisc.edu/satellite-blog/wp-content/uploads/sites/5/2015/08/GOES_CAPE_20150802_03anim.gif)
GOES-13 Sounder DPI Convective Available Potential Energy (CAPE), times as indicated [click to play animation]
The GOES-R LAP Algorithm (and the GOES-Sounder) can also compute Convective Available Potential Energy. Values for the GOES Sounder are shown above (they are routinely available here); those for the GOES-R LAP Algorithm are below. The GOES-13 Sounder showed values approaching 5000 J/kg. Values from the GOES-R LAP Algorithm show values around 3000 J/kg. Note how the spatial extent of the instability in both CAPE and LI fields matches well in the Sounder and LAP fields.
![GOES-R LAP Convective Available Potential Energy (CAPE), times as indicated [click to play animation]](https://cimss.ssec.wisc.edu/satellite-blog/wp-content/uploads/sites/5/2015/08/CAPEGOESRP1_20150802_12_23anim.gif)
GOES-R LAP Convective Available Potential Energy (CAPE), times as indicated [click to play animation]
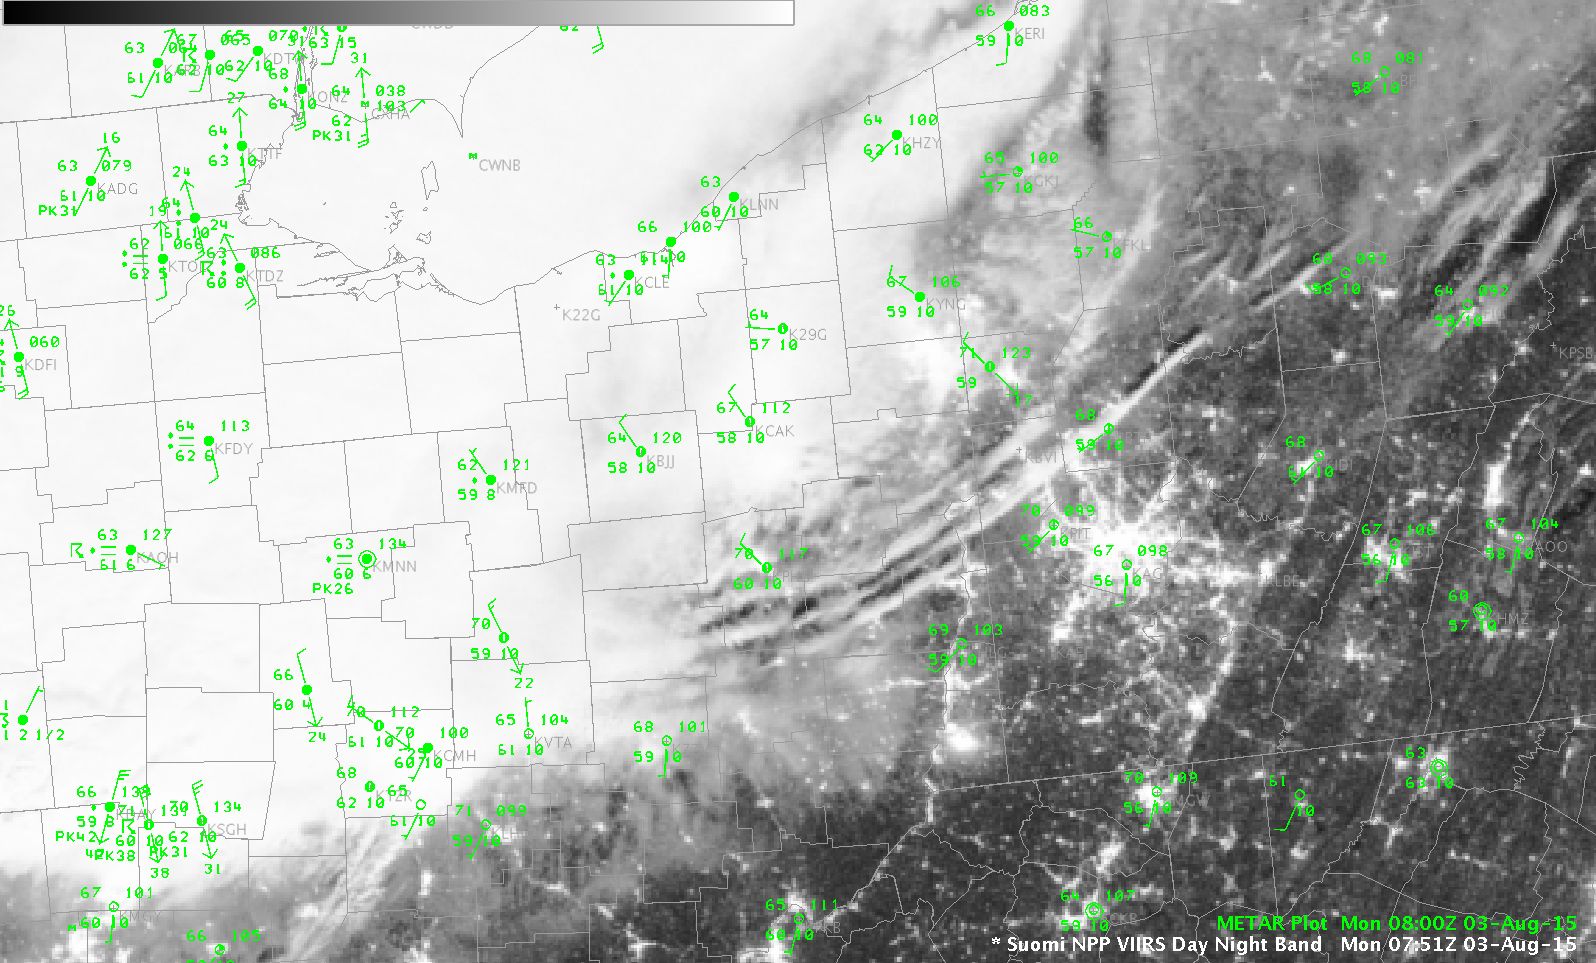
The storms occurred on a day shortly after the Full Moon, so they were well-illuminated for the Suomi NPP Day Night Band imagery, shown below for 0751 UTC. The parallel lines of clouds over eastern Ohio and western Pennsylvania marks a wind-shift line as shown in this plot that includes surface observations. Those parallel lines of clouds were persistent, as they were present in the 0603 UTC Day Night Band imagery as well (Click here for a toggle between 0613 and 0751 UTC.)
![Suomi NPP VIIRS Day Night Band Visible (0.70 µm) Imagery [click to enlarge]](https://cimss.ssec.wisc.edu/satellite-blog/wp-content/uploads/sites/5/2015/08/VIIRS_DNB__REF_20150803_0751.png)
Suomi NPP VIIRS Day Night Band Visible (0.70 µm) Imagery [click to enlarge]
The 11.45 µm Imagery from Suomi NPP shows evidence of overshooting tops persisting at night.
![Suomi NPP VIIRS Infrared (11.45 µm) Imagery [click to enlarge]](https://cimss.ssec.wisc.edu/satellite-blog/wp-content/uploads/sites/5/2015/08/VIIRS_11.45_BT_20150803_0751.png)
Suomi NPP VIIRS Infrared (11.45 µm) Imagery [click to enlarge]
View only this post Read Less
![Color-enhanced Infrared (10.7 µm) imagery from GOES-15 (left) and GOES-13 (right), times as indicated [click to play animation]](https://cimss.ssec.wisc.edu/satellite-blog/wp-content/uploads/sites/5/2015/07/GOES13GOES15_28July_ManitobaTornadoanim.gif)
![GOES-15 (left) and GOES-13 (right) 10.7 µm Infrared images, with surface reports [click to play animation]](https://cimss.ssec.wisc.edu/satellite-blog/wp-content/uploads/sites/5/2015/07/150727-28_goes15_goes13_ir_MB_tornado_anim.gif)
![Terra MODIS 11.0 µm Infrared image [click to enlarge]](https://cimss.ssec.wisc.edu/satellite-blog/wp-content/uploads/sites/5/2015/07/MODIS_IR_20150728_0331.png)
![GOES-13 Visible (0.63 µm) imagery, times as indicated [click to play animation]](https://cimss.ssec.wisc.edu/satellite-blog/wp-content/uploads/sites/5/2015/07/GOES13_VIS_28July2015animMANITOBATORNADO.gif)
![GOES-15 Visible (0.62 µm) imagery, times as indicated [click to play animation]](https://cimss.ssec.wisc.edu/satellite-blog/wp-content/uploads/sites/5/2015/07/GOES15_VIS_28July2015animMANITOBATORNADO.gif)
![GOES-15 (left) and GOES-13 (right) 0.63 µm visible channel images, with surface reports [click to play animation]](https://cimss.ssec.wisc.edu/satellite-blog/wp-content/uploads/sites/5/2015/07/150727-28_goes15_goes13_visible_MB_tornado_anim.gif)
![GOES sounder CAPE derived product images [click to play animation]](https://cimss.ssec.wisc.edu/satellite-blog/wp-content/uploads/sites/5/2015/07/150727-28_goes_sounder_cape_MB_tornado_anim.gif)
![GOES sounder Lifted Index derived product images [click to play animation]](https://cimss.ssec.wisc.edu/satellite-blog/wp-content/uploads/sites/5/2015/07/150727-28_goes_sounder_li_anim.gif)
![GOES sounder Total Precipitable Water derived product images [click to play animation]](https://cimss.ssec.wisc.edu/satellite-blog/wp-content/uploads/sites/5/2015/07/150727-28_goes_sounder_tpw_MB_tornado_anim.gif)
![GOES-15 visible (top) and shortwave IR (bottom) images [click to play animation]](https://cimss.ssec.wisc.edu/satellite-blog/wp-content/uploads/sites/5/2015/07/150722-25_goes15_swir_visible_AK_fires_anim.gif)
![Suomi NPP VIIRS shortwave IR images [click to play animation]](https://cimss.ssec.wisc.edu/satellite-blog/wp-content/uploads/sites/5/2015/07/150722-25_suomi_npp_viirs_shortwaveIR_AK_fires_anim.gif)
![Time series of surface observation from Utopia Creek, Indian Mountain airport [click to enlarge]](https://cimss.ssec.wisc.edu/satellite-blog/wp-content/uploads/sites/5/2015/07/150723-25_PAIM_SFCMG.GIF)
![Suomi NPP VIIRS true-color images [click to enlarge]](https://cimss.ssec.wisc.edu/satellite-blog/wp-content/uploads/sites/5/2015/07/150722-25_suomi_npp_viirs_truecolor_AK_smoke_anim.gif)
![Meteosat-10 6.25 µm water vapor channel images [click to play animation]](https://cimss.ssec.wisc.edu/satellite-blog/wp-content/uploads/sites/5/2015/07/150725_meteosat10_water_vapor_Storm_Zeljko_anim.gif)
![Meteosat-10 0.8 µm visible channel images [click to play animation]](https://cimss.ssec.wisc.edu/satellite-blog/wp-content/uploads/sites/5/2015/07/150725_meteosat10_visible_Storm_Zeljko_anim.gif)
