
The Japanese Meteorological Agency is using Himawari-8 as its operational satellite, effective 0200 UTC on 7 July 2015. The animation above shows two days of water vapor imagery from Himawari-8 (6.2 µm, top, 6.9 µm, middle and 7.3 µm, bottom) over the tropical Pacific, revealing the train of three tropical cyclones moving... Read More
Himawari-8 6.2 µm (top), 6.9 µm (middle) and 7.3 µm (bottom) water vapor infrared imagery, 0000 UTC 5 July 2015 – 1200 UTC 7 July 2015 (click to animate)
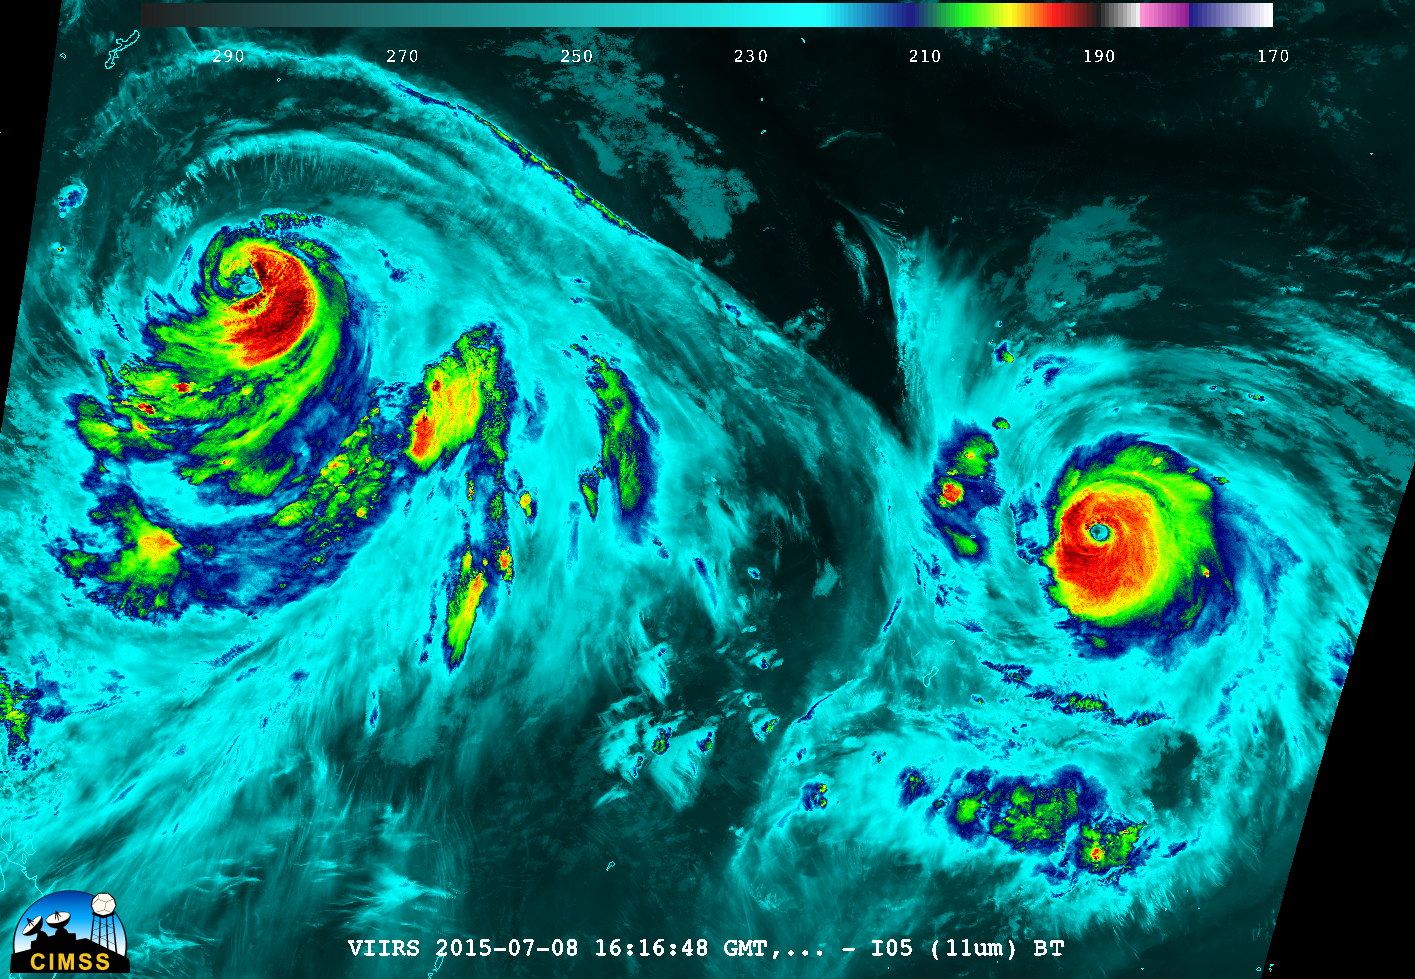
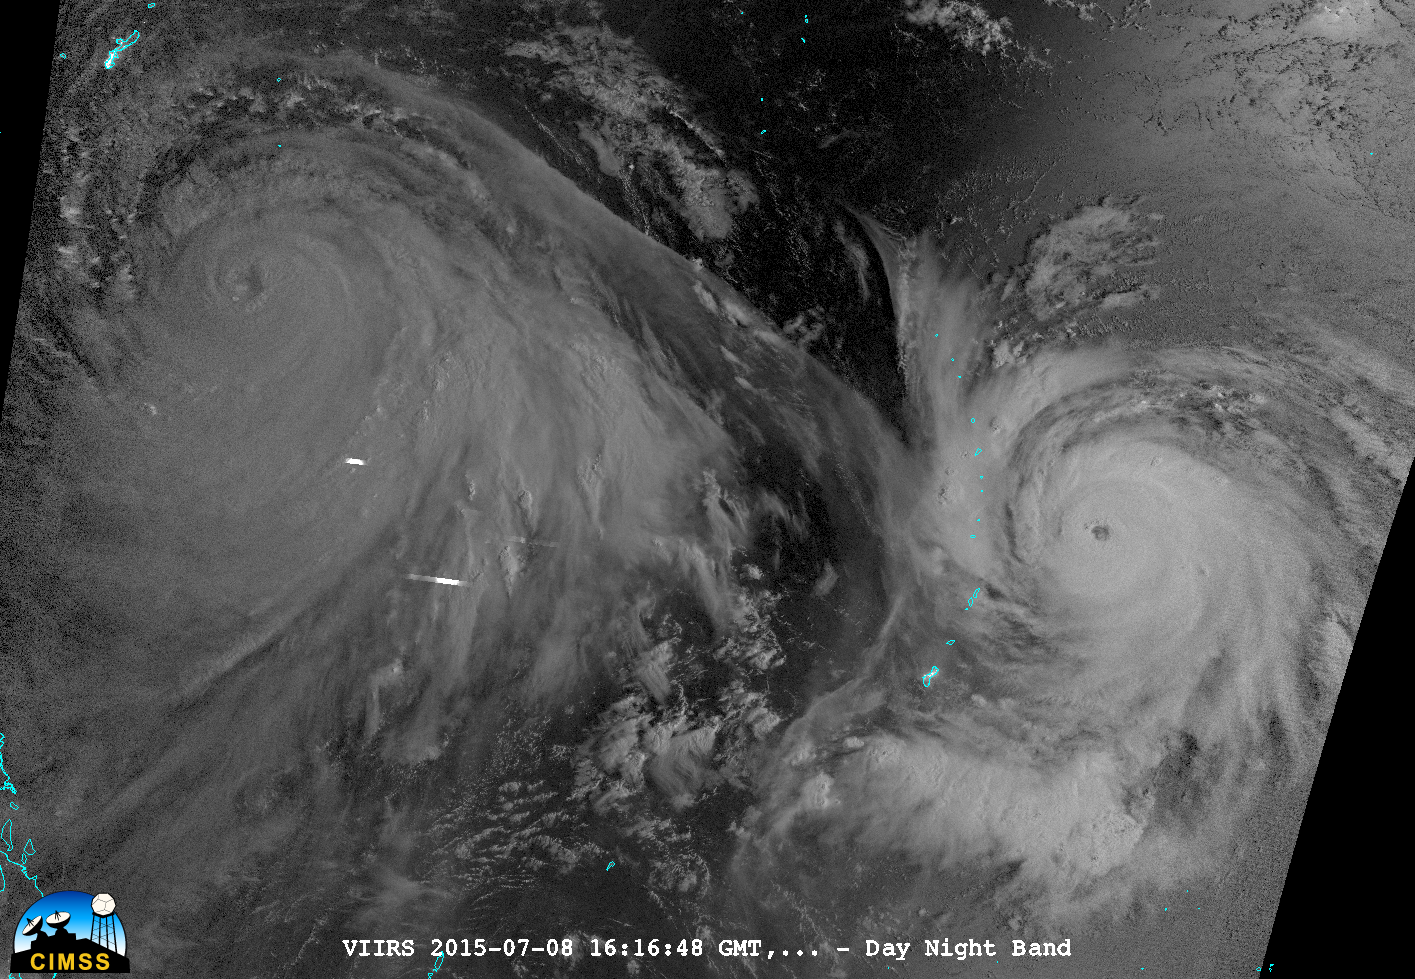
The Japanese Meteorological Agency is using Himawari-8 as its operational satellite, effective 0200 UTC on 7 July 2015. The animation above shows two days of water vapor imagery from Himawari-8 (6.2 µm, top, 6.9 µm, middle and 7.3 µm, bottom) over the tropical Pacific, revealing the train of three tropical cyclones moving westward towards Asia (testimony to why satellite data are important!). Typhoon Nangka, on the right, has developed an eye. Himawari-8 samples a full-disk image every 10 minutes, with nominal 2-km resolution in the infrared channels. Moveable sectors are also available at 2.5-minute intervals, such as shown in this animation from here.
Himawari-8 has 0.5-km resolution in the 0.64 µm visible channel. A 3-hour animation over Typhoon Nangka, at routine 10-minute time-steps, is shown below.
Himawari-8 0.64 µm visible imagery, 0400 UTC 5 July 2015 – 0700 UTC 7 July 2015, showing Typhoon Nangka (click to animate)
The sixteen channels on the AHI instrument onboard Himawari-8 are similar to those that will be found on the ABI instrument onboard GOES-R, which is scheduled for launch in March of 2016. The animation below shows all 16 channels of the Himawari-8 AHI.
Himawari-8 data, all AHI channels, over Typhoon Nangka, 0400 UTC 5 July 2015 – 0810 UTC 7 July 2015 (click to animate)
A very large (74 MegaByte) Himawari-8 true-color Red/Green/Blue (RGB) full-disk image at 0340 UTC is shown below (courtesy of Jerrold Robaidek, SSEC).

Himawari-8 true-color image
A few interesting features to point out on the full-disk image are shown below (courtesy of Scott Bachmeier, CIMSS) — from north to south:
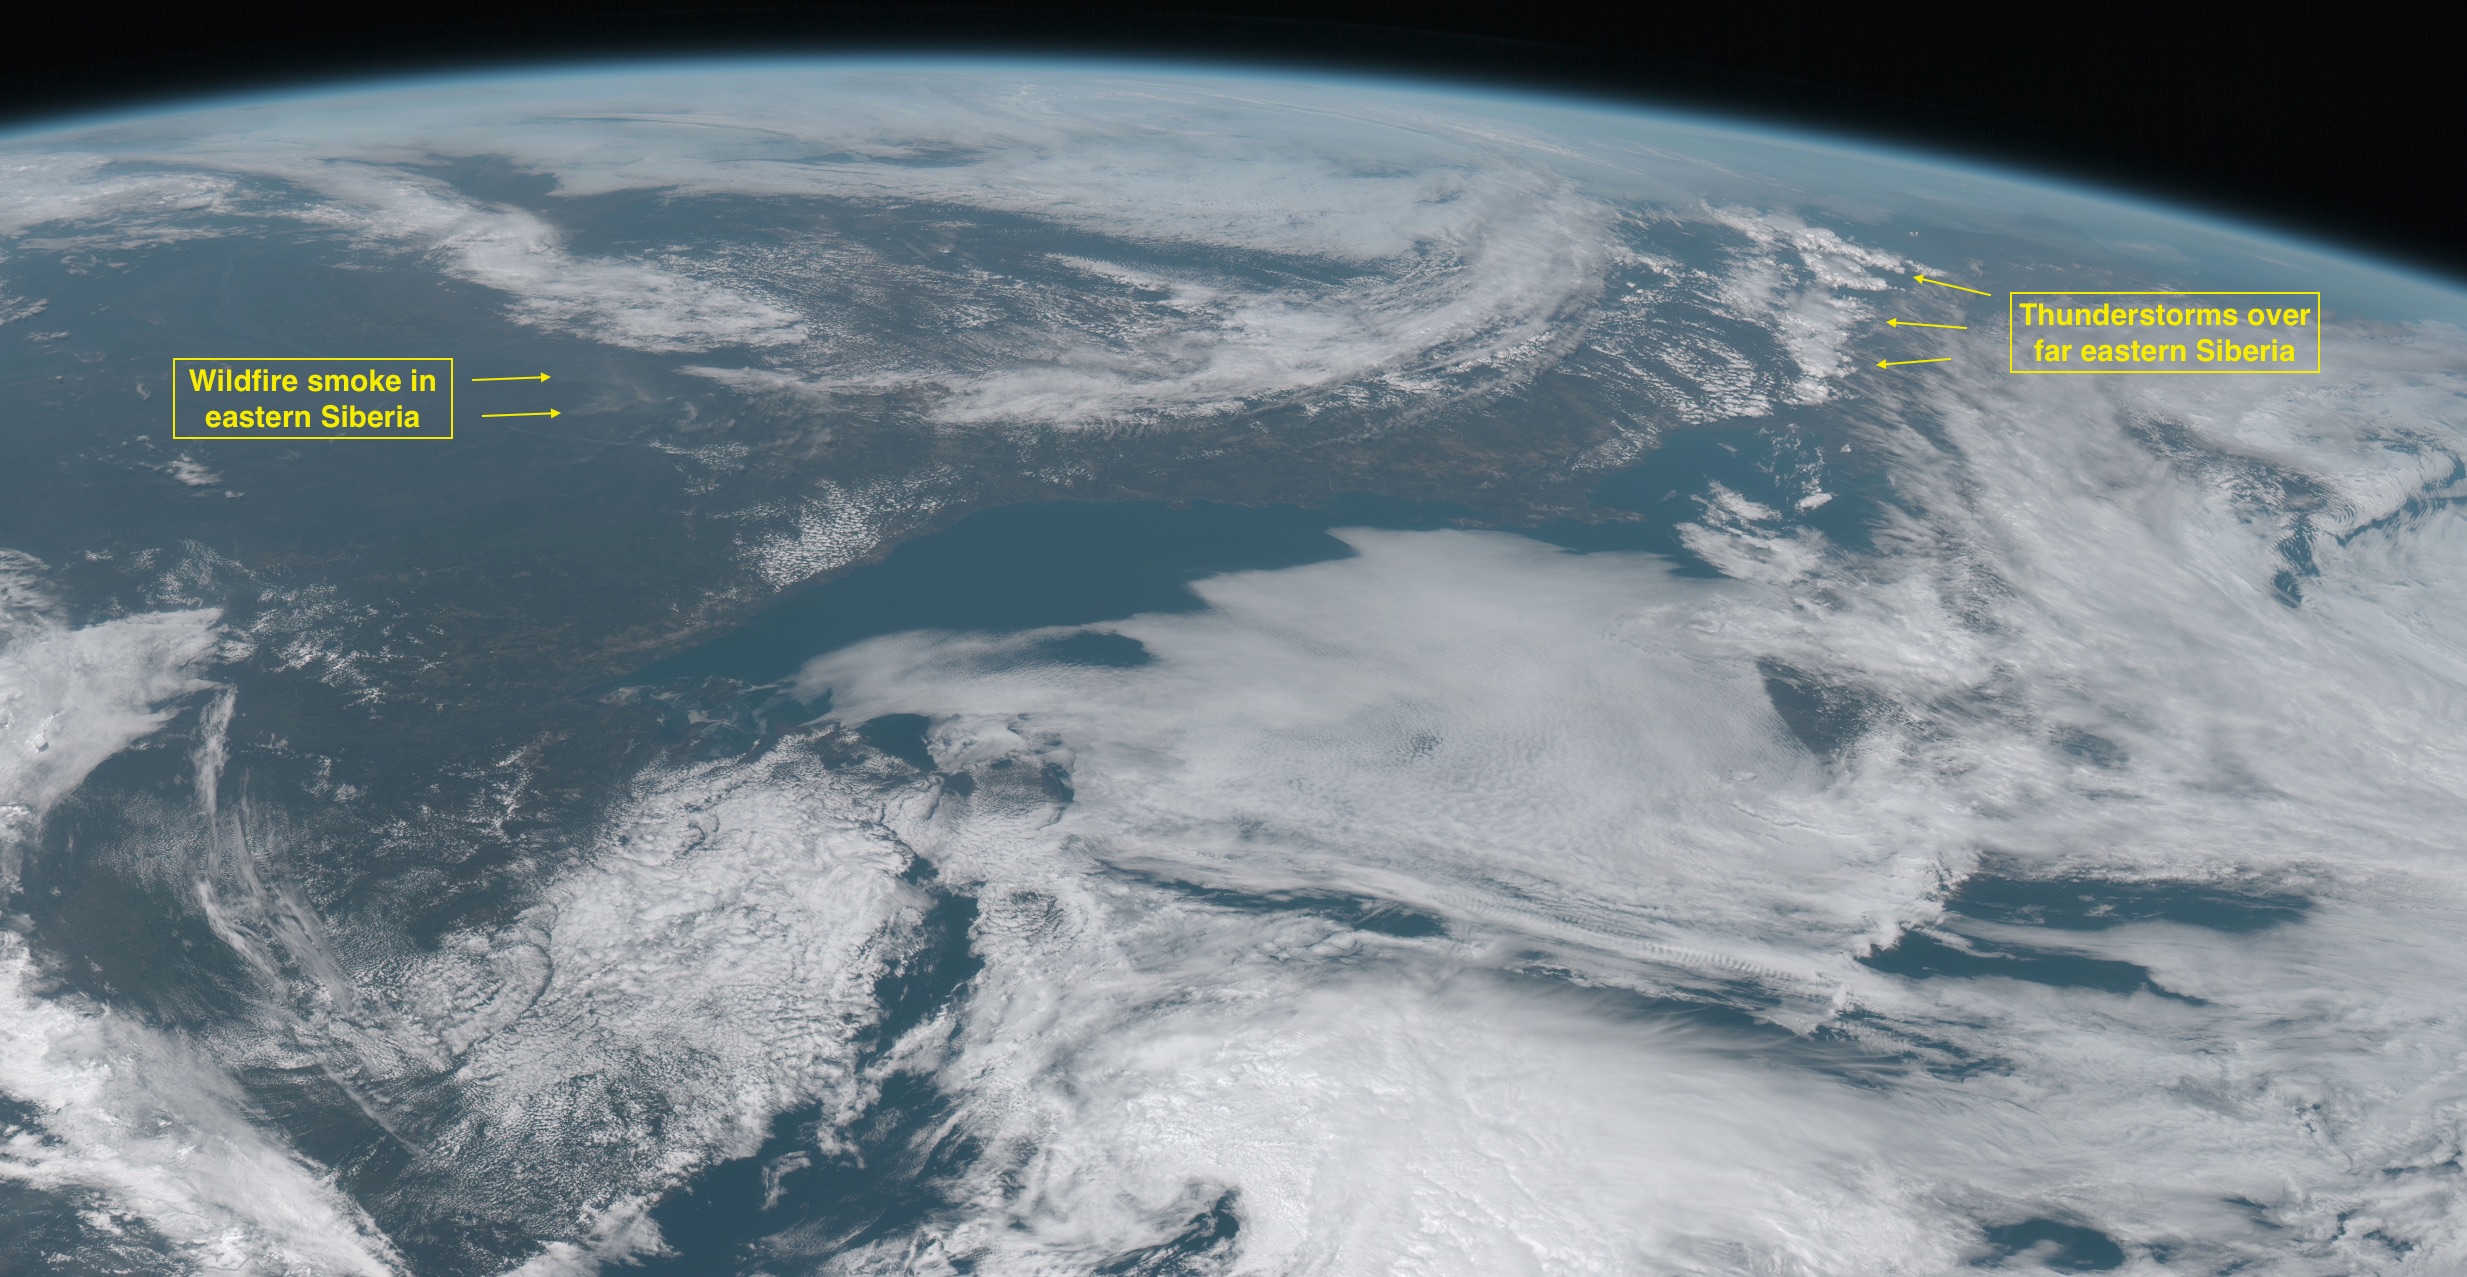
Wildfire smoke and thunderstorms in Siberia
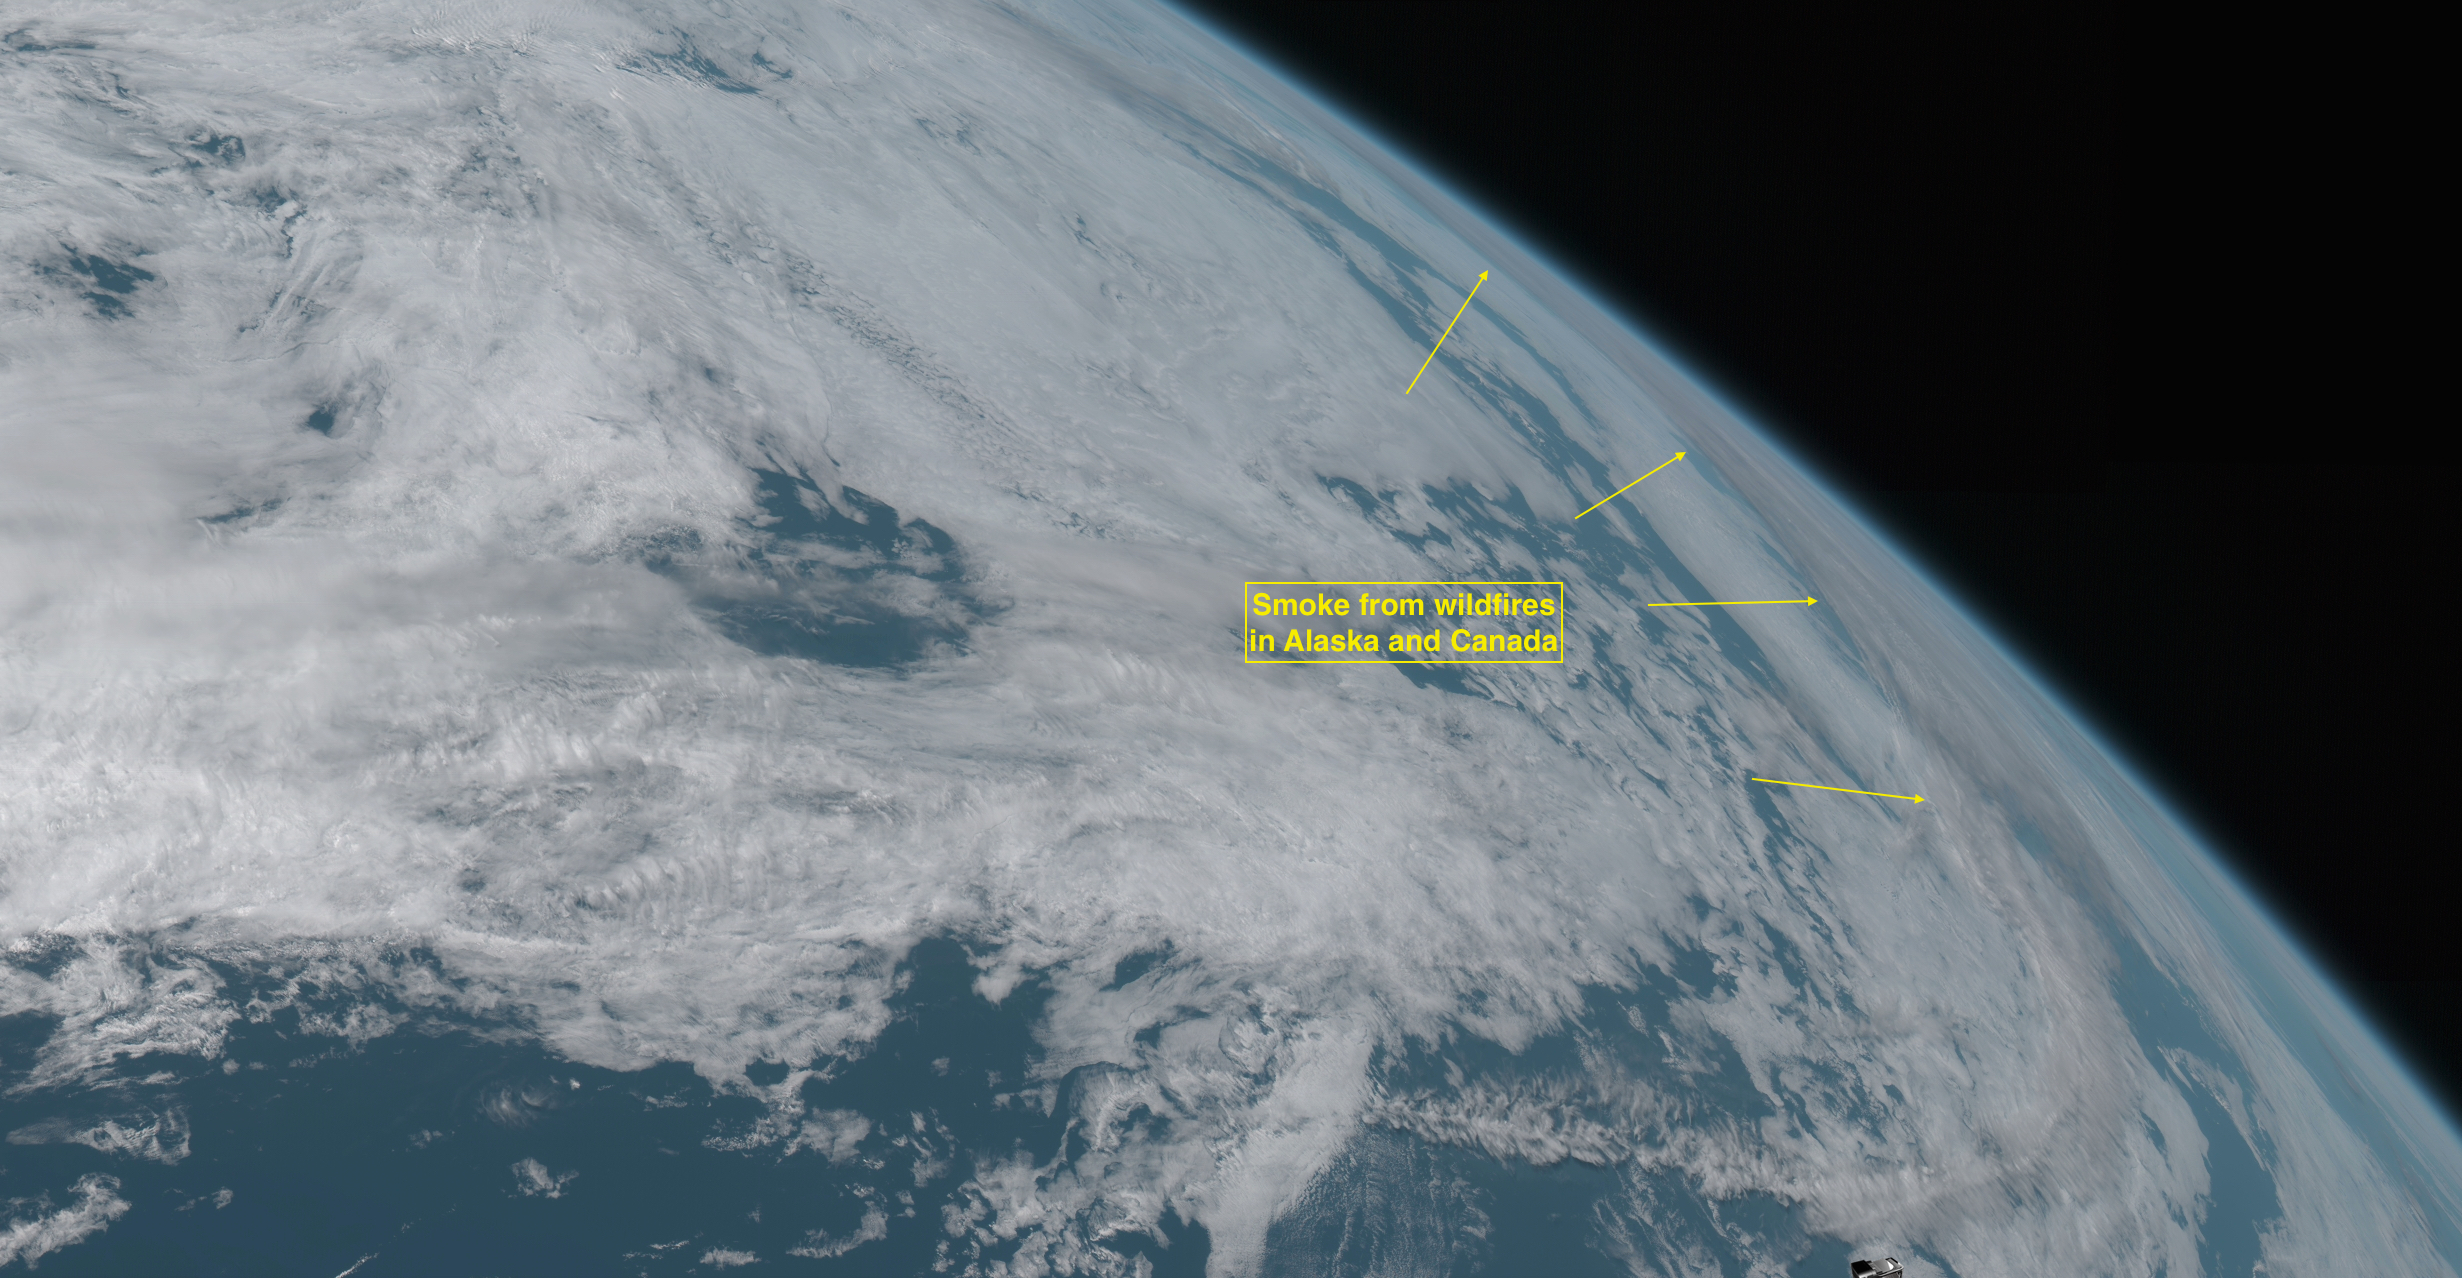
Smoke from fires in Alaska and Canada
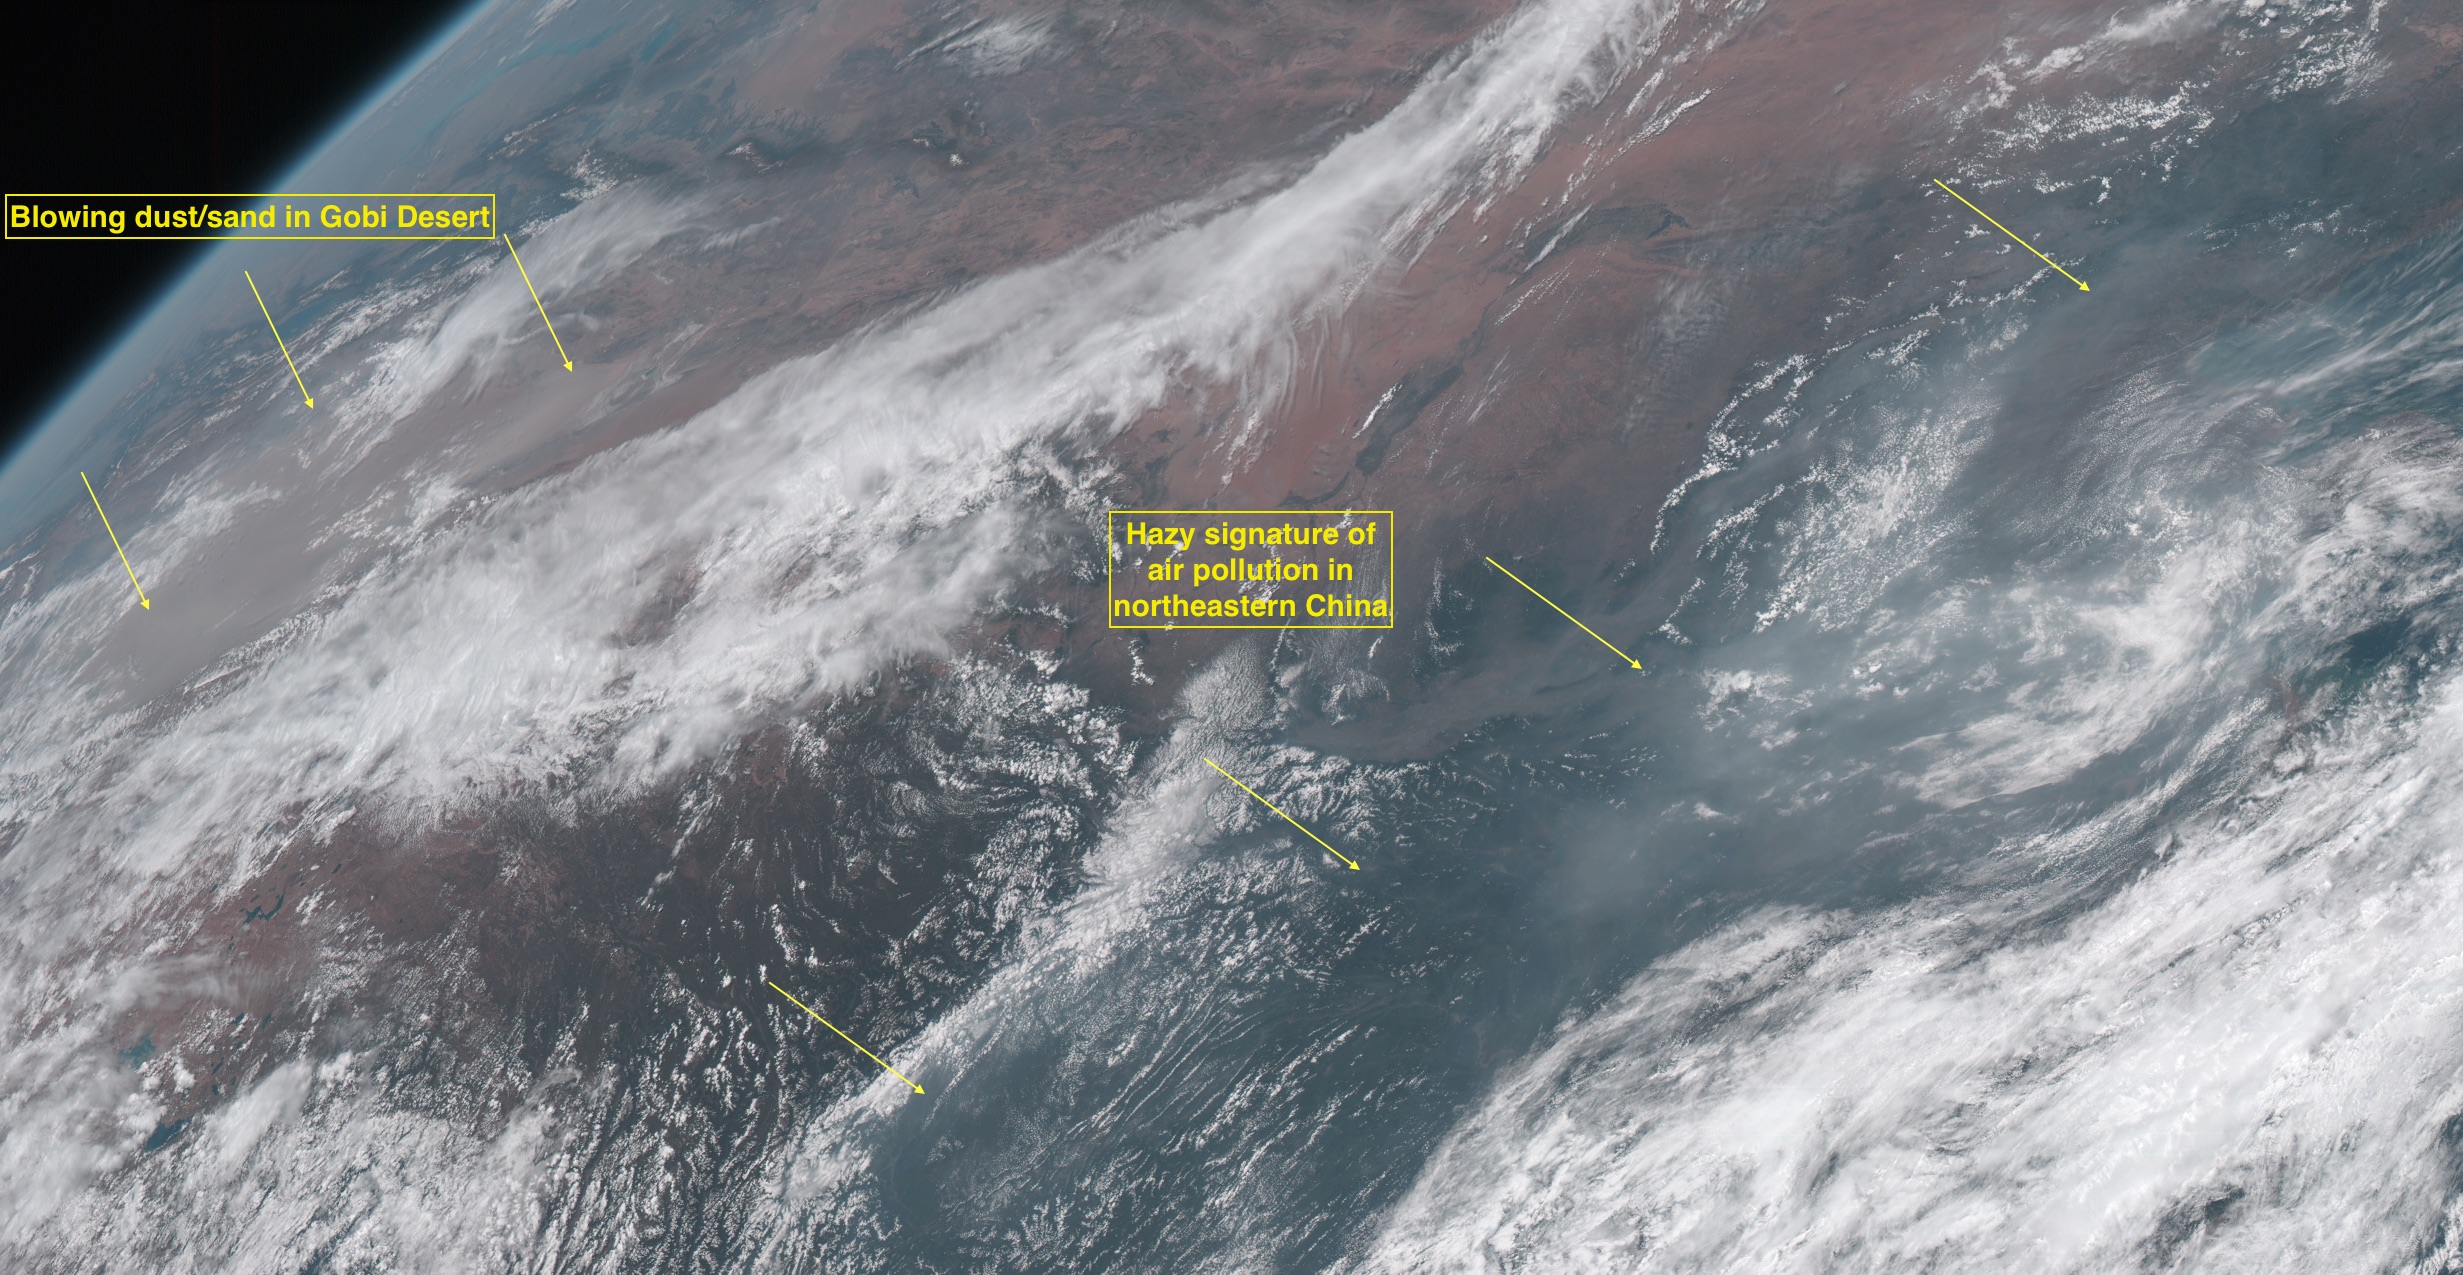
Blowing dust/sand in the Gobi Desert, and air pollution in northeastern China
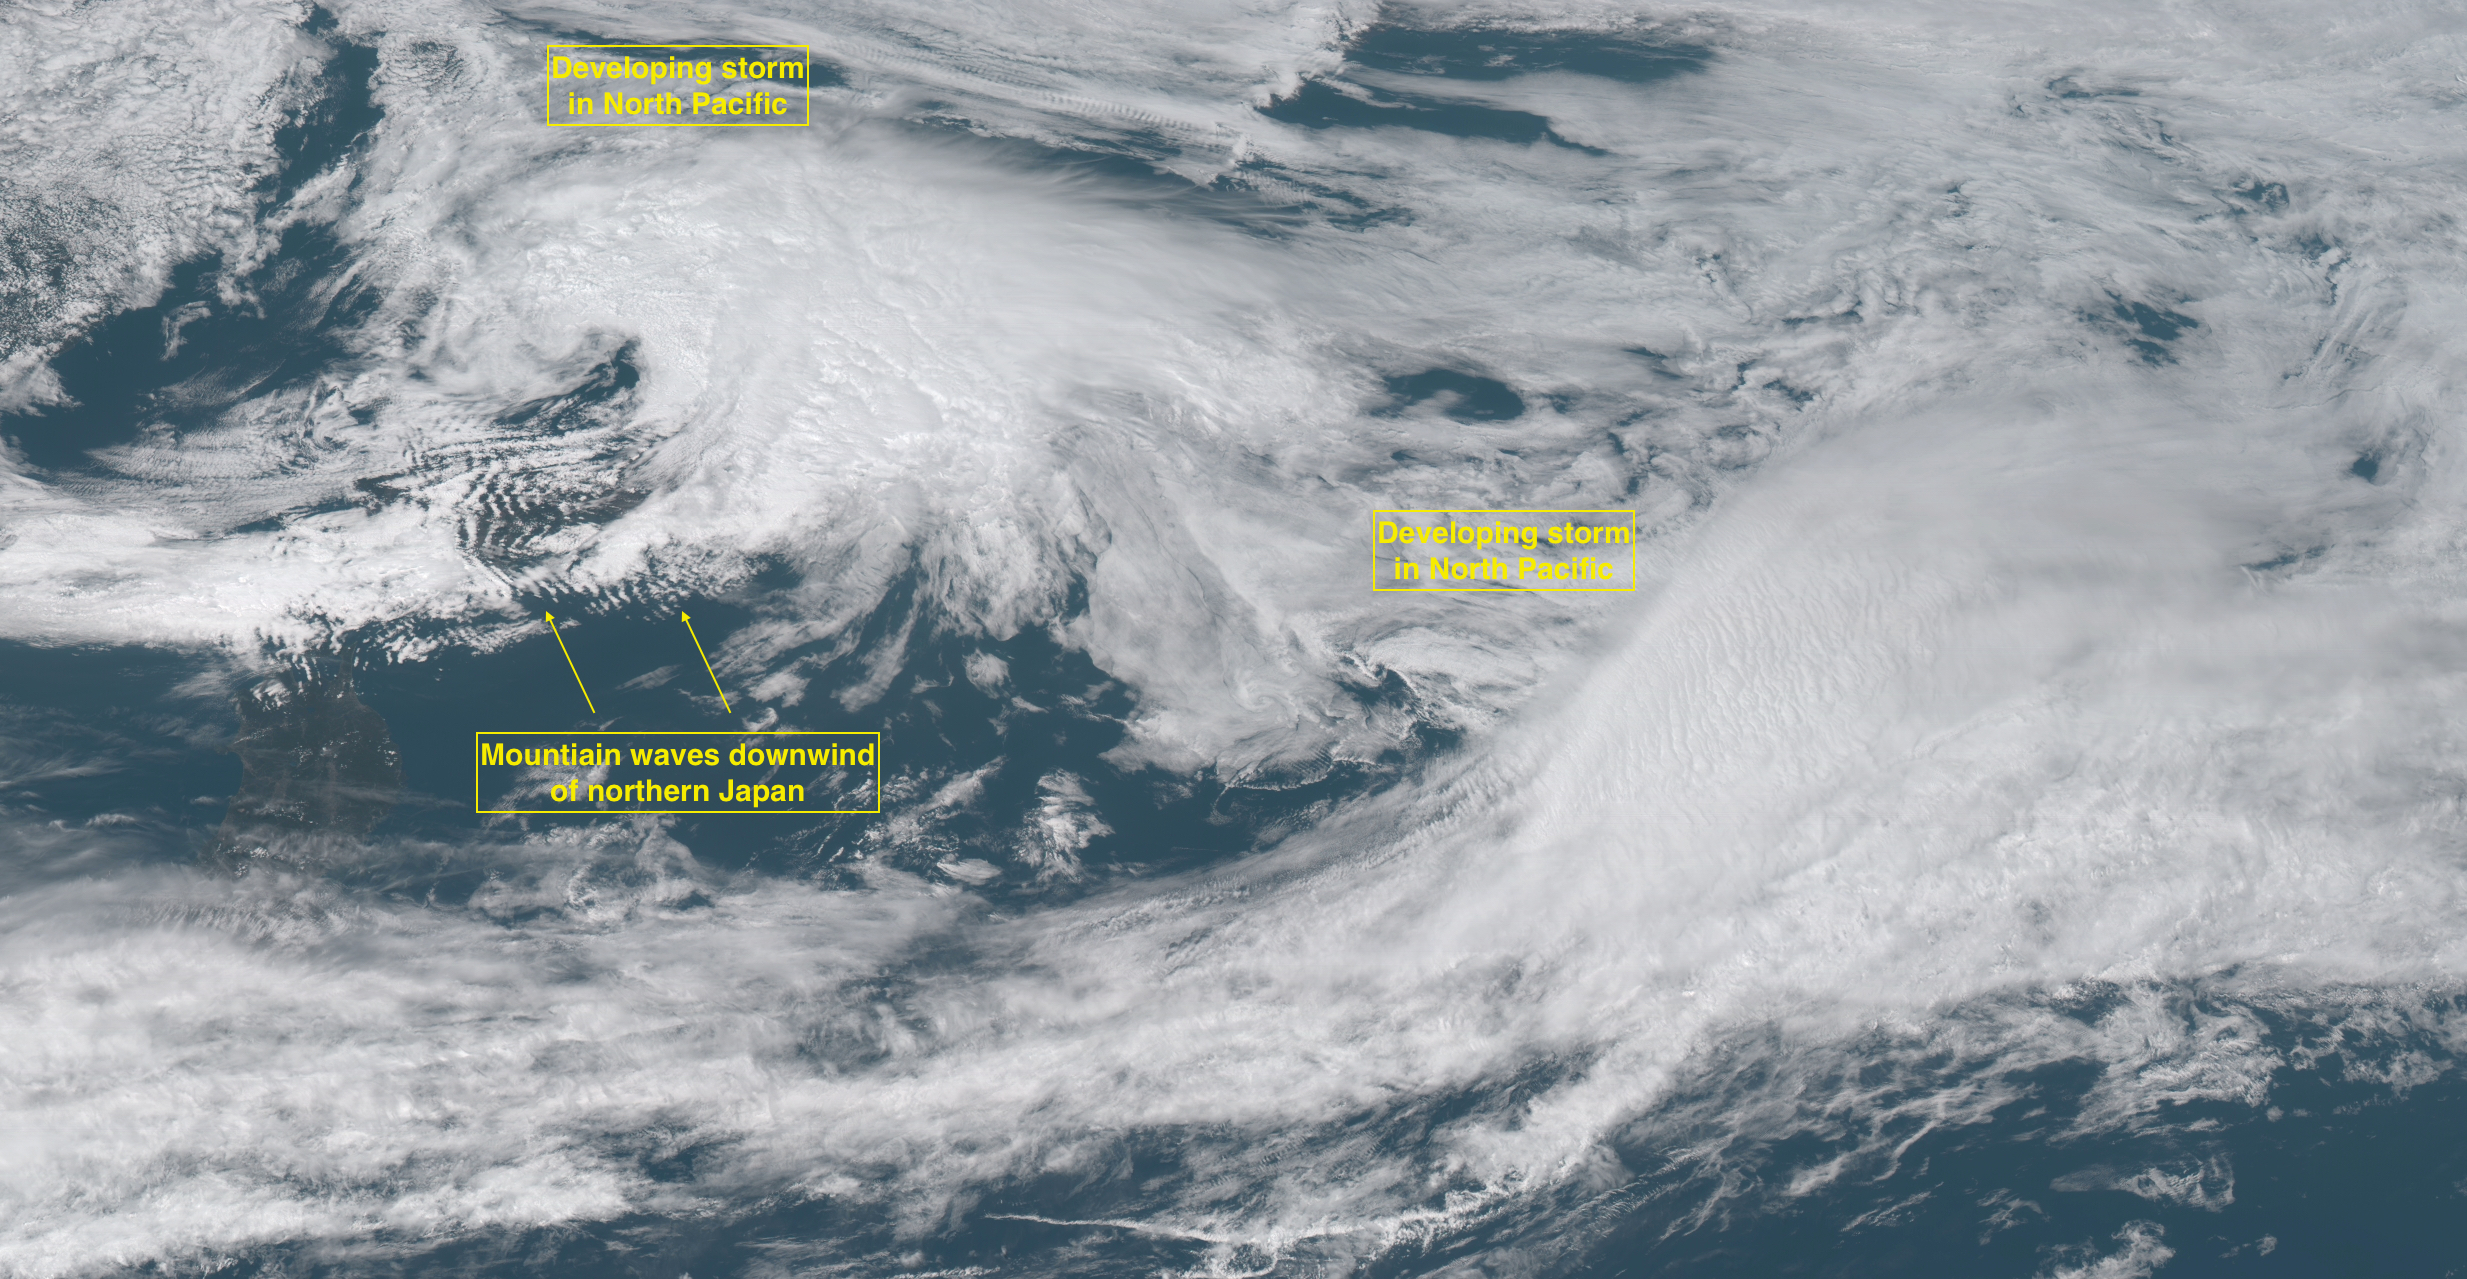
Mountain waves downwind of Japan, and developing storms in the North Pacific Ocean
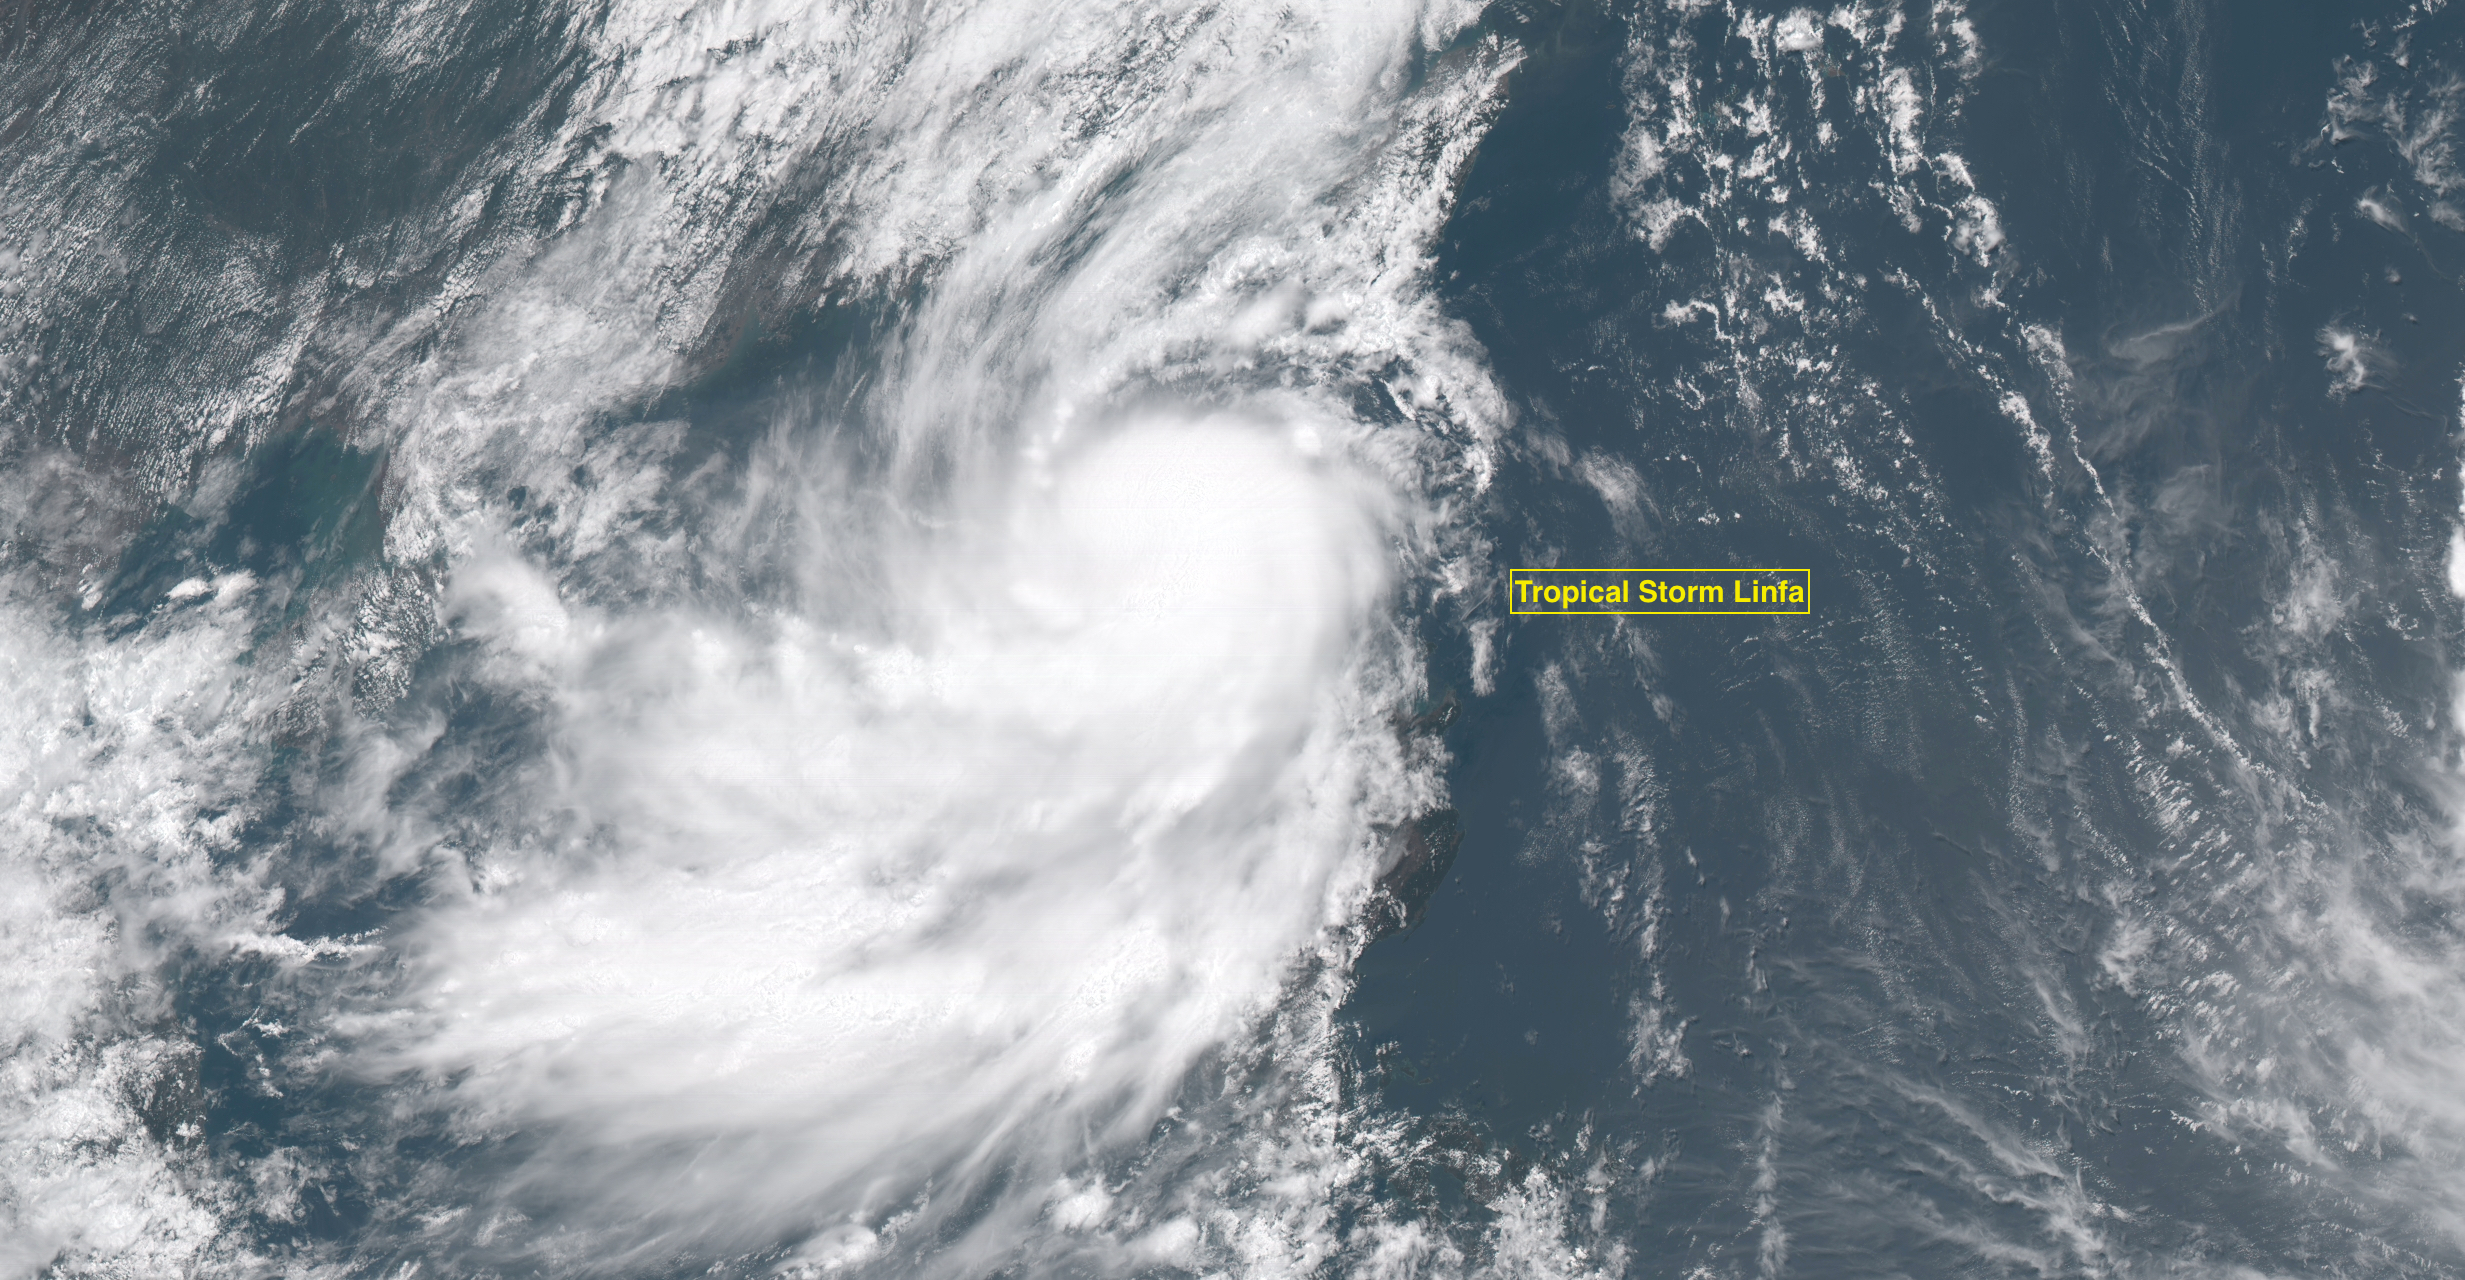
Tropical Storm Linfa off the coast of China
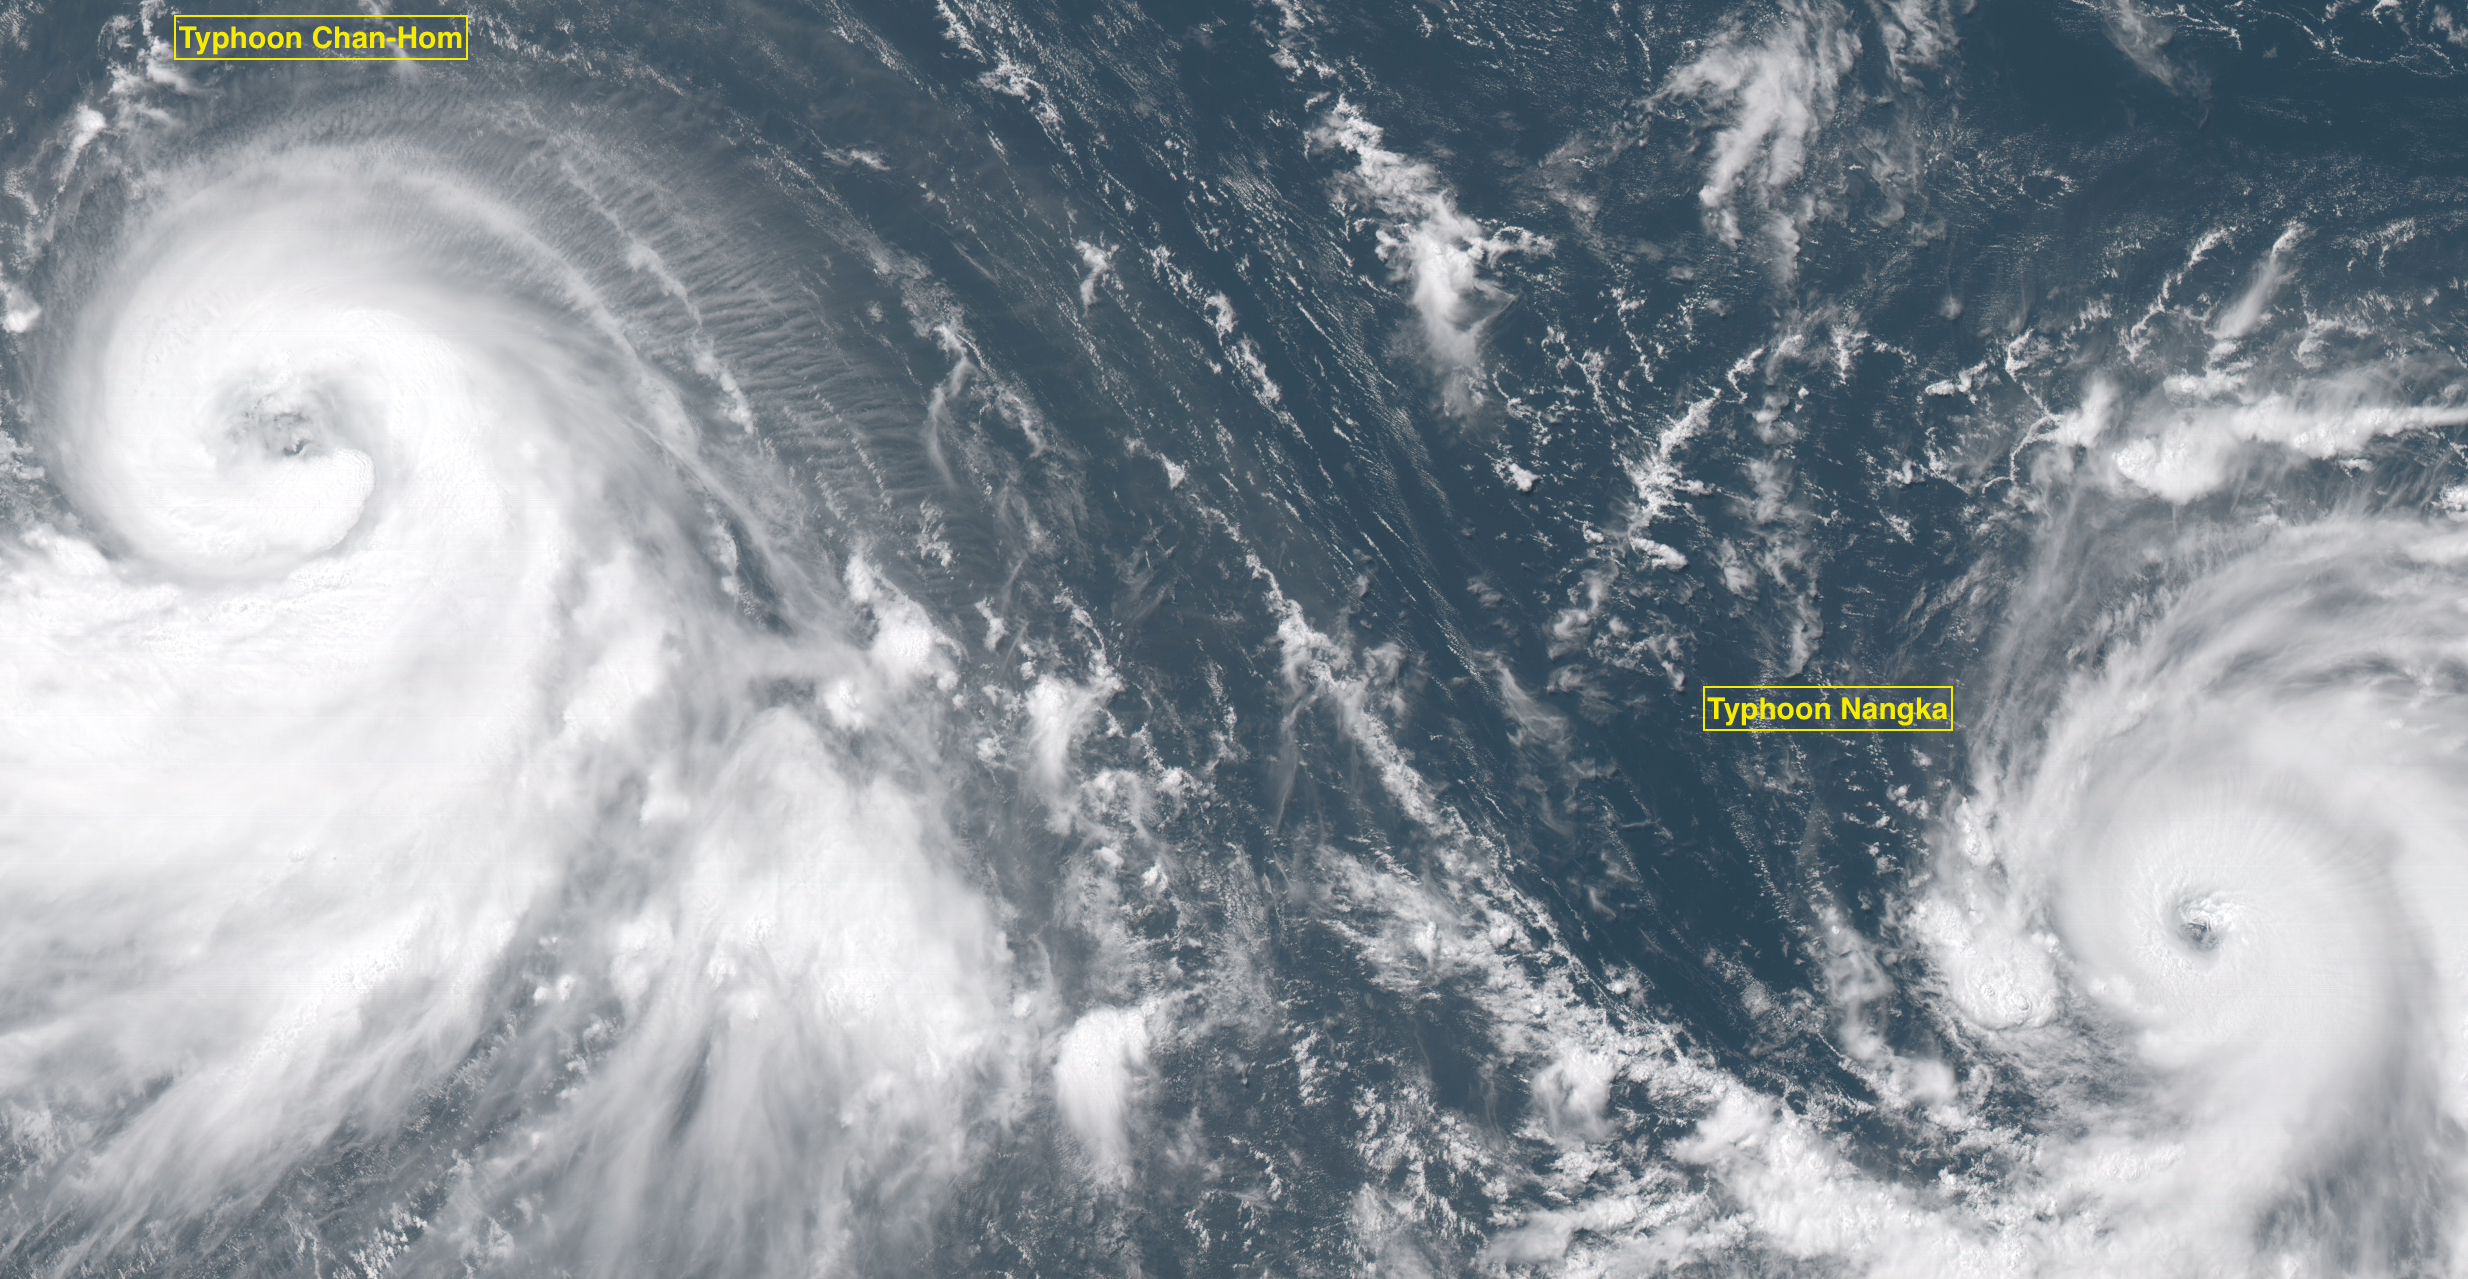
Typhoons Chan-Hom and Nangka in the West Pacific Ocean
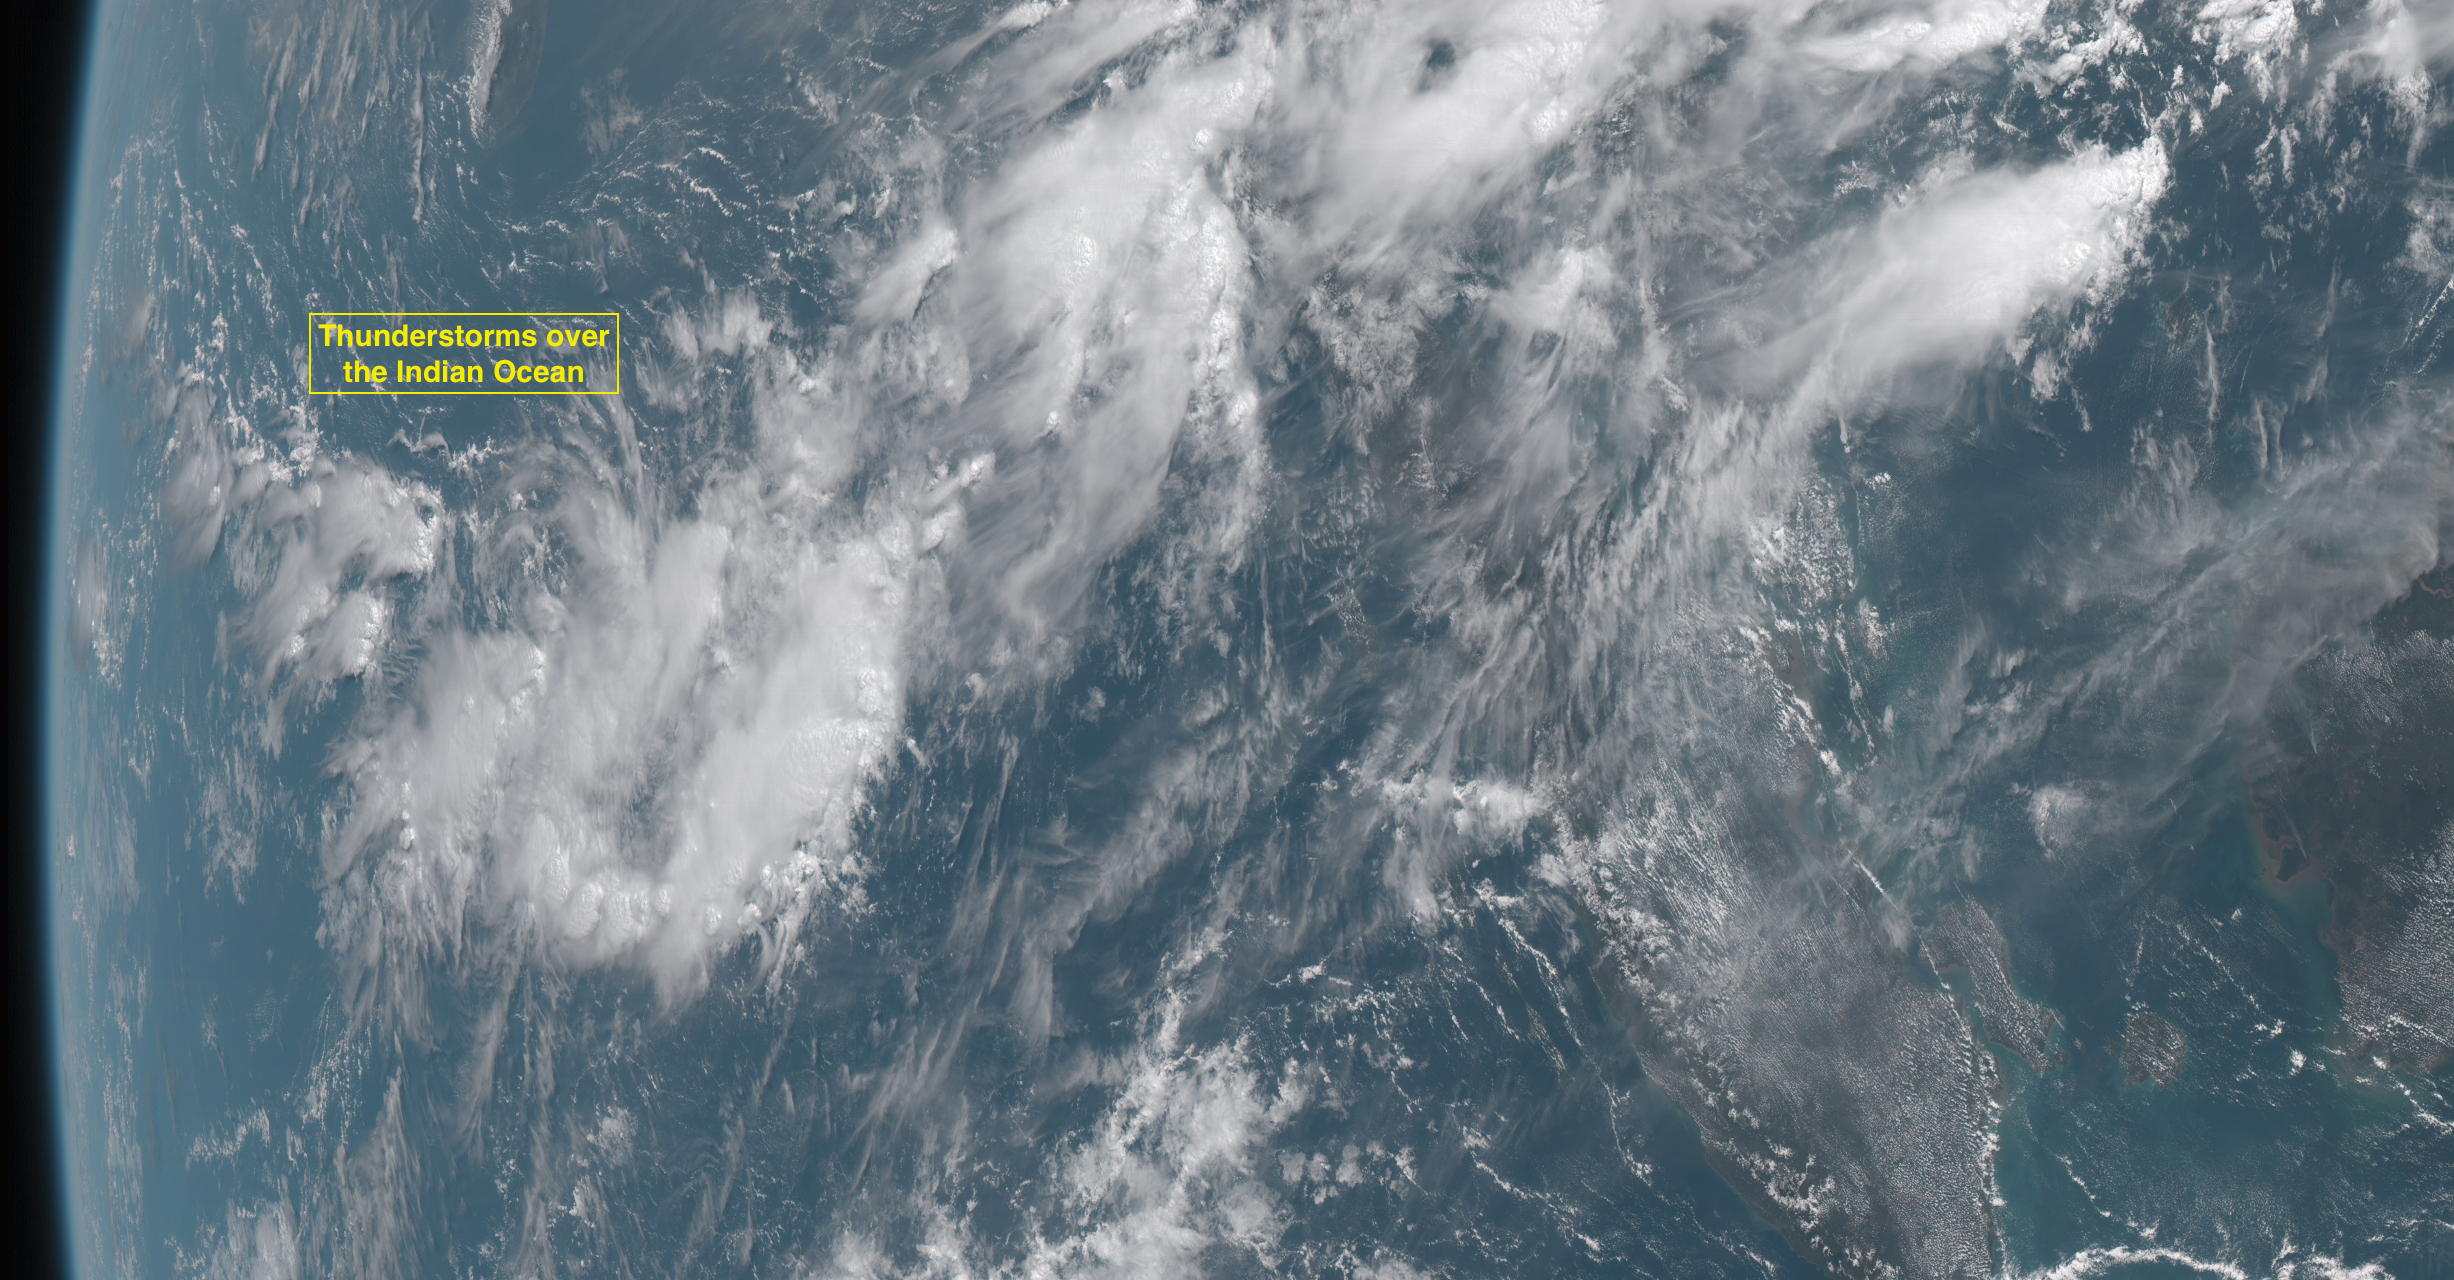
Thunderstorms over the Indian Ocean
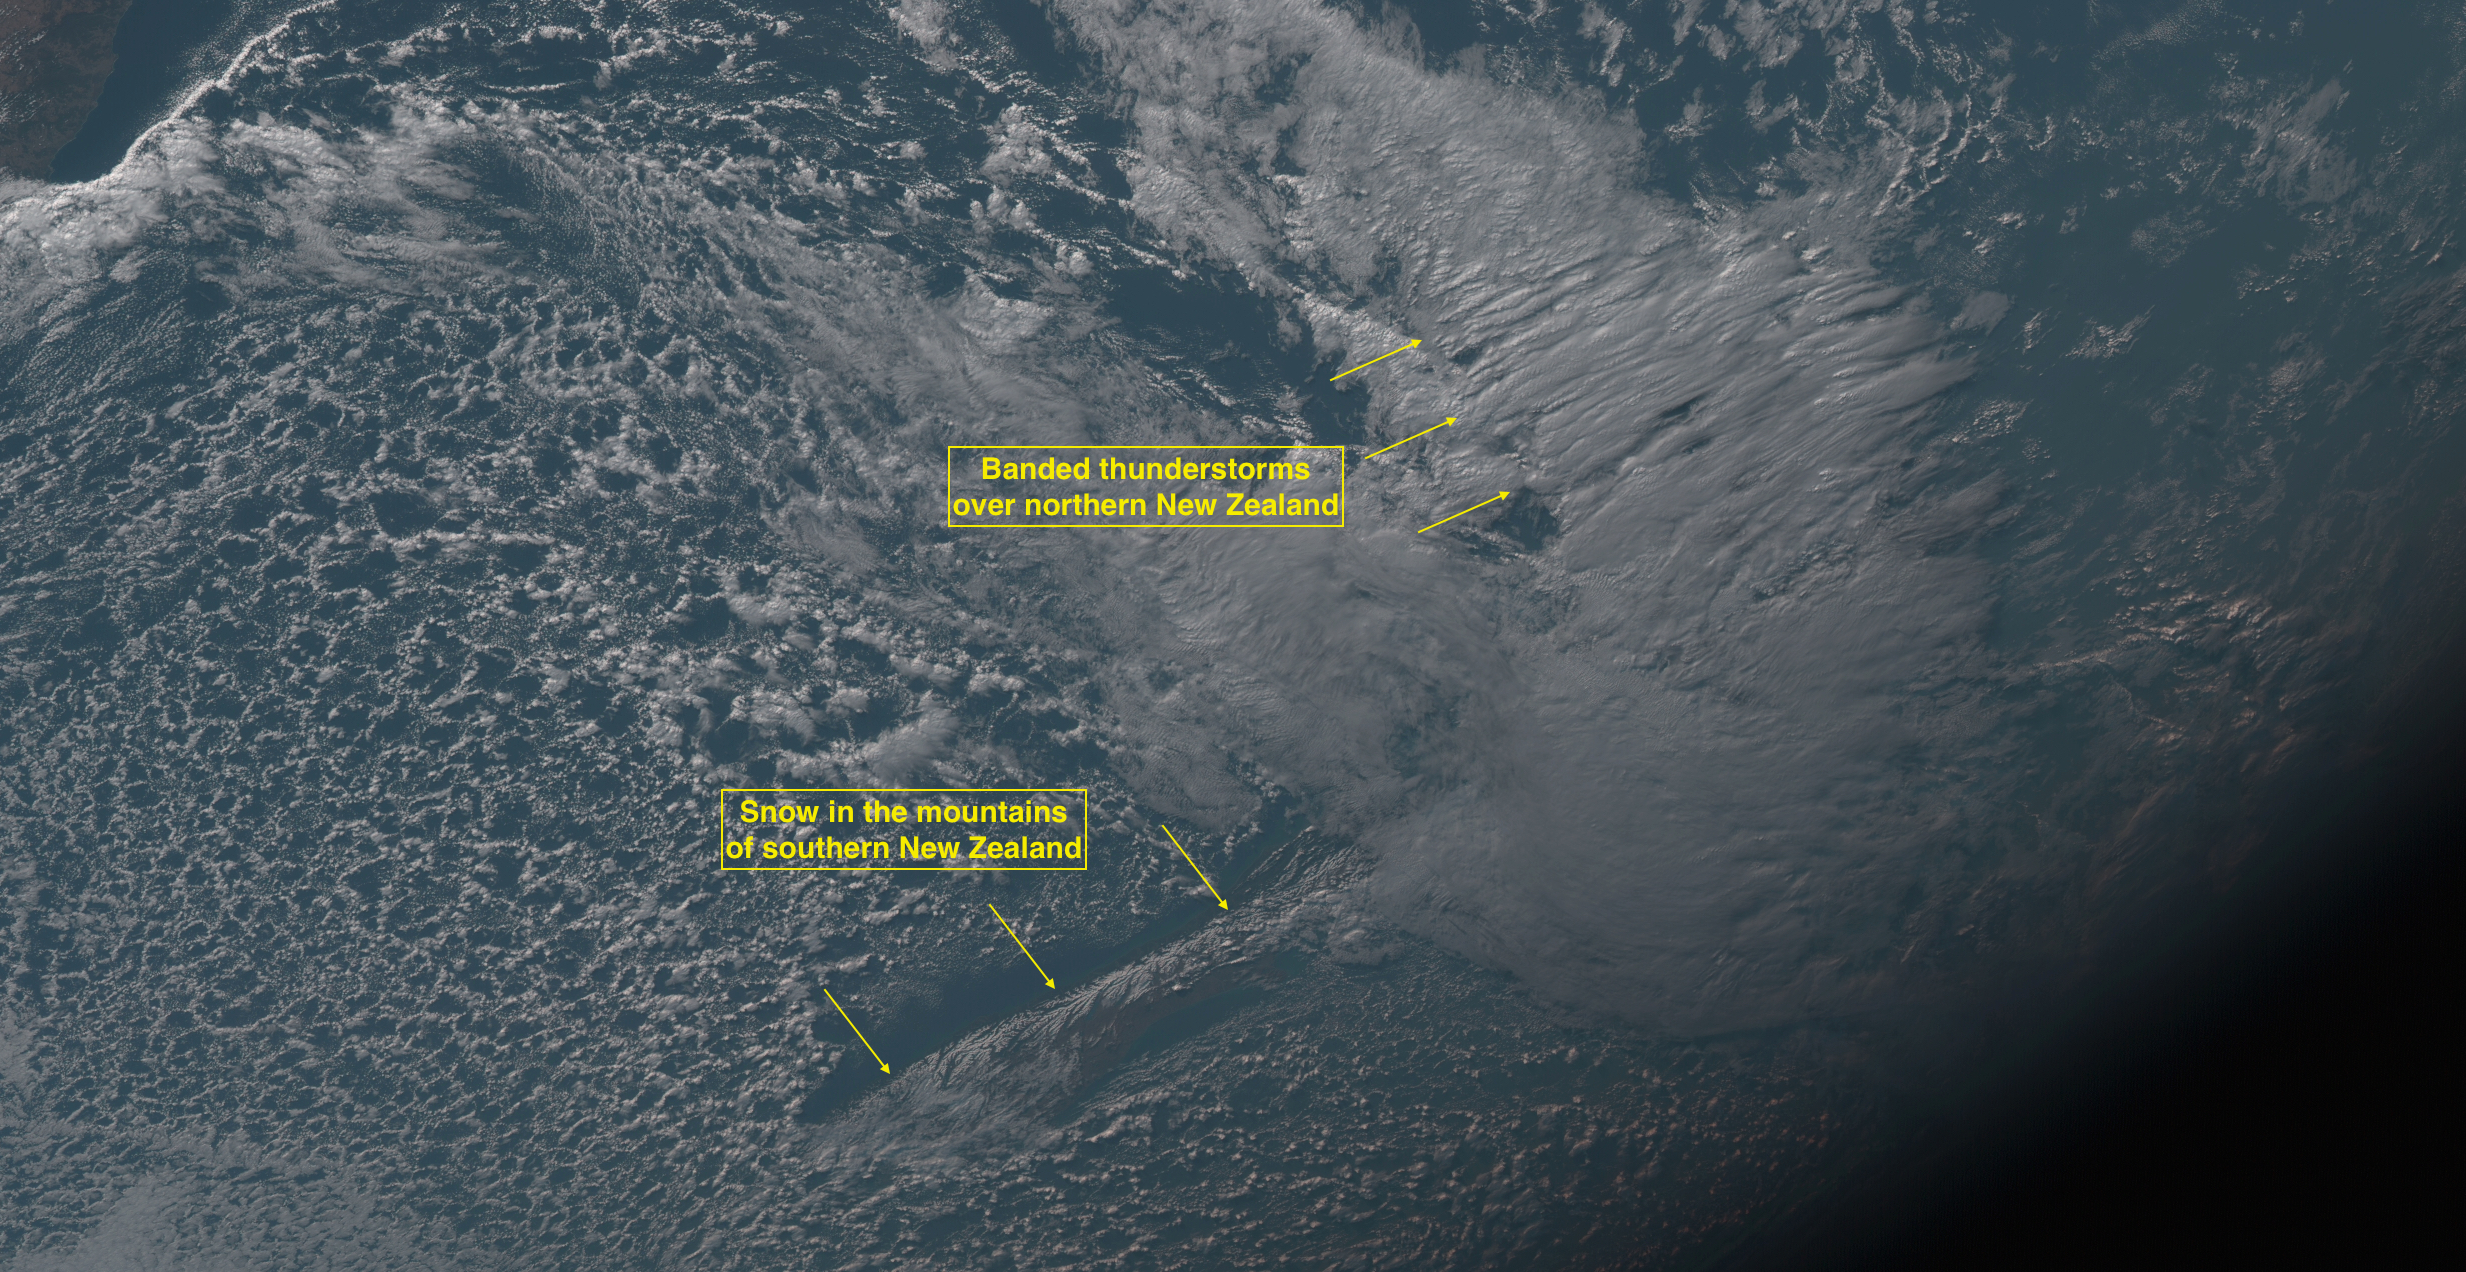
Banded thunderstorms over northern New Zealand, and snow cover in the mountains of southern New Zealand
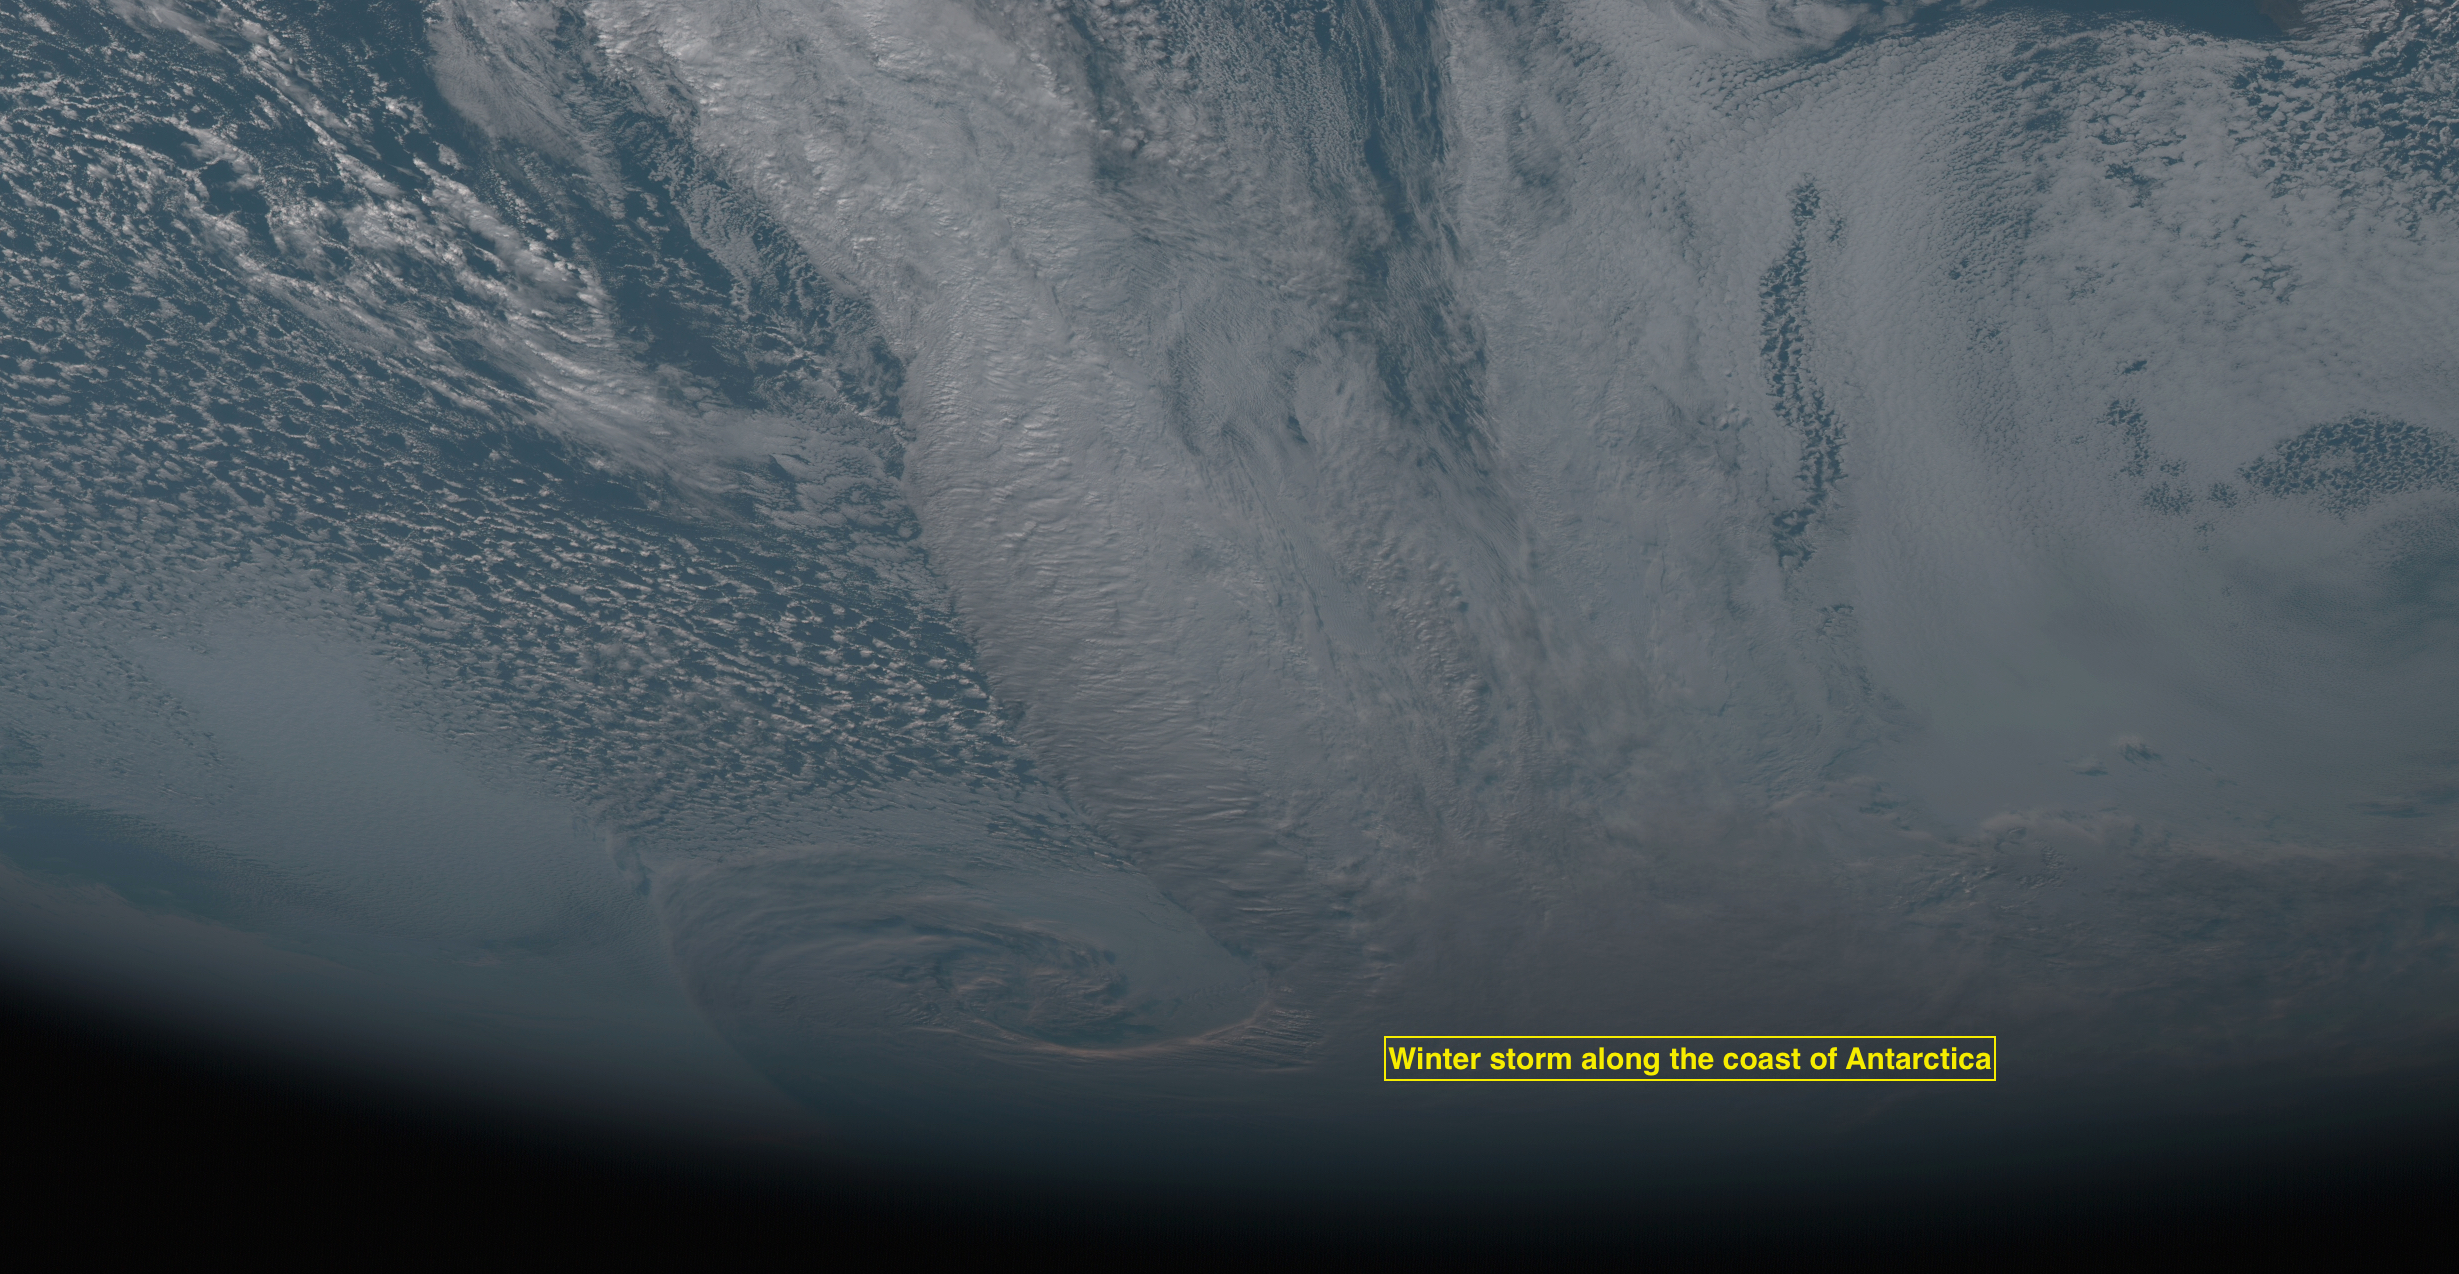
Winter storm along the coast of Antarctica
View only this post
Read Less

