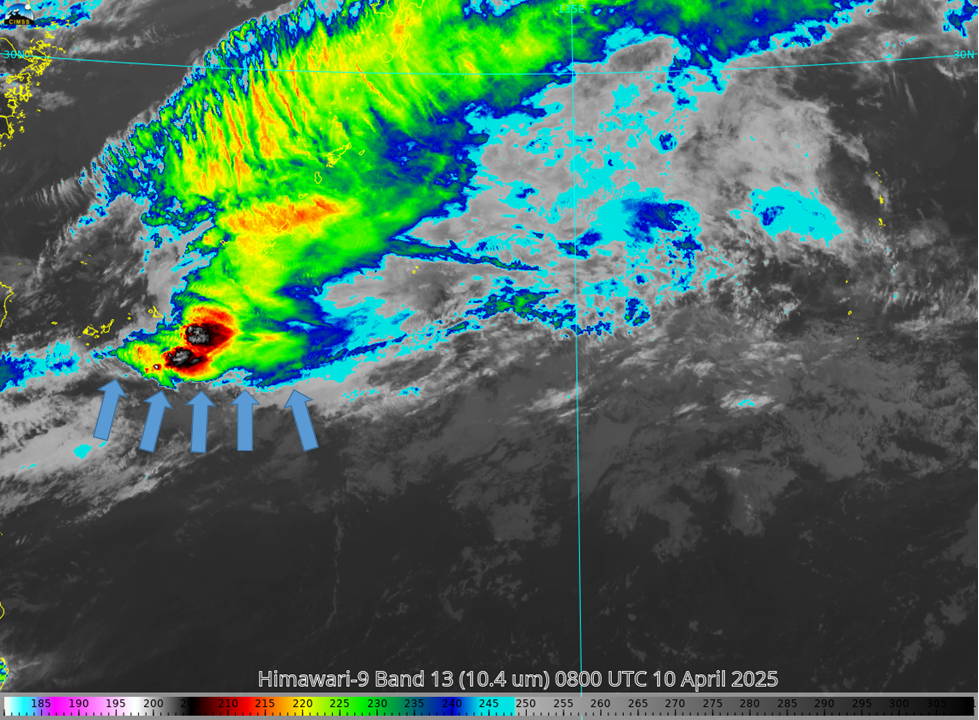
Himawari-9 clean window (Band 13, 10.4 µm) infrared imagery, below, (created using geo2grid software and HSD files from the SSEC Data Center) shows strong convection developing in the Philippine Sea between the Philippines to the southwest, the Ryuku Islands to the west, Japan to the north, and Guam far to the east. The structure of the the convection in the infrared imagery at the start of the animation strongly suggests development along an outflow boundary that persists through much of the animation.
The toggle below shows where the outflow might exist at 0800 UTC.
This area of the western Pacific Ocean falls under the view of the Direct Broadcast antenna in the back yard of the National Weather Service on the island of Guam. What does the information downloaded from that antenna show? Three derived rain-rates from MetopC, NOAA-20 and NOAA-21 are shown below (imagery courtesy Douglas Schumacher, SSEC/CIMSS). The convection persisted for these five hours.

Day Night Band imagery from NOAA-21 shows that the strong convection was electrified. Lightning streaks are obvious in the Day Night band imagery.

Ground-based lightning observations, below (Courtesy Brandon Aydlett, Science/Operations Officer in Guam), also show extensive lightning with this convective system.
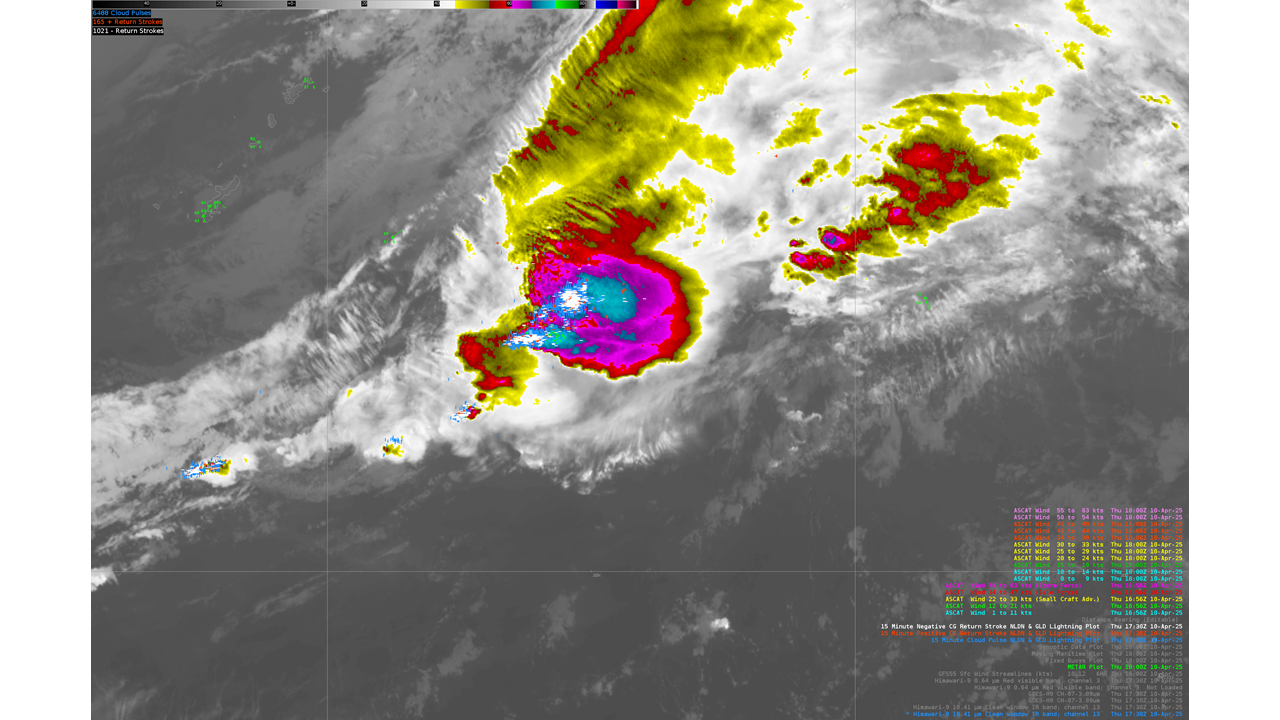
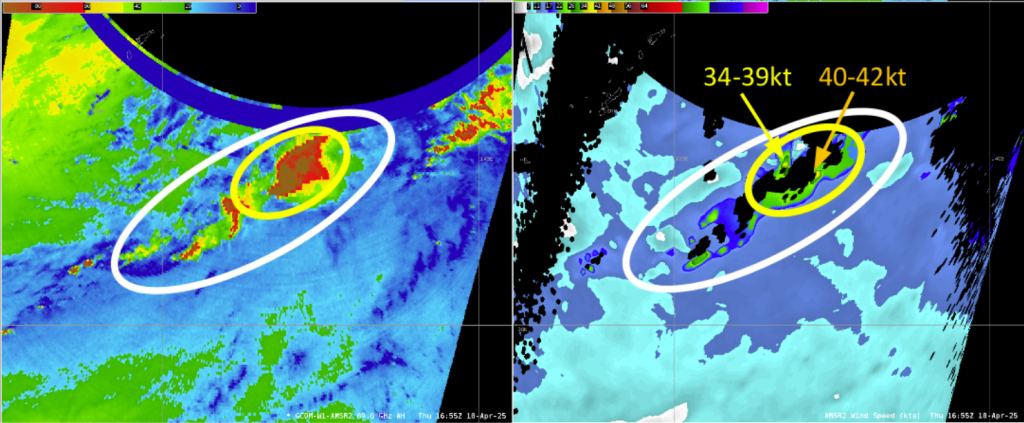
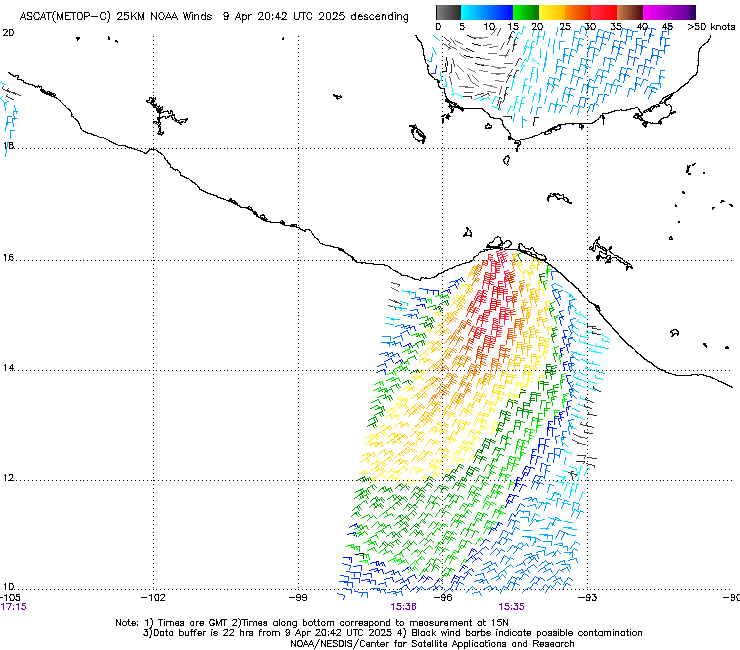
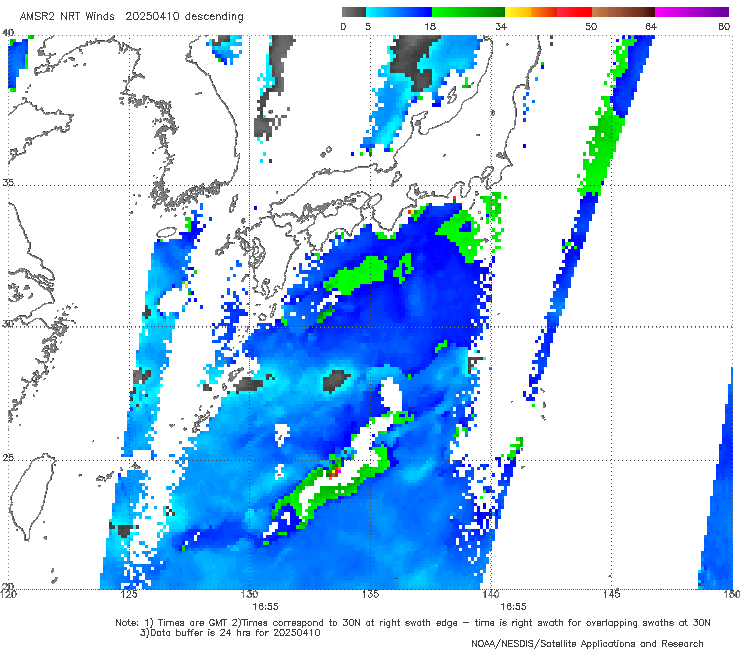
GCOM AMSR-2 imagery, below (also processed at the Direct Broadcast site on Guam, and ingested into the AWIPS machine, and also courtesy of Brandon Aydlett, WFO Guam), shows the strong microwave signal and the winds diagnosed to exceed 40 knots (and the region where wind diagnostics failed because of rain contamination). The wind speeds are also available at this NOAA/NESDIS site.
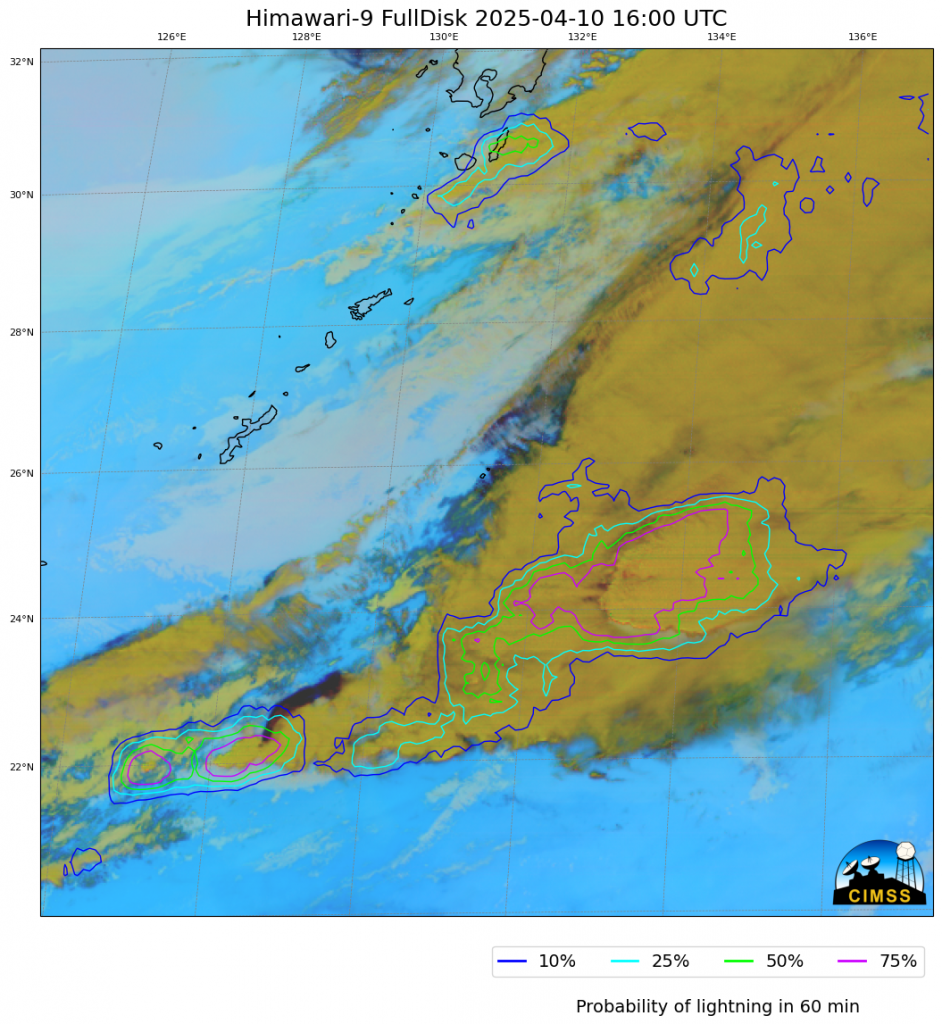
Himawari-9 Full Disk airmass RGB imagery (source) from late in the day on 10 April, below, shows that this convection was to the south of a developing cyclone moving into the northwest Pacific Ocean.
Given all the lightning observed at 1700-1730 UTC, a natural question might be: what did LightningCast probabilities (computed with Himawari-9 data and CSPP Geo LightningCast software) show an hour earlier? Very large probabilities centered near 25oN, 134oE! A LightningCast animation (here) from 0000 to 2000 UTC on 10 April shows large value moving eastward through the domain below.
Thanks to Brandon Aydlett, WFO Guam, for kick-starting this blog post!
View only this post Read Less


