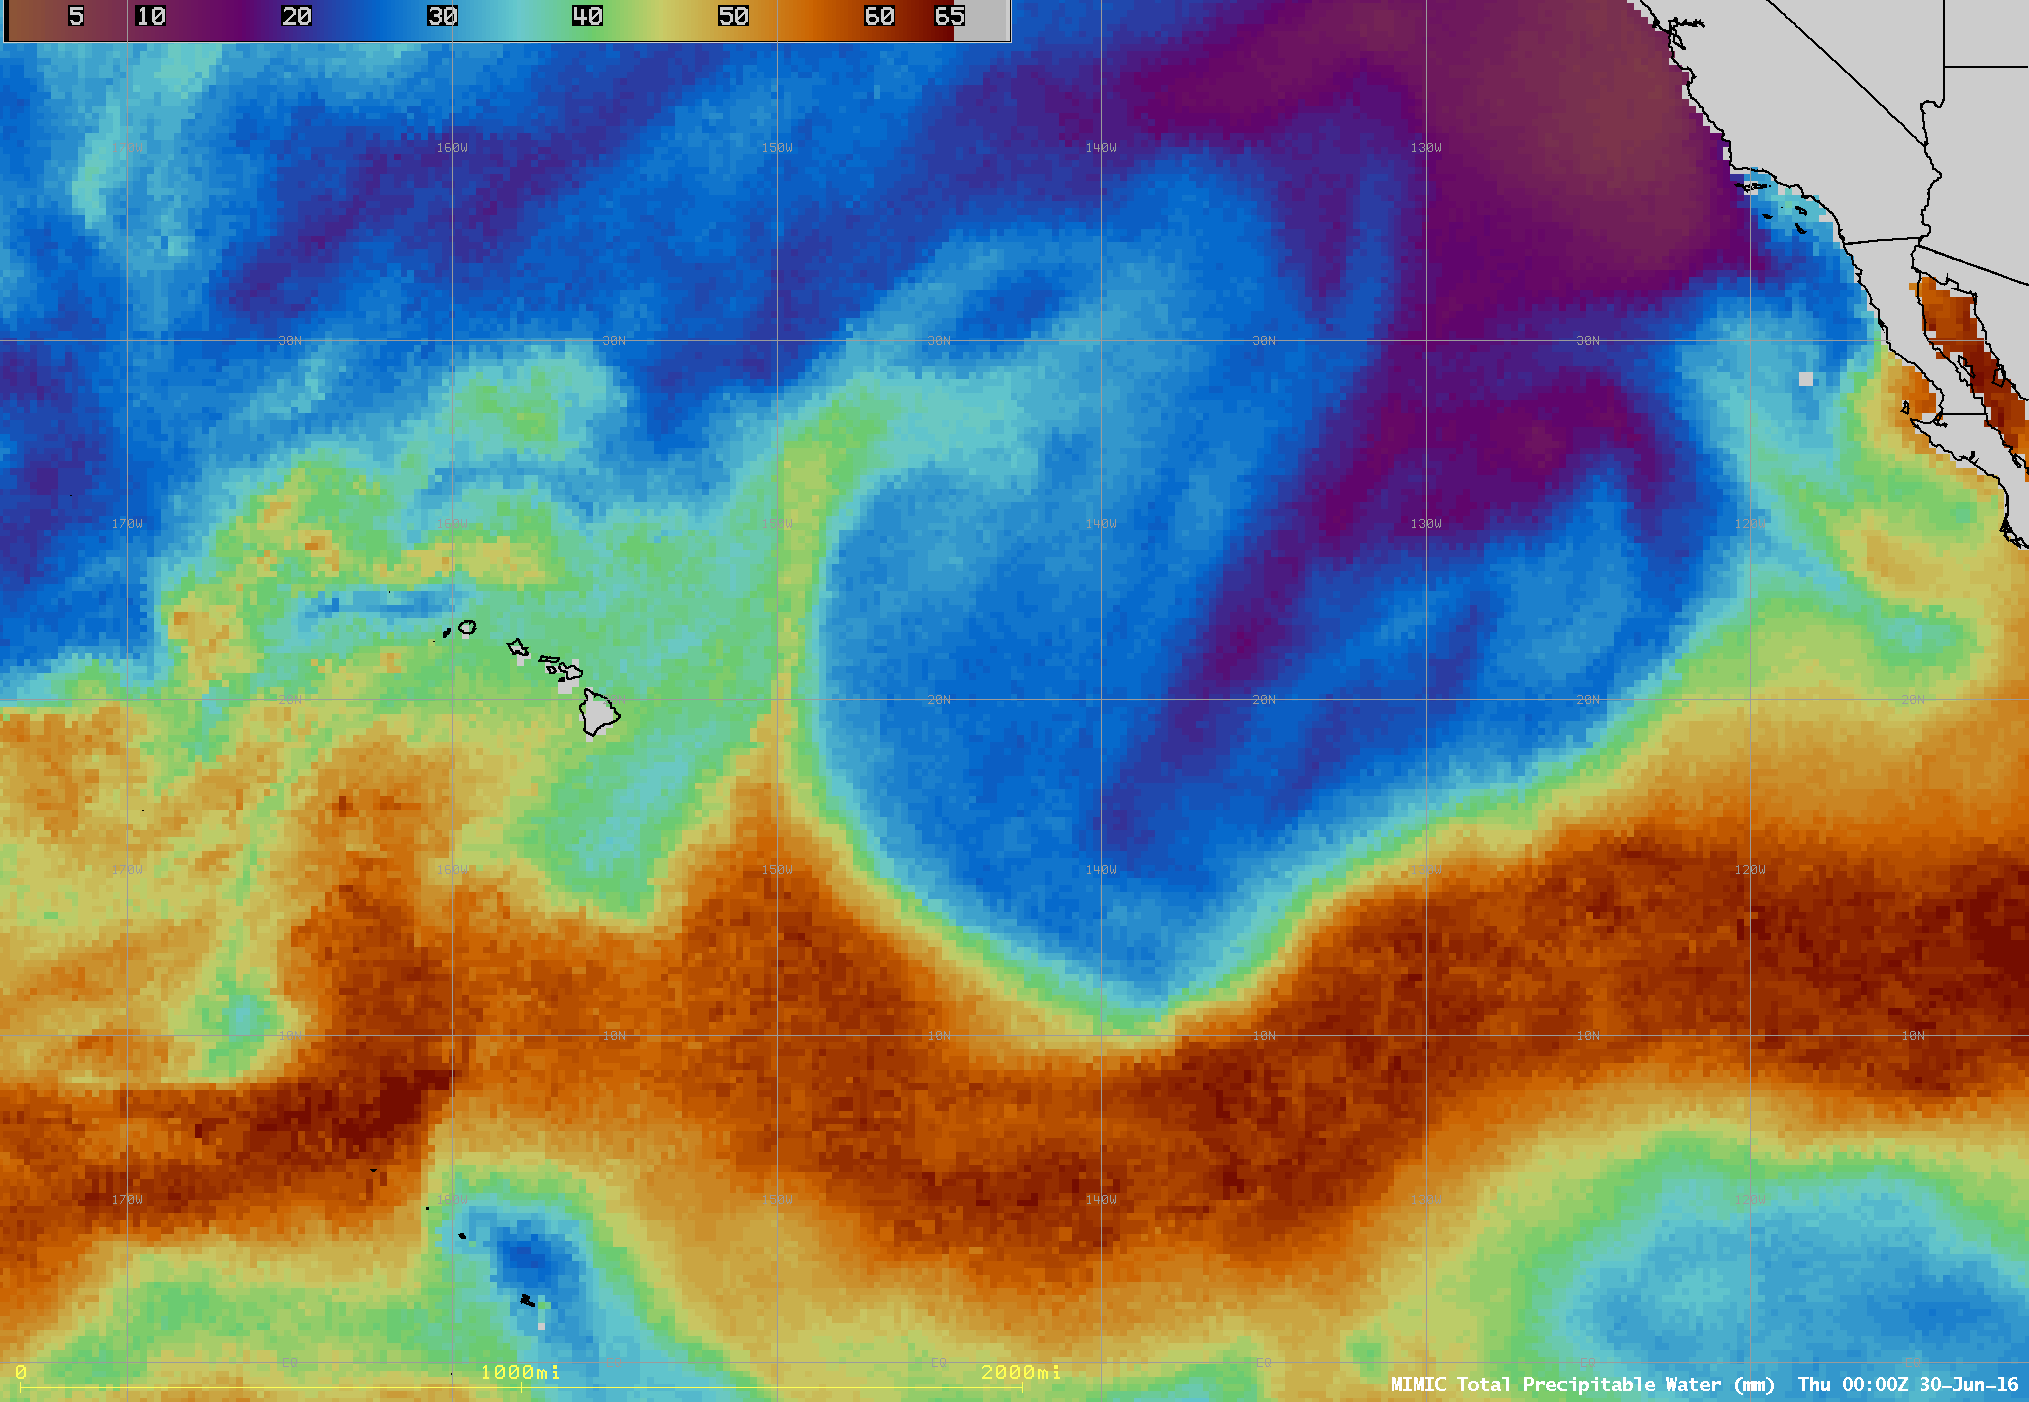
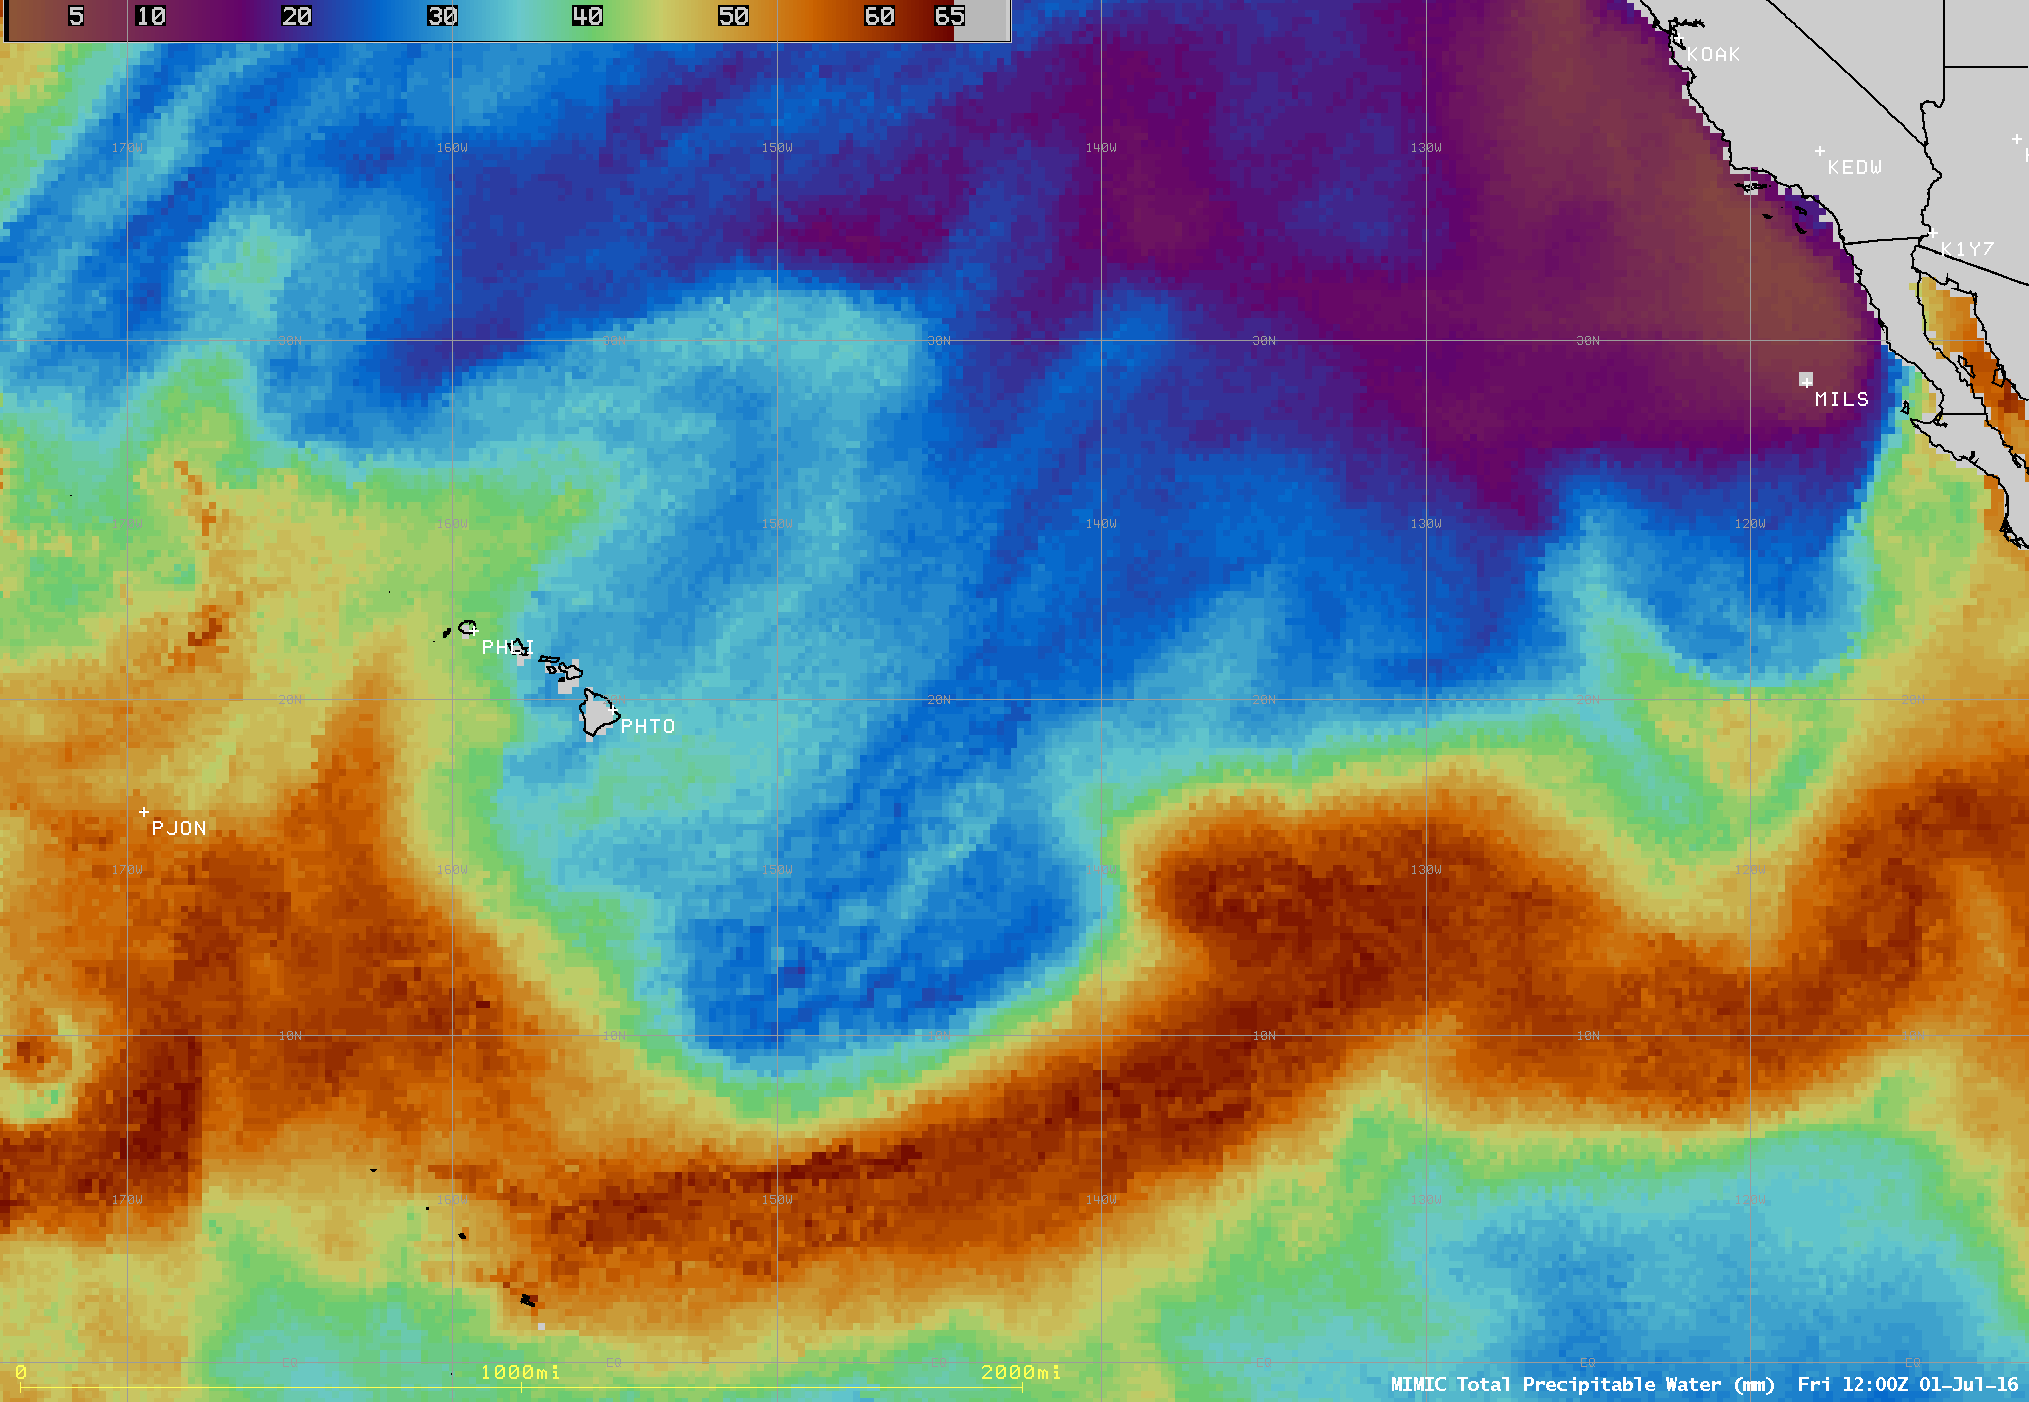
The MIMIC Total Precipitable Water product (above) showed the westward movement of a surge of dry trade winds toward Hawai’i during the 28 June – 01 July 2016 period. This push of dry air was being driven by a large area of high pressure centered about 1200 miles northeast of the island chain. A very sharp gradient... Read More
![MIMIC Total Precipitable Water product [click to play animation]](https://cimss.ssec.wisc.edu/satellite-blog/wp-content/uploads/sites/5/2016/07/MIMIC_TPW_20160630_0000.png)
MIMIC Total Precipitable Water product [click to play animation]
The
MIMIC Total Precipitable Water product
(above) showed the westward movement of a surge of dry trade winds toward Hawai’i during the 28 June – 01 July 2016 period. This push of dry air was being driven by a
large area of high pressure centered about 1200 miles northeast of the island chain. A very sharp gradient in TPW existed along the leading edge of the dry surge, with values of 50-55 mm (2.0-2.2 inches) ahead of the boundary dropping to as low as 20-25 mm (0.8-1.0 inch) behind it.
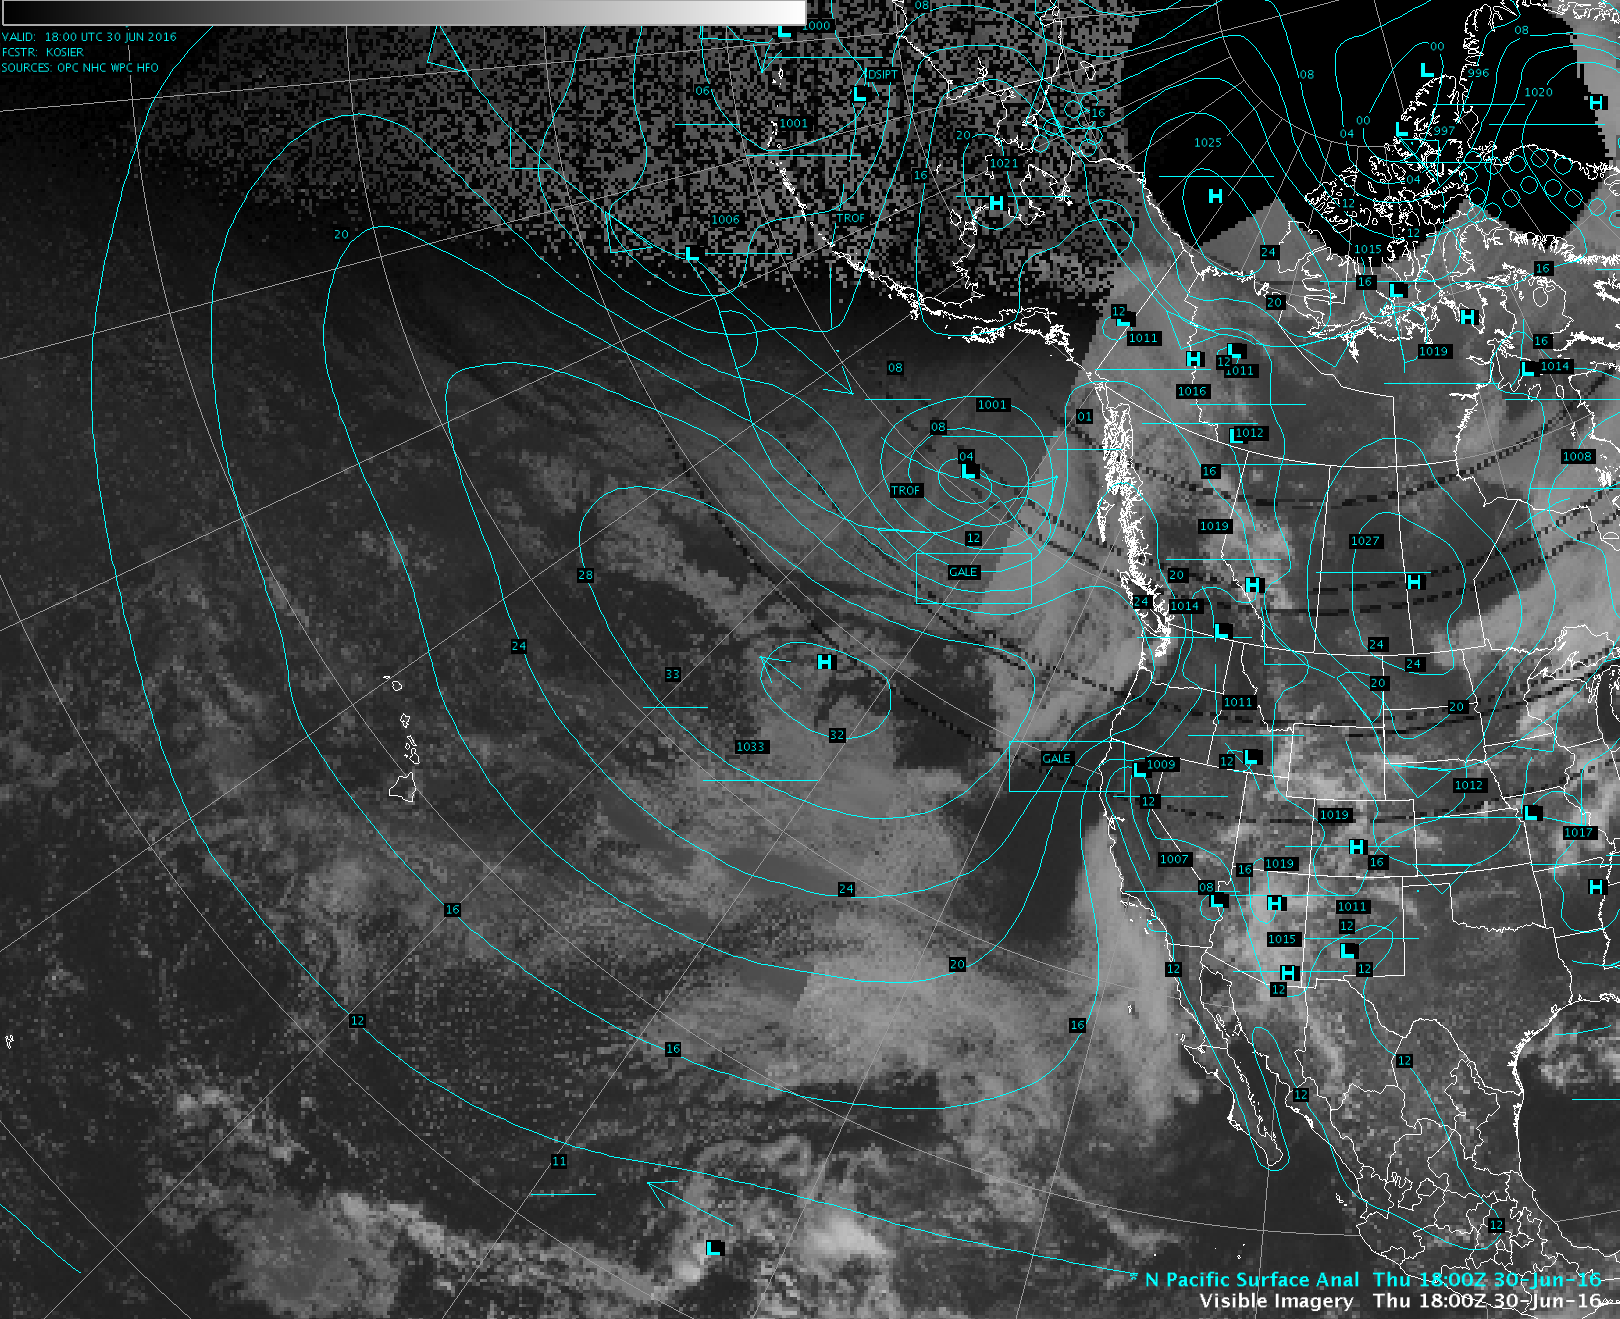
GOES-15 (GOES-West) Visible (0.63 µm) images (below) revealed a sharp contrast in cloudiness east of Hawai’i on 29 June, with far fewer and much smaller marine boundary layer cloud elements seen in the dry air east of the leading edge of the trade wind surge.
![GOES-15 Visible (0.63 µm) images [click to play animation]](https://cimss.ssec.wisc.edu/satellite-blog/wp-content/uploads/sites/5/2016/06/960x1280_WESTL_B1_GOES15_VIS_HI_29JUNE2016_2016181_210000_0001PANEL.GIF)
GOES-15 Visible (0.63 µm) images [click to play animation]
On the following day (30 June), GOES-15 Visible (0.63 µm) images
(below) showed a vast expanse of small closed-cell convective clouds in the marine boundary layer — a signature of a
stable air mass; in this case, due to strong low-level subsidence — extending to distances as far as 1000 miles east and northeast of Hawai’i.
![GOES-15 Visible (0.63 µm) images [click to play animation]](https://cimss.ssec.wisc.edu/satellite-blog/wp-content/uploads/sites/5/2016/06/960x1280_WESTL_B1_GOES15_VIS_HI_30JUNE2016_2016182_210000_0001PANEL.GIF)
GOES-15 Visible (0.63 µm) images [click to play animation]
The progression of the leading edge of the dry trade wind surge could also be followed on daily composites of Suomi NPP VIIRS true-color Red/Green/Blue (RGB) images from 26-30 June, as viewed using
RealEarth (below).
![Suomi NPP VIIRS true-color composite images [click to play animation]](https://cimss.ssec.wisc.edu/satellite-blog/wp-content/uploads/sites/5/2016/06/160626_viirs_truecolor_HI.jpg)
Suomi NPP VIIRS true-color composite images [click to play animation]
Skew-T diagrams of rawinsonde data from the 2 upper air sites in Hawai’i (
Hilo PHTO, and Lihue PHLI) are shown below. At Hilo on the Big Island of Hawai’i, the height of the trade wind temperature inversion descended from the typical height of 5500-6000 feet (near the 850 hPa pressure level) on 30 June to an unusually-low height of around 2500 feet (near the 930 hPa pressure level) at 12 UTC on 01 July. Farther to the west at Lihue on the island of Kaua’i, the dry trade wind surge was just beginning to arrive around the time of the 12 UTC sounding on 01 July — a sharpening of and a slight lowering of the trade wind inversion could be seen in comparison to the earlier 00 UTC sounding.
![Hilo, Hawai'i rawinsonde reports [click to enlarge]](https://cimss.ssec.wisc.edu/satellite-blog/wp-content/uploads/sites/5/2016/07/160630-160701_Hilo_HI_rawinsonde_reports_anim.gif)
Hilo, Hawai’i rawinsonde reports [click to enlarge]
![Lihue, Hawai'i rawinsonde data [click to enlarge]](https://cimss.ssec.wisc.edu/satellite-blog/wp-content/uploads/sites/5/2016/07/160701_00Z_12Z_PHLI_RAOB.GIF)
Lihue, Hawai’i rawinsonde data [click to enlarge]
As the strong trade wind flow interacted with the terrain of the islands, areas of high wind gusts were observed — for example, 36 knots (41 mph) at Bradshaw Army Air Field on the Big Island of Hawai’i. In addition, the dew point temperature at that site was as low as 21º F within an hour after that peak wind gust on the afternoon of 01 July.
View only this post
Read Less
![GOES-13 Visible (0.63 µm) images [click to play animation]](https://cimss.ssec.wisc.edu/satellite-blog/wp-content/uploads/sites/5/2016/07/960x1280_AGOES13_CONUS_B1_ICE_LOOP_VIS_animated_2016184_100000_180_2016184_220000_180_EB_ICE.gif)
![Terra MODIS true-color and false-color images [click to enlarge]](https://cimss.ssec.wisc.edu/satellite-blog/wp-content/uploads/sites/5/2016/07/160702_1508utc_terra_modis_truecolor_falsecolor_Labrador_sea_ice_anim.gif)
![Terra MODIS Visible (0.65 µm) and False-color images [click to enlarge]](https://cimss.ssec.wisc.edu/satellite-blog/wp-content/uploads/sites/5/2016/07/160702_1508utc_terra_modis_rgb_Labrador_ice_anim.gif)
![Ice Concentration and Ice Stage maps for 04 July [click to enlarge]](https://cimss.ssec.wisc.edu/satellite-blog/wp-content/uploads/sites/5/2016/07/160704_ice_concentration_stage_anim.gif)
![Ice concentration Departure From Normal [click to enlarge]](https://cimss.ssec.wisc.edu/satellite-blog/wp-content/uploads/sites/5/2016/07/160704_ice_departure_from_normal.gif)
![MIMIC Total Precipitable Water product [click to play animation]](https://cimss.ssec.wisc.edu/satellite-blog/wp-content/uploads/sites/5/2016/07/160628-160701_mimic_tpw_Hawaii_dry_trades_anim.gif)
![GOES-15 Visible (0.63 µm) images [click to play animation]](https://cimss.ssec.wisc.edu/satellite-blog/wp-content/uploads/sites/5/2016/06/160629_goes15_visible_HI_dry_surge_anim.gif)
![GOES-15 Visible (0.63 µm) images [click to play animation]](https://cimss.ssec.wisc.edu/satellite-blog/wp-content/uploads/sites/5/2016/06/160630_goes15_visible_Hawaii_dry_surge_anim.gif)
![Suomi NPP VIIRS true-color composite images [click to play animation]](https://cimss.ssec.wisc.edu/satellite-blog/wp-content/uploads/sites/5/2016/06/160626-30_suomi_npp_viirs_truecolor_HI_dry_trade_wind_surge_anim.gif)
![Terra MODIS false-color images from 25 May and 26 June 2016 [click to enlarge]](https://cimss.ssec.wisc.edu/satellite-blog/wp-content/uploads/sites/5/2016/06/160525_160626_terra_modis_falsecolor_MA_CT_RI_anim.gif)
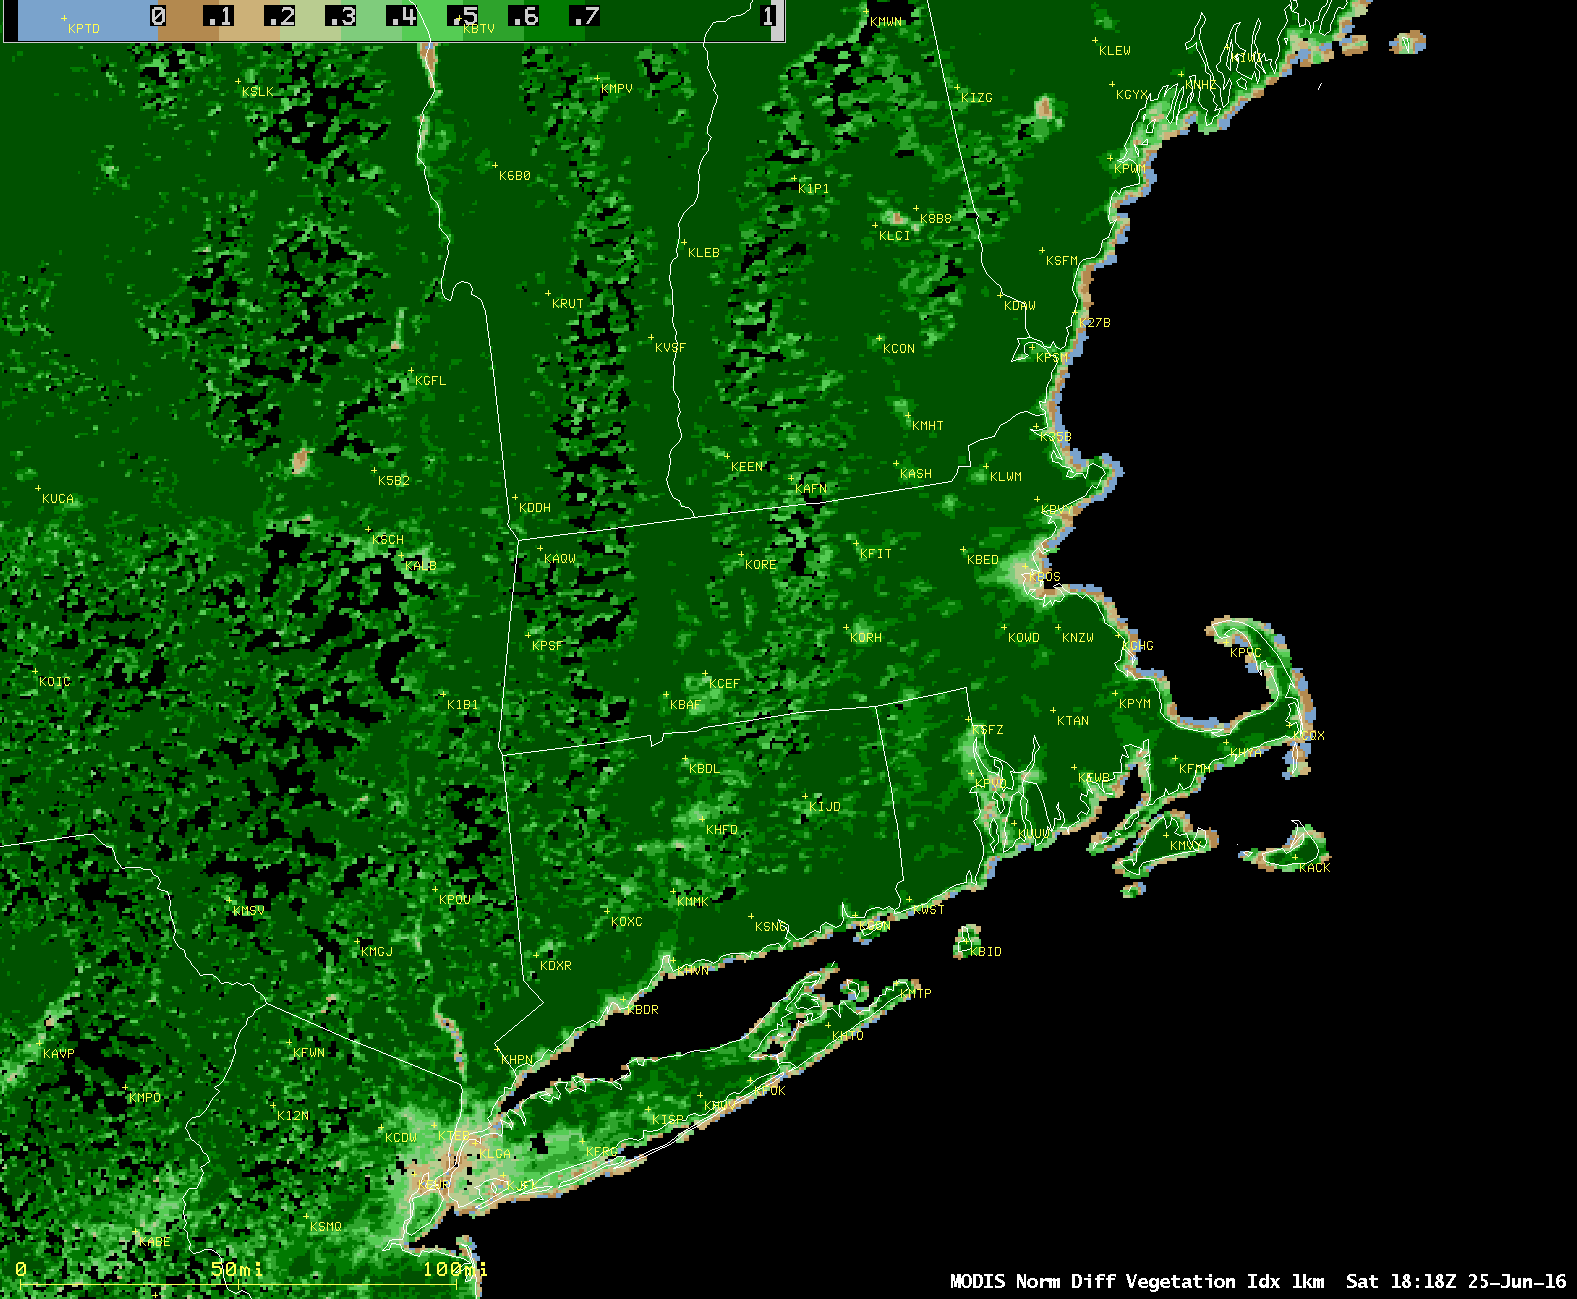
![Aqua MODIS Normalized Difference Vegetation Index (NDVI) product [click to enlarge]](https://cimss.ssec.wisc.edu/satellite-blog/wp-content/uploads/sites/5/2016/06/MODIS_NDVI_20160625_1818.png)
![Himawari-8 0.64 µm Visible (top) and 10.4 µm Infrared Window (bottom) images [click to play animation]](https://cimss.ssec.wisc.edu/satellite-blog/wp-content/uploads/sites/5/2016/06/160623_himawari8_visible_infrared_Yancheng_China_tornado_anim.gif)
![MIMIC Total Precipitable Water product [click to play animation]](https://cimss.ssec.wisc.edu/satellite-blog/wp-content/uploads/sites/5/2016/06/160621-23_mimic_tpw2_anim.gif)
![Nanjing, China rawinsonde report [click to enlarge]](https://cimss.ssec.wisc.edu/satellite-blog/wp-content/uploads/sites/5/2016/06/160623_00Z_ZSNJ_RAOB.GIF)
