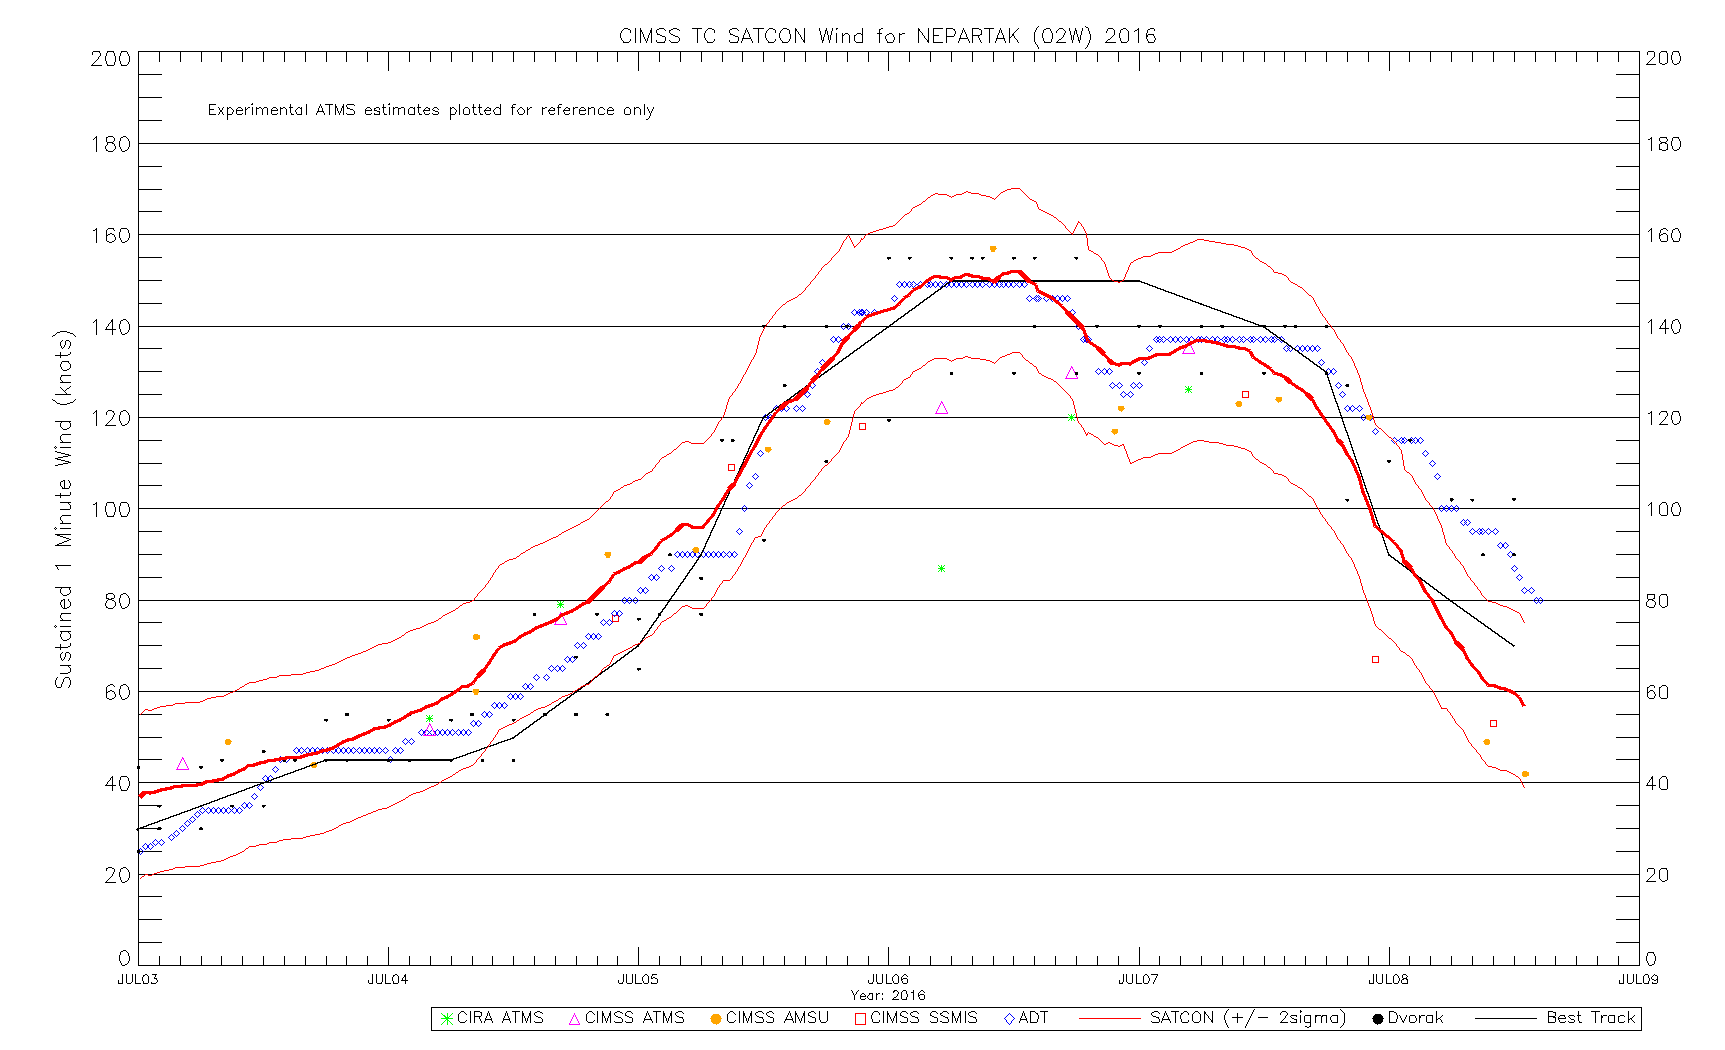
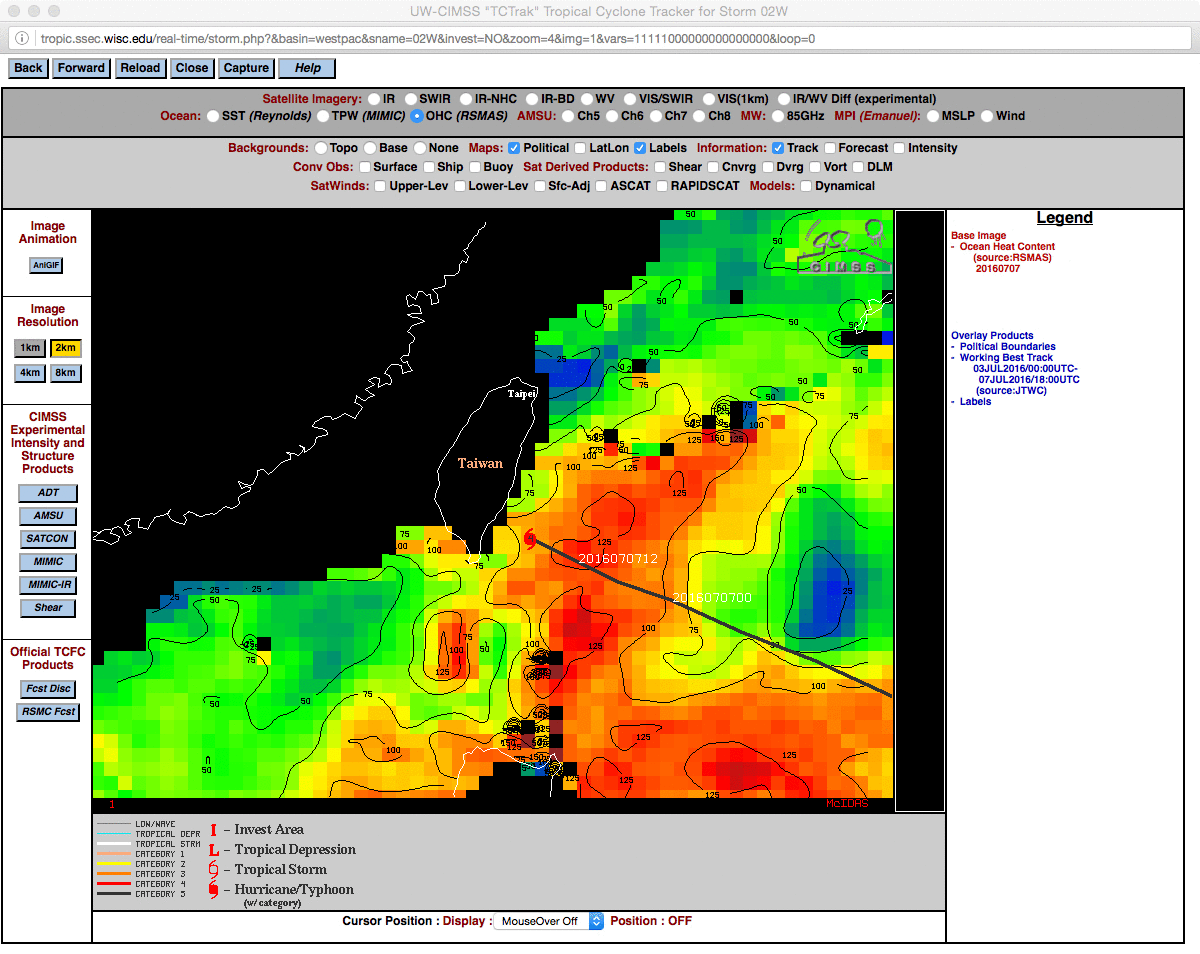
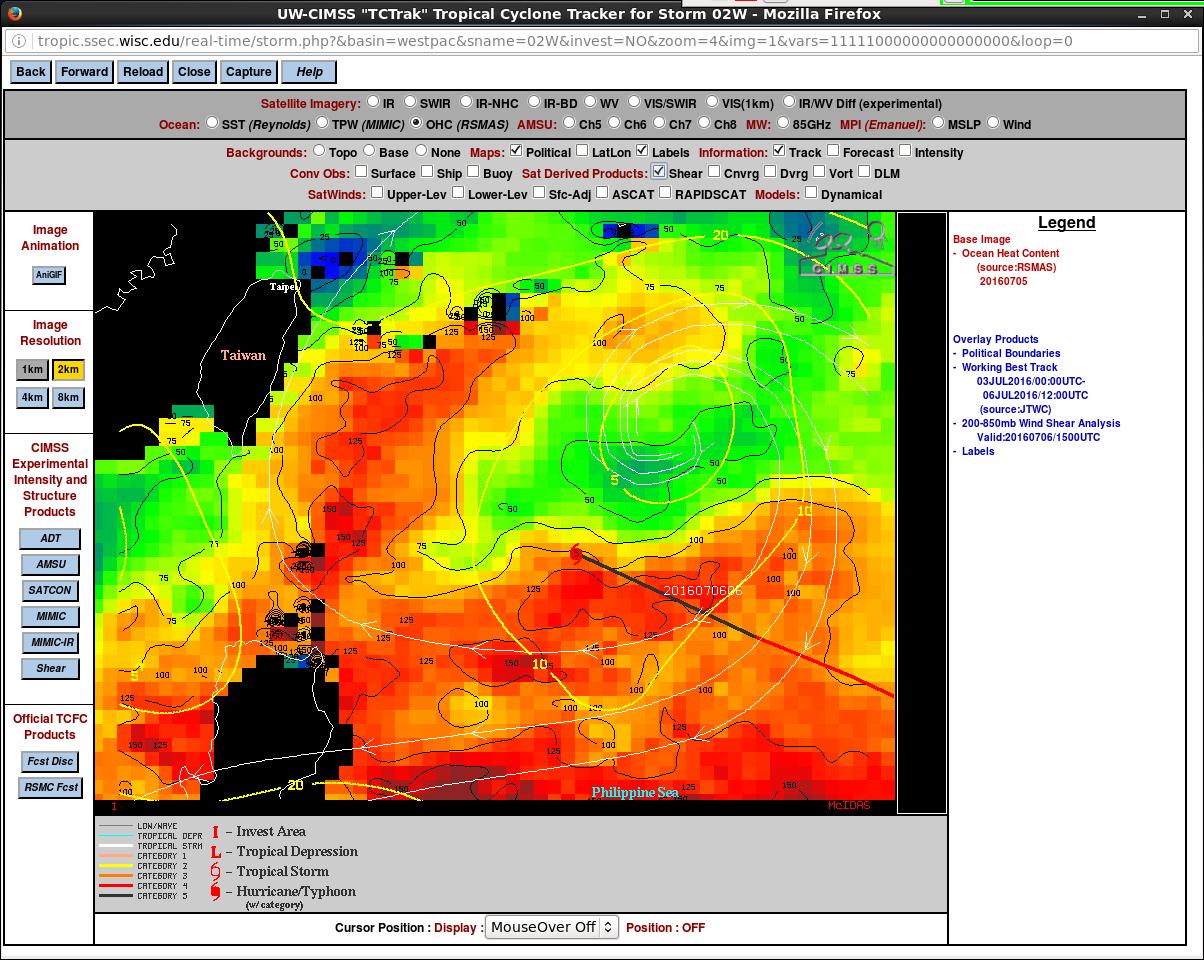
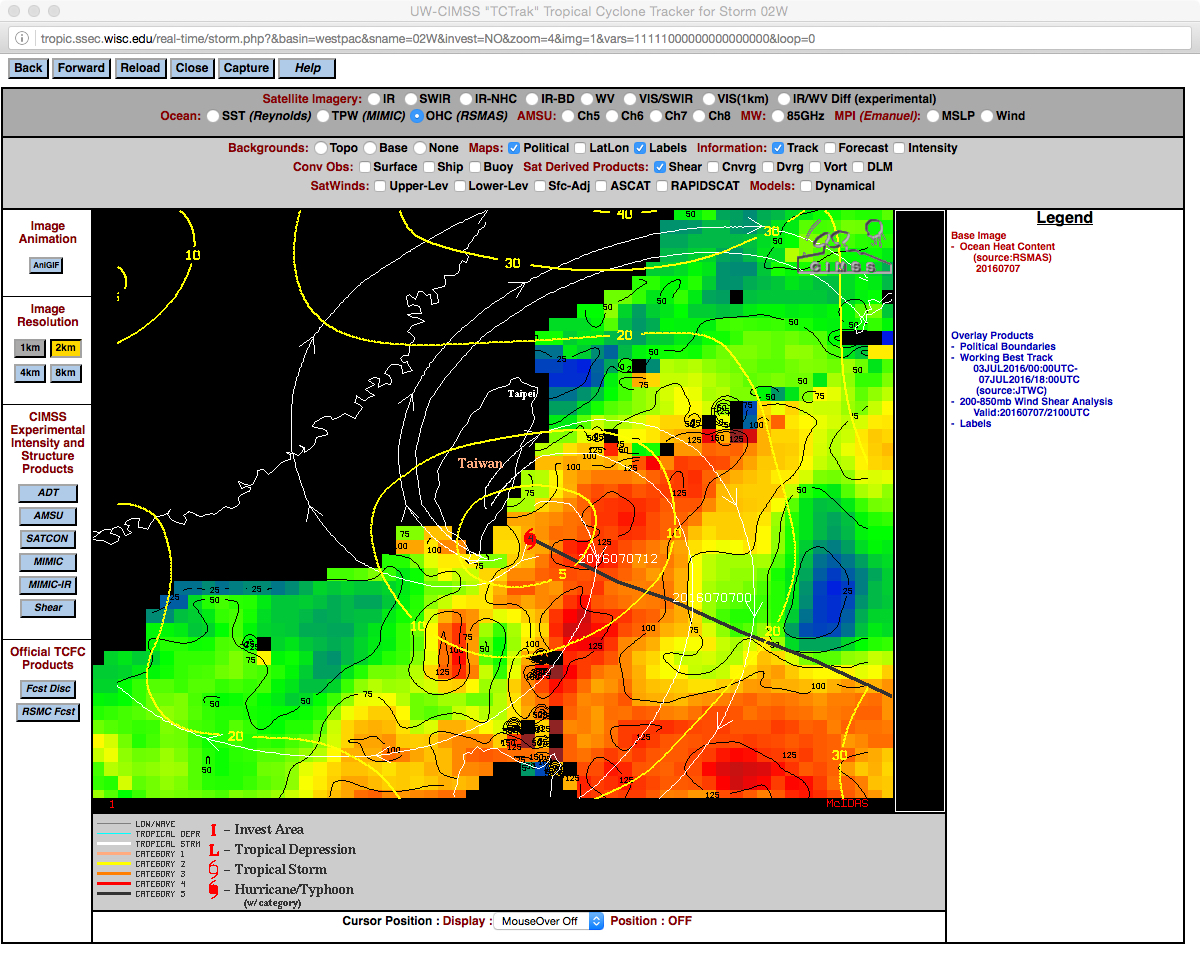
Super Typhoon Nepartak (02W) formed as a tropical depression in the West Pacific Ocean south of Guam on 02-03 July 2016, and tracked northwestward until making landfall in southern Taiwan on 07 July (above). Nepartak rapidly intensified to a Category 4 storm on 05 July, peaking at Category 5 intensity on... Read More
![Track of Super Typhoon Nepartak (03 to 07 July 2016) [click to enlarge]](https://cimss.ssec.wisc.edu/satellite-blog/wp-content/uploads/sites/5/2016/07/160703-07_Super_Typhoon_Nepartak_track.jpg)
Track of Super Typhoon Nepartak (03 to 07 July 2016) [click to enlarge]
Super Typhoon
Nepartak (02W) formed as a tropical depression in the West Pacific Ocean south of Guam on 02-03 July 2016, and tracked northwestward until making landfall in southern Taiwan on 07 July
(above). Nepartak rapidly intensified to a
Category 4 storm on 05 July, peaking at Category 5 intensity on 06 July (
ADT |
SATCON wind |
SATCON pressure). Two factors helping the storm to reach and maintain Category 5 intensity for a relatively long period of time were (1) the passage over water having large
Ocean Heat Content and Sea Surface Temperature values, and (2) an environment characterized by low deep-layer wind shear (
06 July/15 UTC |
07 July/21 UTC).
![Himawari-8 Visible (0.64 µm) images [click to play MP4 animation]](https://cimss.ssec.wisc.edu/satellite-blog/wp-content/uploads/sites/5/2016/07/NEPARTAK_VIS_DEFAULT_960x1280_B3_00060_2016189_022940_0001PANEL.GIF)
Himawari-8 Visible (0.64 µm) images [click to play MP4 animation]
2.5-minute interval rapid-scan Himawari-8 Visible (0.64 µm) images
(above) and Infrared Window (10.4 µm) images
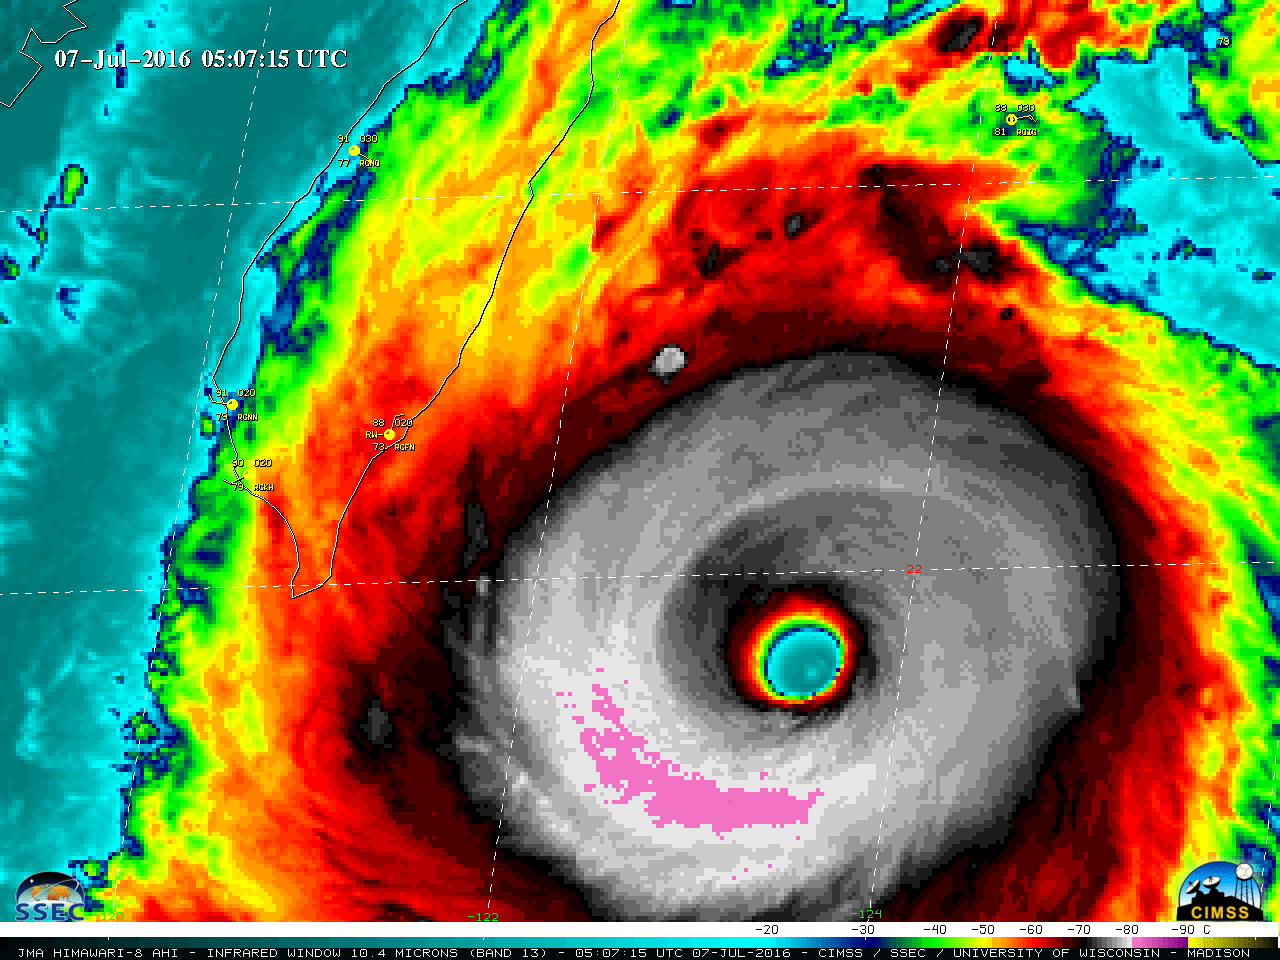
(below) showed the formation of a well-defined eye with an annular storm structure early in the day on 07 July. The eye became less organized as Nepartak approached the island of Taiwan and made landfall as a Category 4 typhoon around 2150 UTC.
![Himawari-8 Infrared Window (10.4 µm) images [click to play MP4 animation]](https://cimss.ssec.wisc.edu/satellite-blog/wp-content/uploads/sites/5/2016/07/960x1280_H8F_B13_HIM08_IR_NEPARTAK_07JUL2016_2016189_050715_0001PANEL.GIF)
Himawari-8 Infrared Window (10.4 µm) images [click to play MP4 animation]
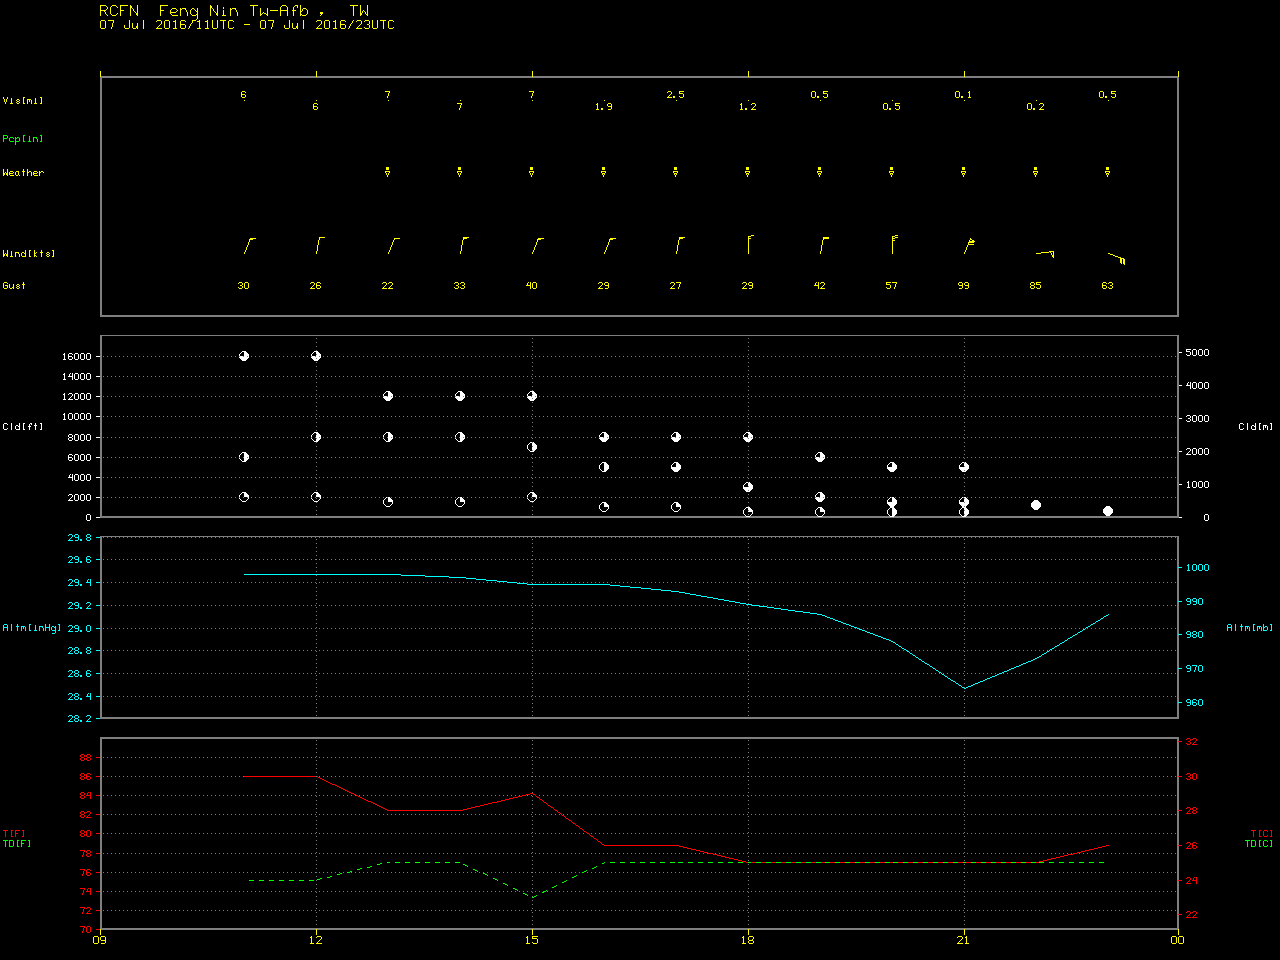
Surface observations (
plot |
text) from Feng Nin airport (station identifier
RCFN) in Taitung City showed sustained winds of 70 knots (81 mph) with a gust to 99 knots (114 mph) from the north-northeast at 21 UTC, and a pressure of 964.0 hPa (27.47″). iCyclone chaser Josh Morgerman recorded a minimum pressure of 957.7 hPa at 2043 UTC (4:43 am local time) in Taitung City:
Shortly before landfall, a comparison of DMSP-18 SSMIS Microwave (85 GHz) and Himawari-8 Infrared Window (10.4 µm) images around 20 UTC (below) showed that the eye was still rather distinct on the microwave image.
![DMSP-16 SSMIS Microwave (85 GHz) and Himawari-8 Infrared Window (10.4 µm) images [click to enlarge]](https://cimss.ssec.wisc.edu/satellite-blog/wp-content/uploads/sites/5/2016/07/160707_20utc_dmsp16_ssmis_microwave_himawari8_infrared_anim.gif)
DMSP-16 SSMIS Microwave (85 GHz) and Himawari-8 Infrared Window (10.4 µm) images [click to enlarge]
However, the
MIMIC-TC product
(below) revealed how quickly the eyewall structure eroded once the circulation of Nepartak encountered the rugged terrain of Taiwan.
![MIMIC-TC product [click to enlarge]](https://cimss.ssec.wisc.edu/satellite-blog/wp-content/uploads/sites/5/2016/07/160707-08_mimic_Nepartak_landfall_anim.gif)
MIMIC-TC product [click to enlarge]
Looking back to earlier periods in the storm history, a 2-panel comparison of Himawari-8 Visible (0.64 µm) and Infrared Window (10.4 µm) images from 06-07 July
(below) revealed the presence of mesovortices within the eye on the visible imagery. The spatial resolution of these Visible (0.5 km) and Infrared (2 km)
AHI images is identical to what will be provided by the
ABI instrument on
GOES-R.
![Himawari-8 0.64 µm Visible (top) and 10.4 µm Infrared Window (bottom) images [click to play MP4 animation]](https://cimss.ssec.wisc.edu/satellite-blog/wp-content/uploads/sites/5/2016/07/480x1280_H8F_B313_HIM08_VIS_IR_NEPARTAK_06-07JUL2016_2016189_044715_0002PANELS.GIF)
Himawari-8 0.64 µm Visible (top) and 10.4 µm Infrared Window (bottom) images [click to play MP4 animation]
A Suomi NPP VIIRS true-color Red/Green/Blue (RGB) image from 07 July (viewed using
RealEarth) is shown below; the actual satellite overpass time for this image was around
0444 UTC.
![Suomi NPP VIIRS true-color image on 07 July [click to enlarge]](https://cimss.ssec.wisc.edu/satellite-blog/wp-content/uploads/sites/5/2016/07/160707_1445utc_suomi_npp_viirs_truecolor_metar_Nepartak_map_only_anim.gif)
Suomi NPP VIIRS true-color image on 07 July [click to enlarge]
During the period of rapid intensification on 06 July, 2.5-minute interval rapid-scan Himawari-8 Infrared Window (10.4 µm) images
(below) revealed pulses of storm-top gravity waves which were propagating radially outward away from the eye of Nepartak (especially evident during the later half of the animation period).
![Himawari-8 Infrared Window (10.4 µm) images [click to play MP4 animation]](https://cimss.ssec.wisc.edu/satellite-blog/wp-content/uploads/sites/5/2016/07/960x1280_H8F_B13_HIM08_IR_NEPARTAK_06JUL2016_2016188_151945_0001PANEL.GIF)
Himawari-8 Infrared Window (10.4 µm) images [click to play MP4 animation]
It is also interesting to note that nighttime mesospheric gravity waves could be seen propagating away from the eye/eyewall region of Nepartak at 1729 UTC or 1:29 am local time on a 06 July Suomi NPP VIIRS Day/Night Band (0.7 µm) image
(below, courtesy of William Straka, SSEC). Since very little illumination was provided by the Moon
(which was in the Waxing Crescent phase, at only 5% of Full), these waves were being illuminated by airglow.
![Suomi NPP VIIRS Infrared Window (11.45 µm) and Day/Night Band (0.7 µm) images [click to enlarge]](https://cimss.ssec.wisc.edu/satellite-blog/wp-content/uploads/sites/5/2016/07/160706_1729utc_suomi_npp_viirs_infrared_day_night_band_STY_Nepartak_anim.gif)
Suomi NPP VIIRS Infrared Window (11.45 µm) and Day/Night Band (0.7 µm) images [click to enlarge]
The MIMIC-TC product
(below) also showed that Nepartak completed an eyewall replacement cycle on 06 July.
![MIMIC-TC product [click to enlarge]](https://cimss.ssec.wisc.edu/satellite-blog/wp-content/uploads/sites/5/2016/07/160706_mimic_Nepartak_ERC_anim.gif)
MIMIC-TC product [click to enlarge]
Animations of 10-minute interval Himawari-8 Infrared Window (10.4 µm) images spanning nearly the entire life cycle of Nepartak — from a tropical depression south of Guam on 03 July to landfall over mainland China on 08 July — are available as an
MP4 movie (139 Mbytes) or an
animated GIF (493 Mbytes).
View only this post
Read Less
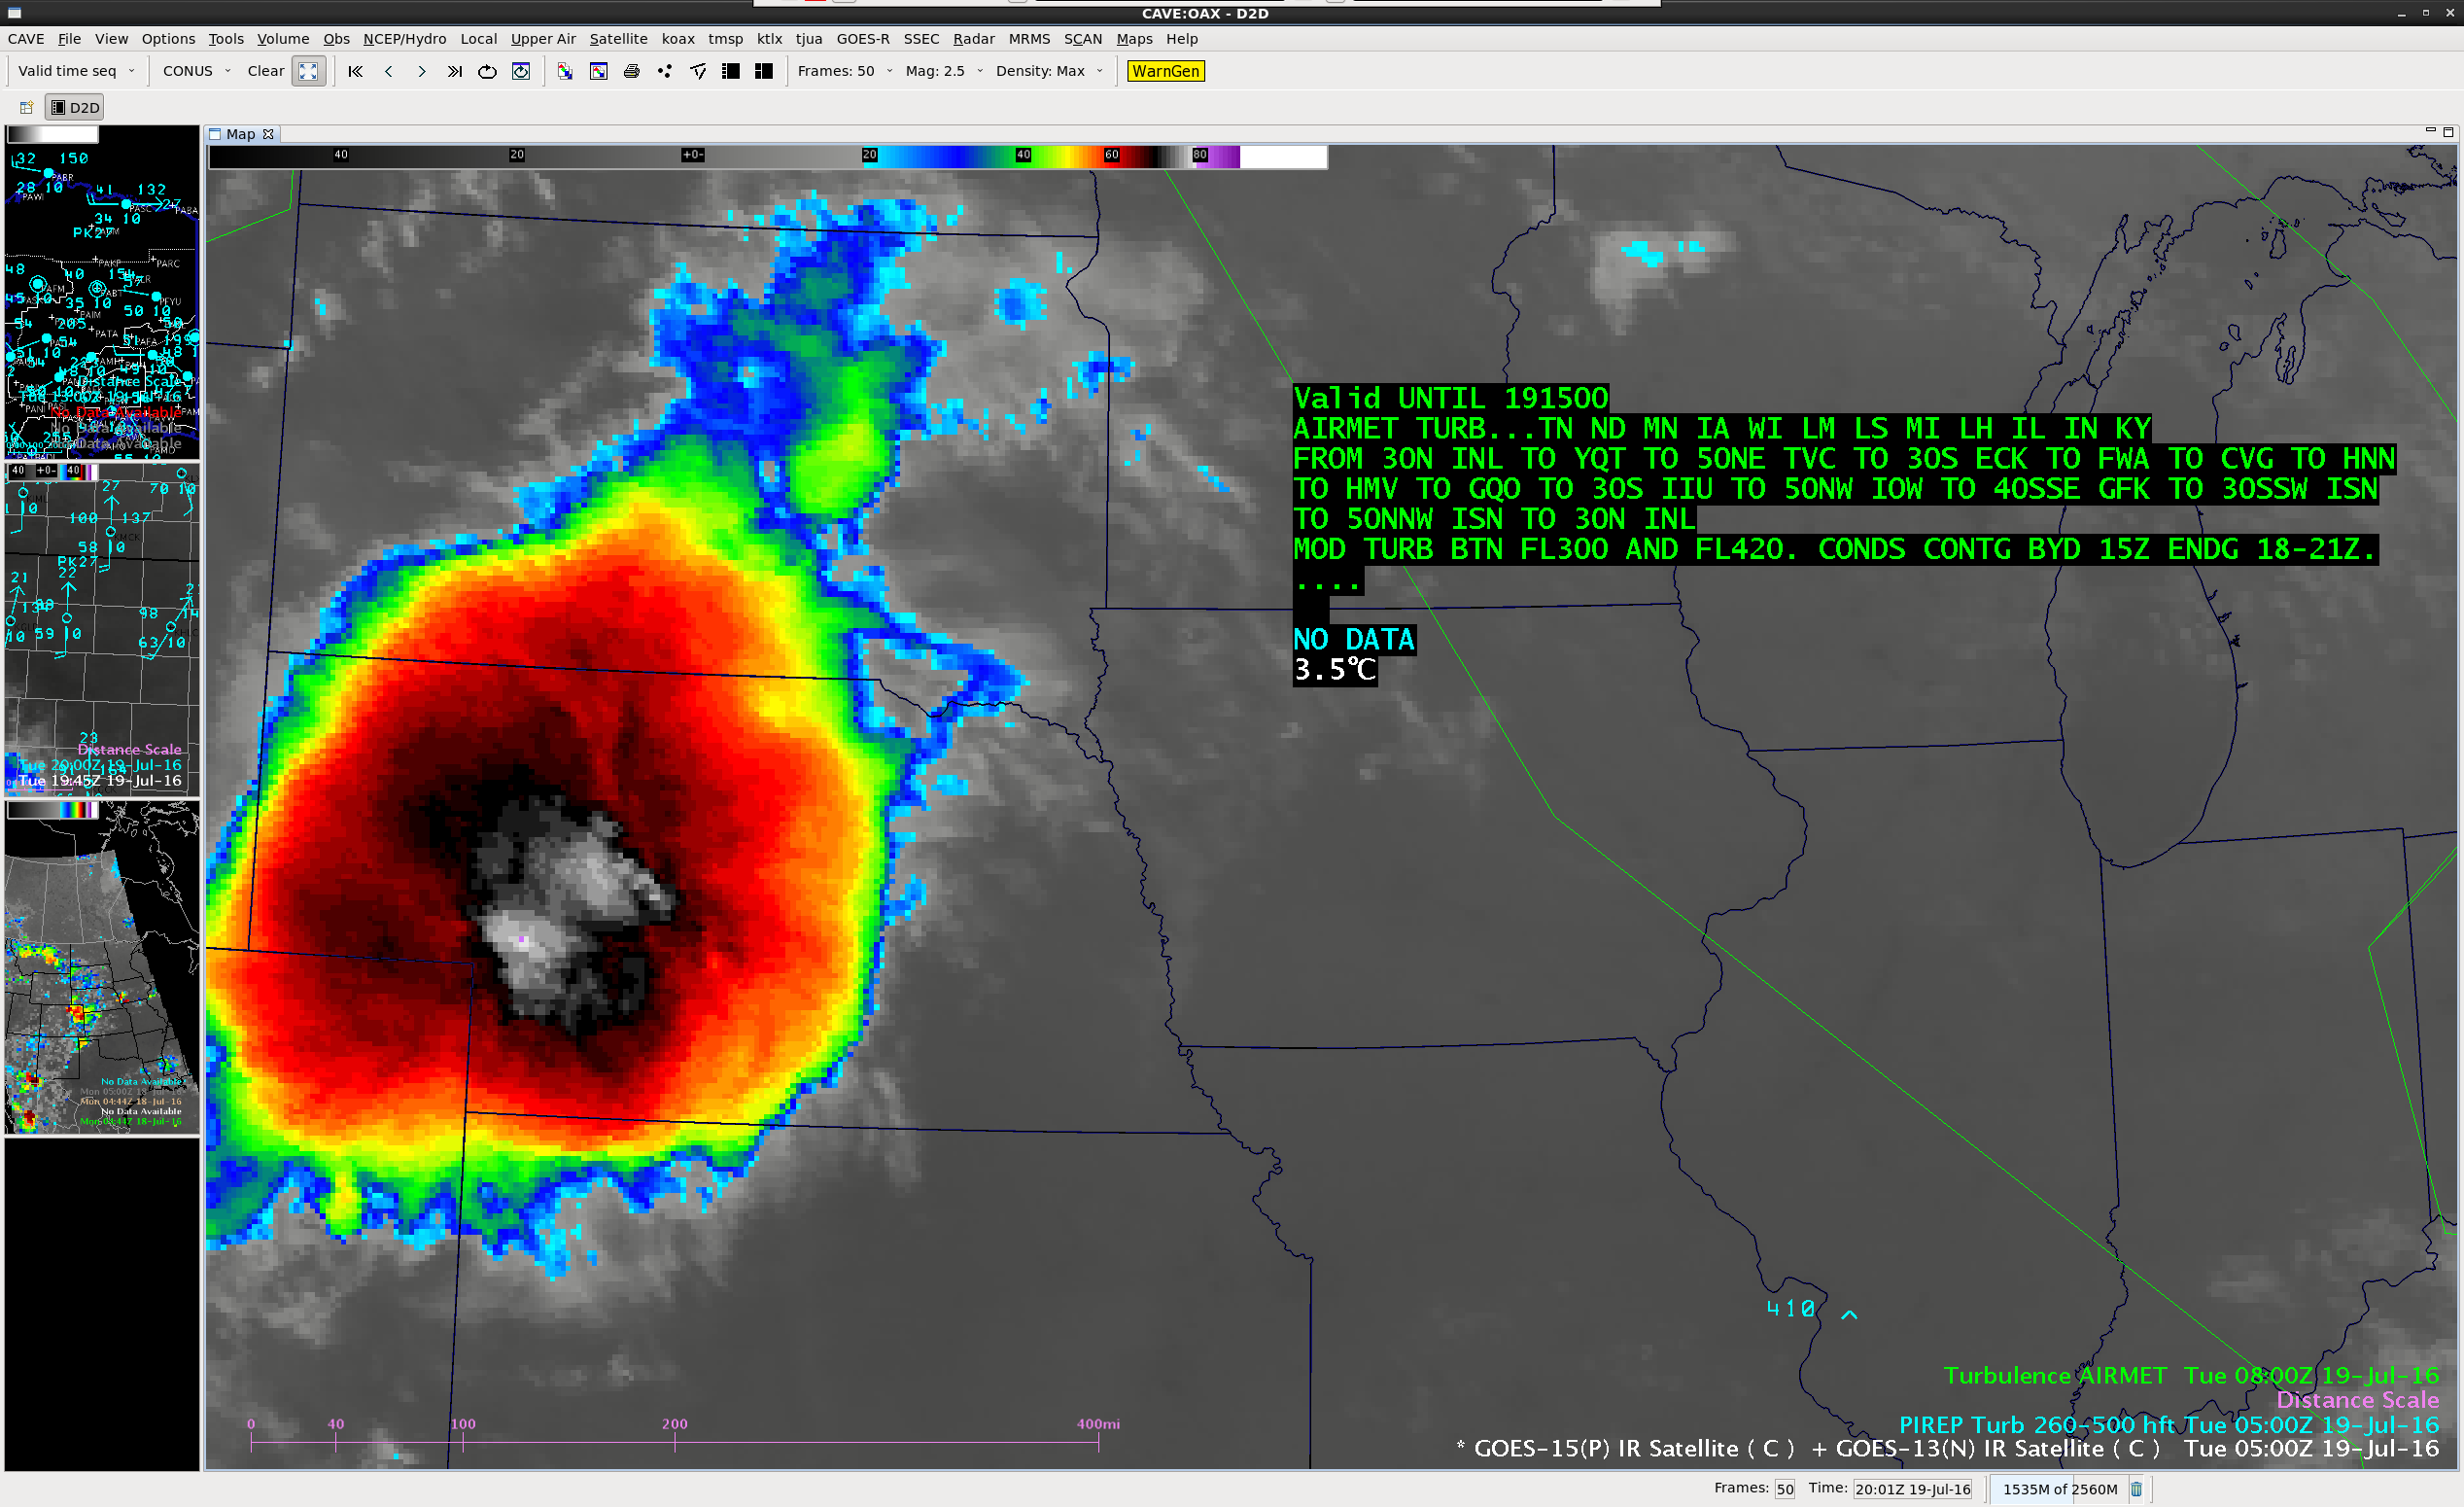
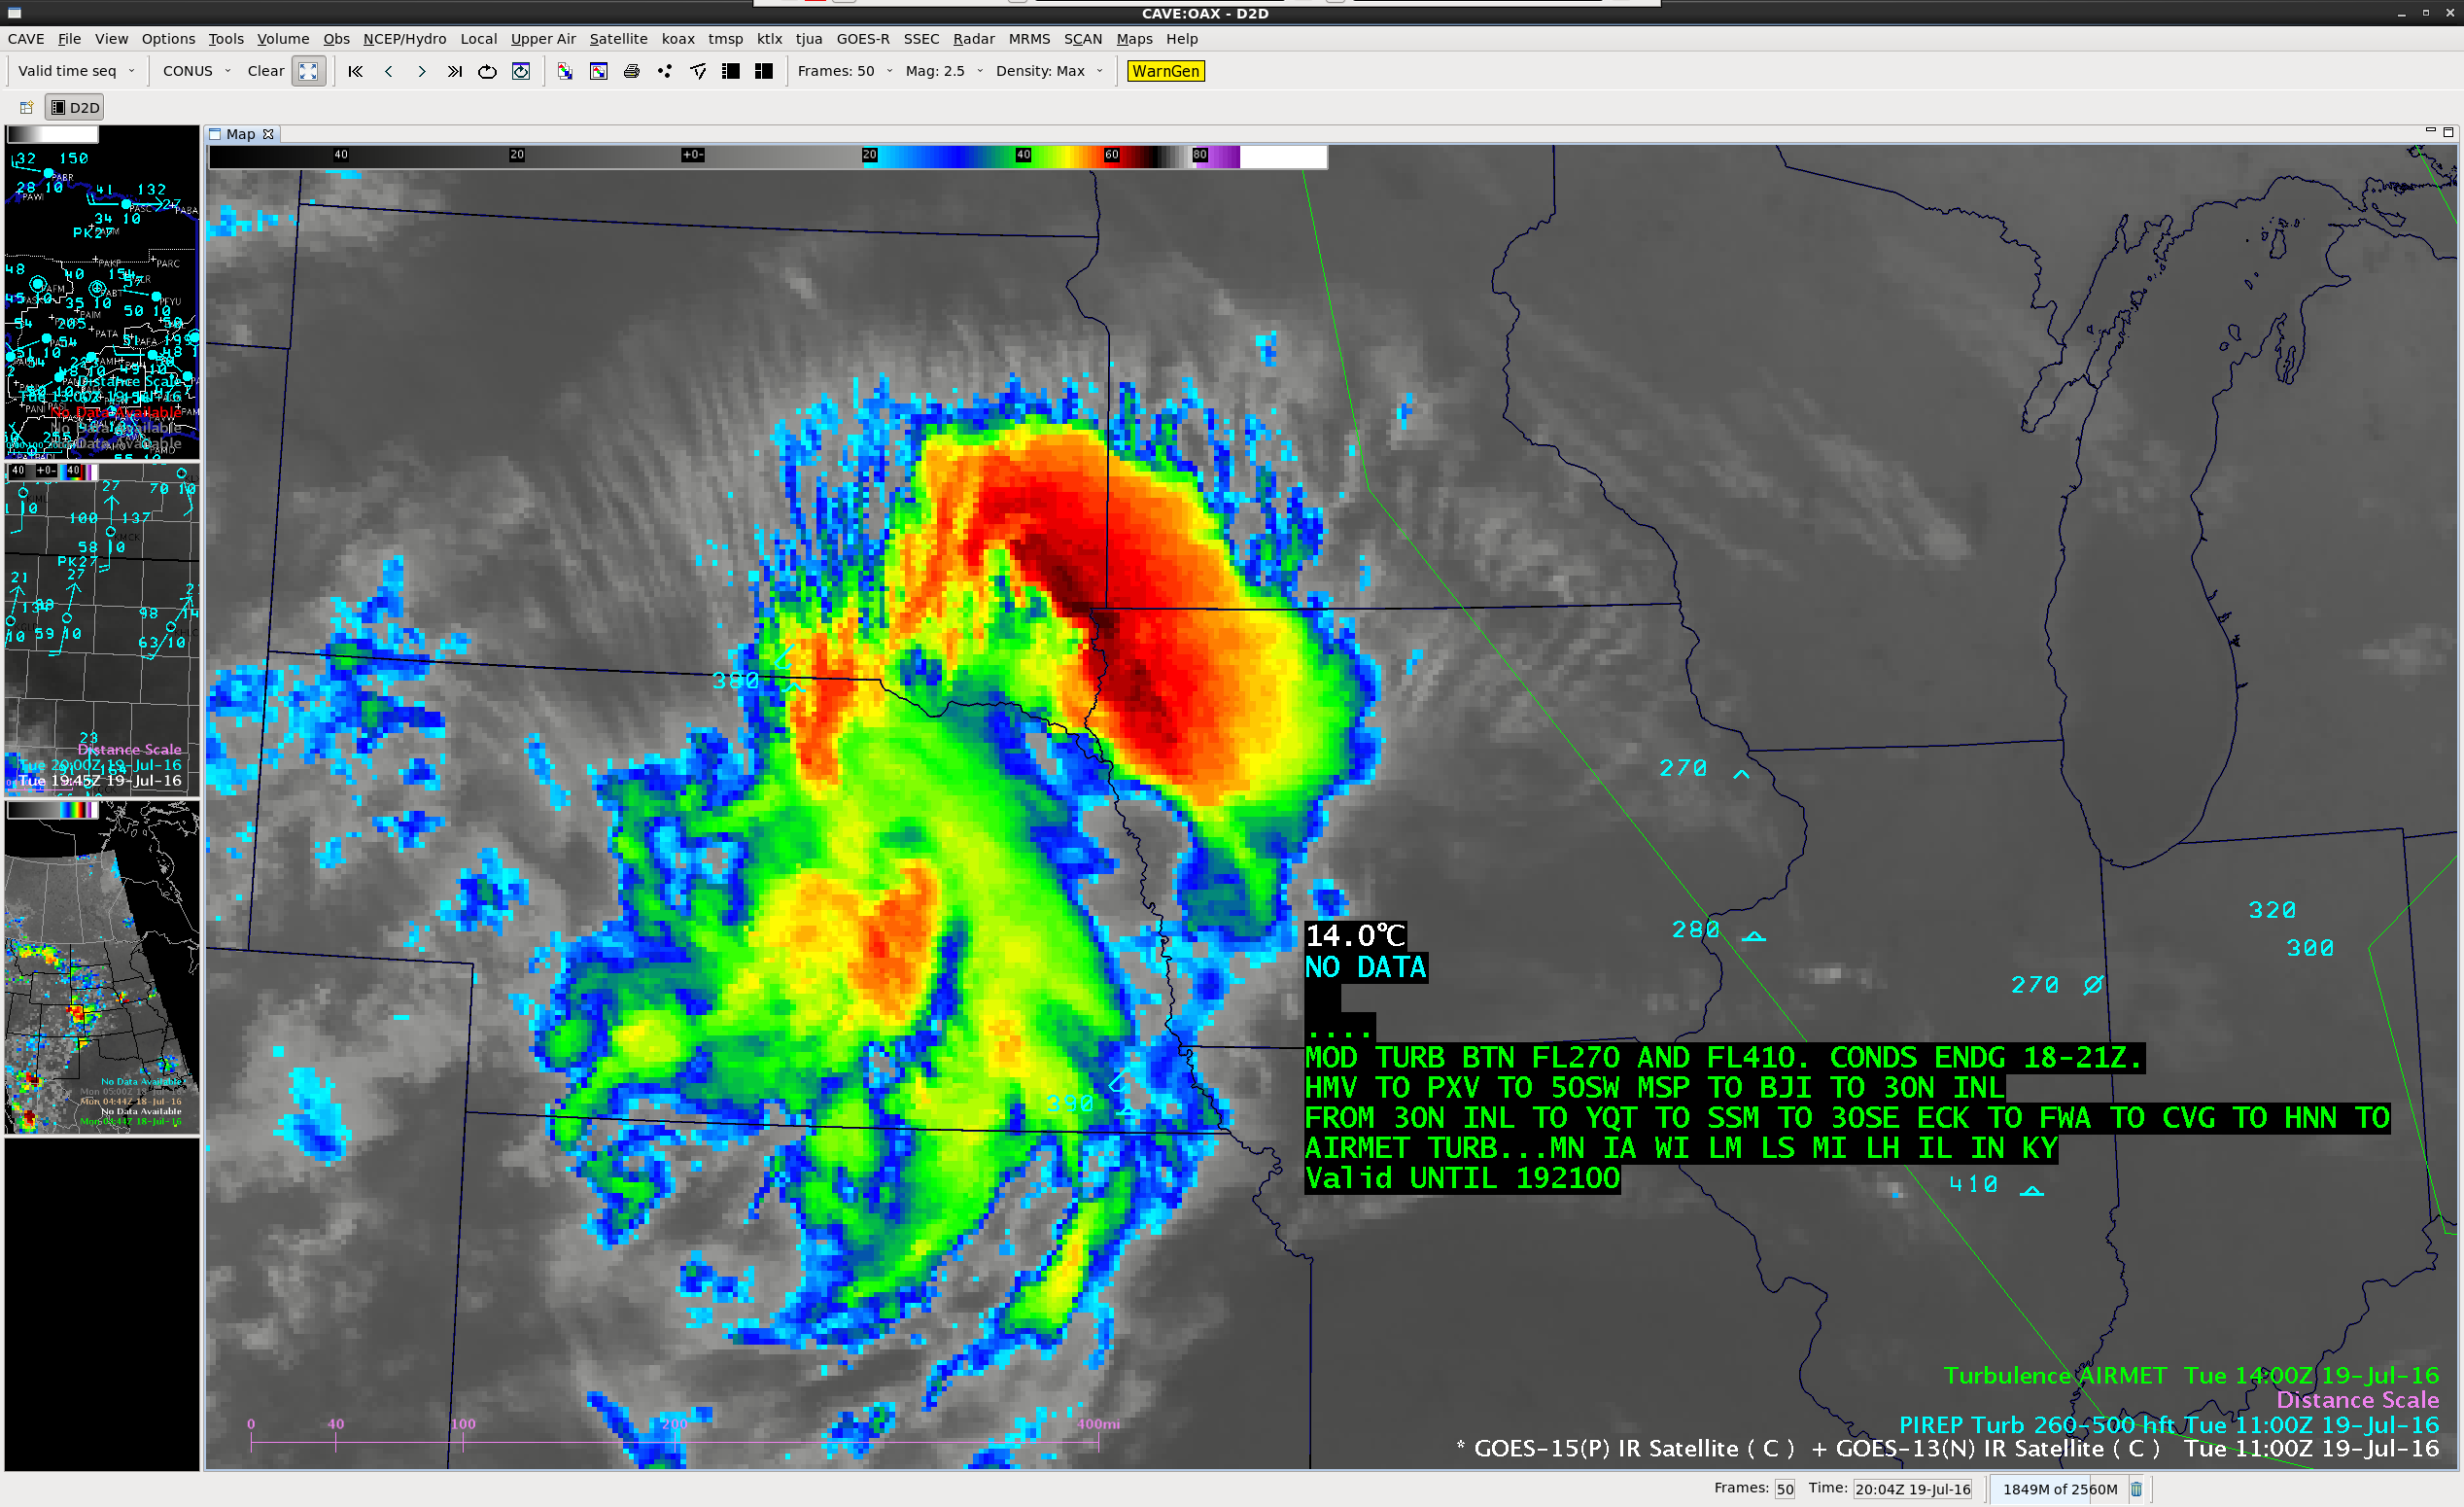
![GOES-13 Infrared Window (10.7 um) images, pilot reports of turbulence, Turbulence AIRMET boundaries [click to play animation]](https://cimss.ssec.wisc.edu/satellite-blog/wp-content/uploads/sites/5/2016/07/160719_goes13_ir_transverse_banding_pireps_anim.gif)
![GOES-13 Water Vapor (6.5 um) images, pilot reports of turbulence, Turbulence AIRMET boundaries [click to play animation]](https://cimss.ssec.wisc.edu/satellite-blog/wp-content/uploads/sites/5/2016/07/160719_goes13_wv_transverse_banding_pireps_anim.gif)
![Infrared Window images from POES AVHRR (10.8 µm) and Suomi NPP VIIRS (11.45 µm) [click to enlarge]](https://cimss.ssec.wisc.edu/satellite-blog/wp-content/uploads/sites/5/2016/07/160719_avhrr_modis_viirs_infrared_mcs_transverse_banding_anim.gif)
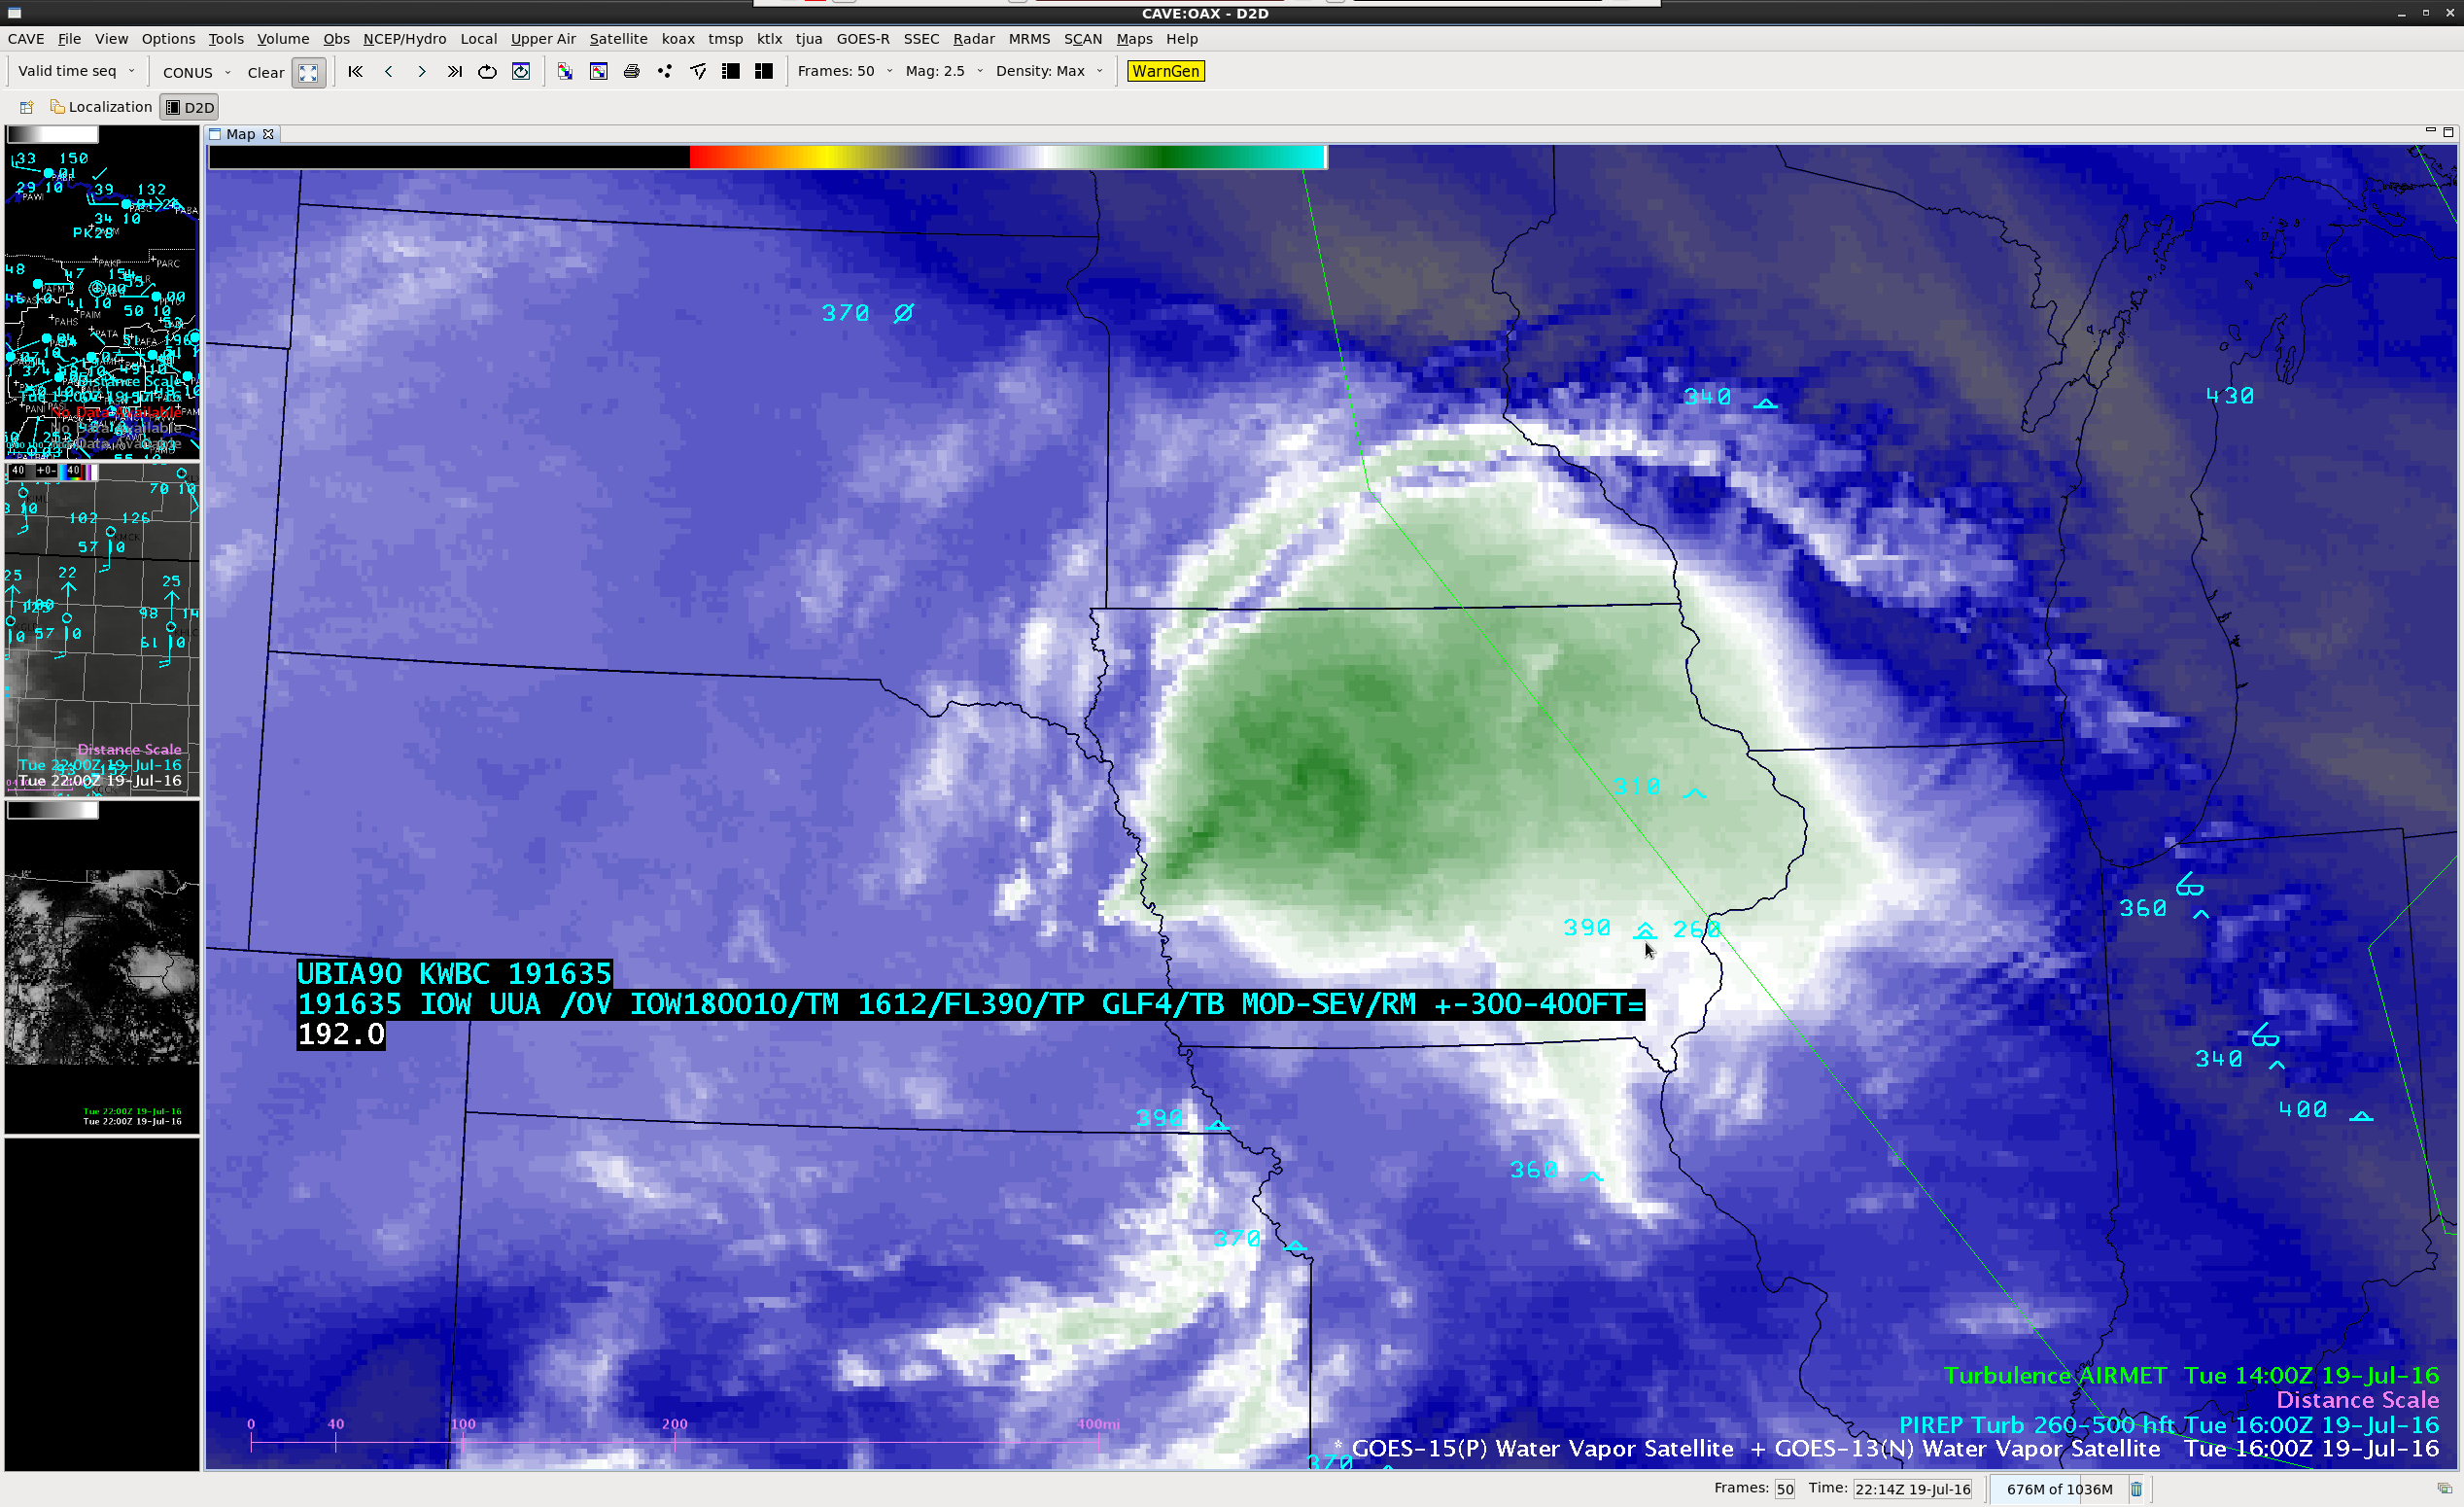
![Suomi NPP VIIRS Infrared Window (11.45 µm) and Day/Night Band (0.7 µm) images [click to enlarge]](https://cimss.ssec.wisc.edu/satellite-blog/wp-content/uploads/sites/5/2016/07/160719_0949utc_suomi_npp_viirs_NE_SD_mcs_transverse_banding_anim.gif)
![Terra MODIS Infrared Window (11.0 µm) and Cirrus (1.37 µm) images [click to enlarge]](https://cimss.ssec.wisc.edu/satellite-blog/wp-content/uploads/sites/5/2016/07/160719_1727utc_modis_infrared_cirrus_anim.gif)
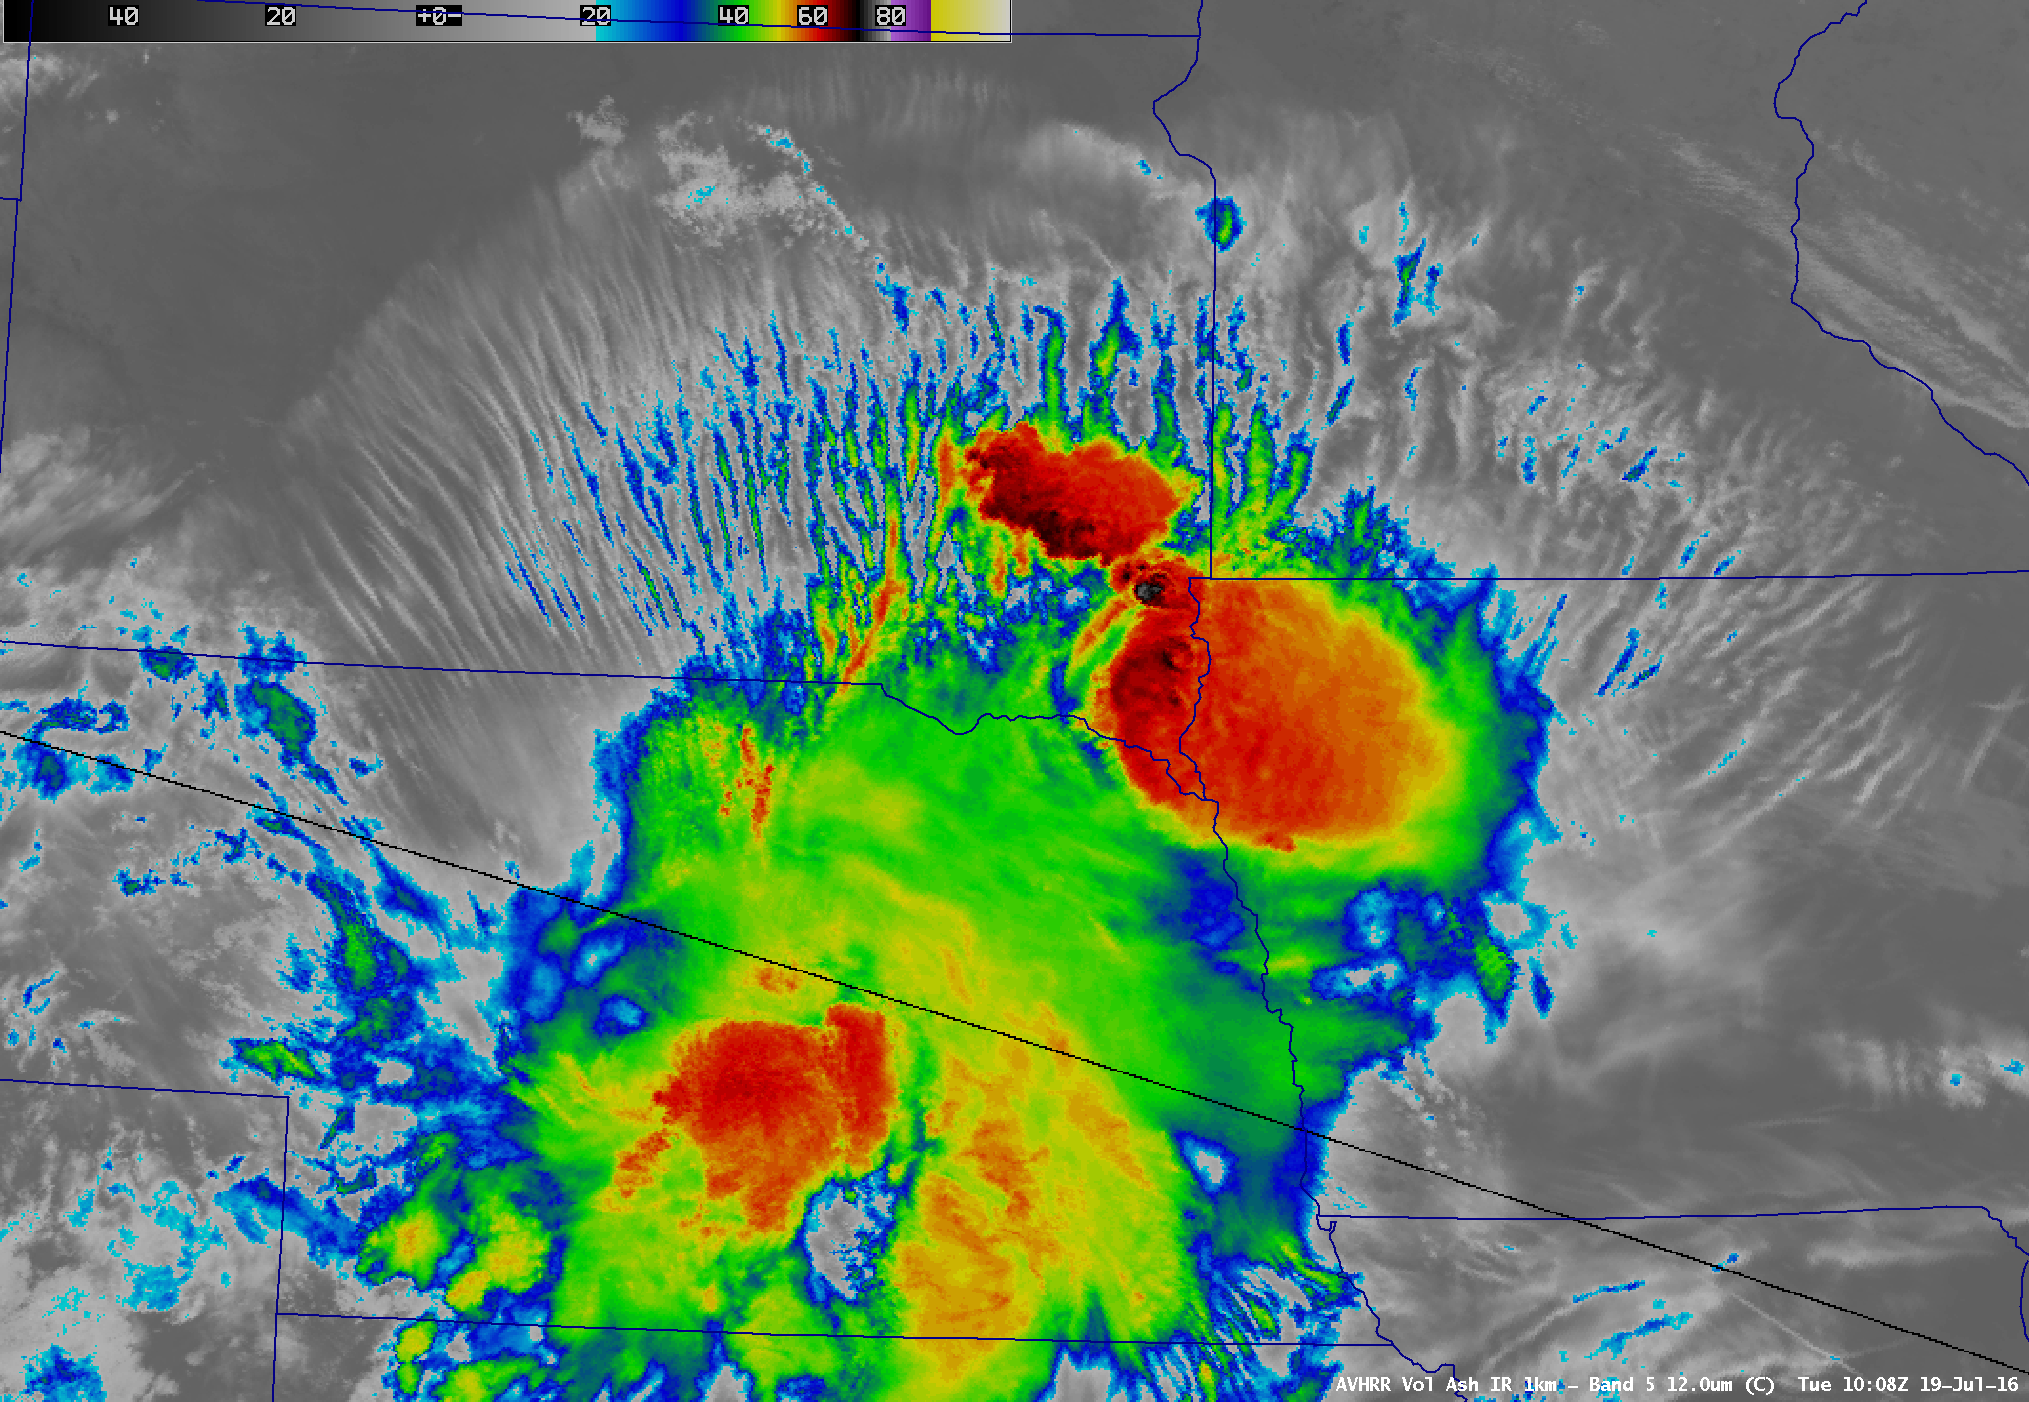
![GOES-13 Infrared Window (10.7 µm) images, with SPC storm reports [click to play animation]](https://cimss.ssec.wisc.edu/satellite-blog/wp-content/uploads/sites/5/2016/07/160711-12_goes13_infrared_spc_storm_reports_mcs_MN_WI_MI_anim.gif)
![Infrared images from Terra/Aqua MODIS (11.0 µm) and Suomi NPP VIIRS (11.45 µm) [click to play animation]](https://cimss.ssec.wisc.edu/satellite-blog/wp-content/uploads/sites/5/2016/07/160711-12_modis_viirs_infrared_Upper_Midwest_thunderstorms_anim.gif)
![Comparison of before (09 July) and after (12 July through 19 July) Suomi NPP VIIRS true-color images [click to enlarge]](https://cimss.ssec.wisc.edu/satellite-blog/wp-content/uploads/sites/5/2016/07/160709-19_suomi_npp_viirs_truecolor_Lake_Superior_sediment_anim.gif)
![Comparison of before (09 July) and after (13 through 19 July) Terra/Aqua MODIS true-color images [click to enlarge]](https://cimss.ssec.wisc.edu/satellite-blog/wp-content/uploads/sites/5/2016/07/160709-19_terra_aqua_modis_truecolor_Lake_Superior_sediment_anim.gif)
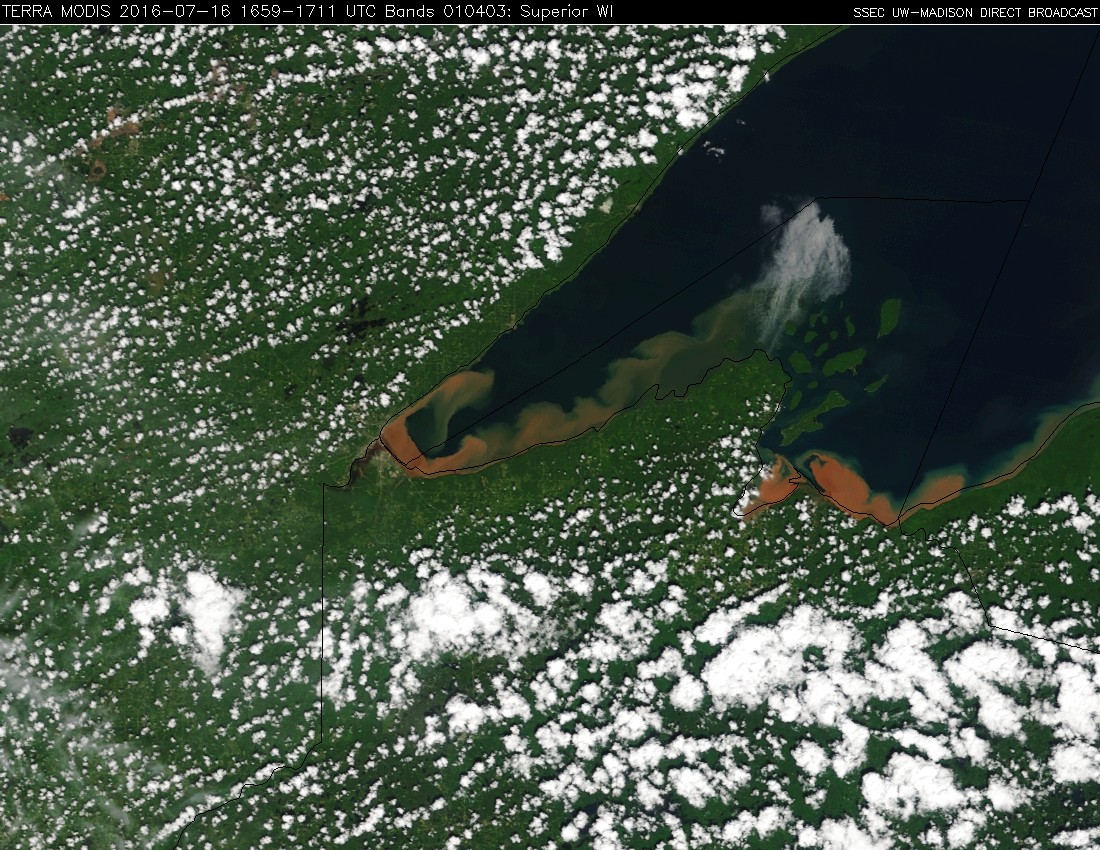
![Terra MODIS Visible (0.65 µm) image and Sea Surface Temperature product [click to enlarge]](https://cimss.ssec.wisc.edu/satellite-blog/wp-content/uploads/sites/5/2016/07/160716_1656utc_terra_modis_visible_sst_Lake_Superior_anim.gif)
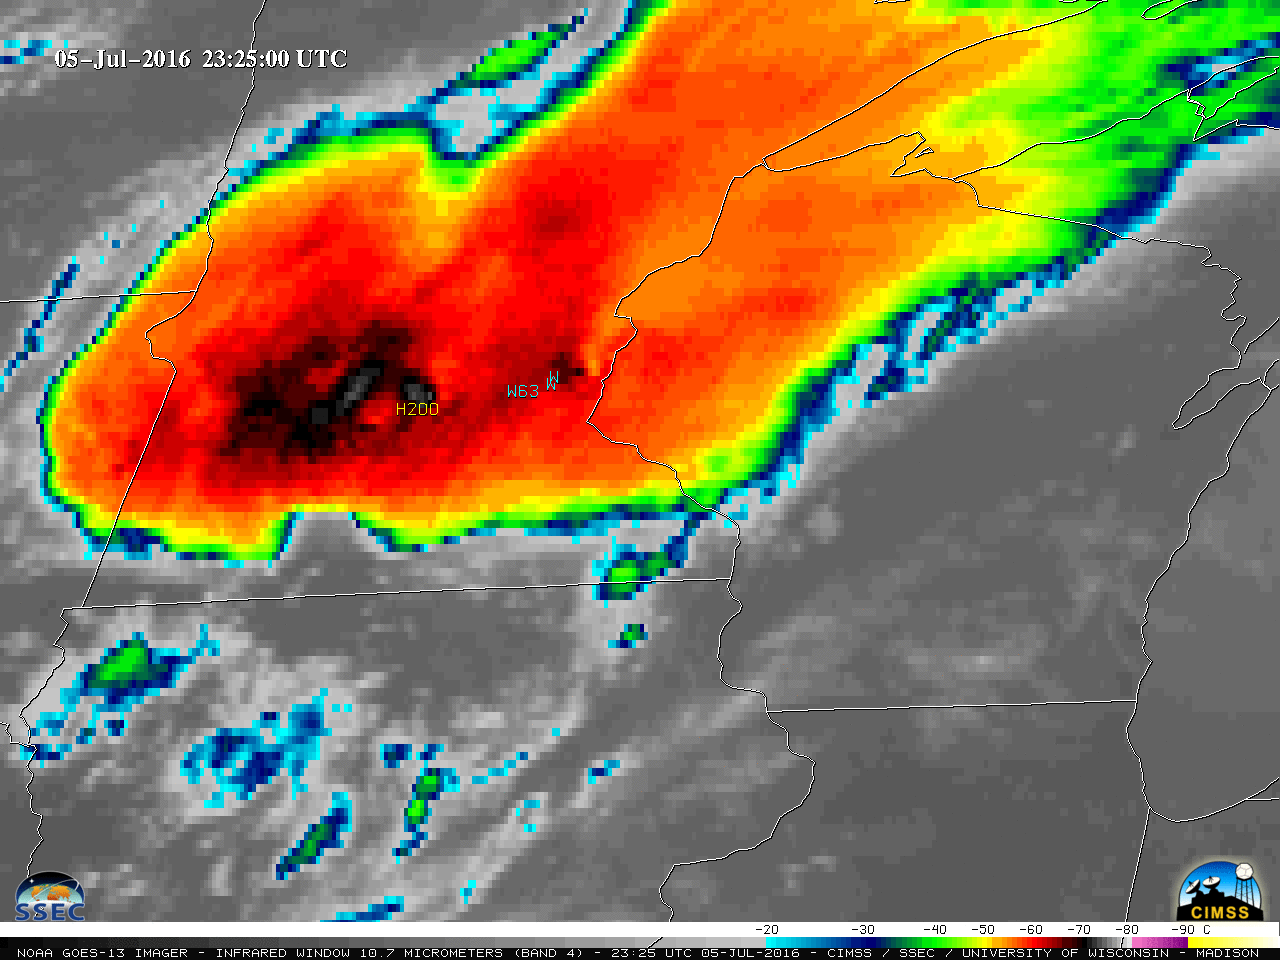
![GOES-13 Infrared Window (10.7 um) images, with SPC storm reports [click to play animation]](https://cimss.ssec.wisc.edu/satellite-blog/wp-content/uploads/sites/5/2016/07/160705-06_goes13_infrared_spc_storm_reports_Upper_Midwest_MCS_anim.gif)
![Infrared MODIS (11.0 um), AVHRR (12.0 um) and VIIRS (11.45 um) images, with SPC storm reports [click to play animation]](https://cimss.ssec.wisc.edu/satellite-blog/wp-content/uploads/sites/5/2016/07/160705-160706_modis_avhrr_viirs_infrared_Upper_Midwest_MCS_anim.gif)
![Suomi NPP VIIRS Infrared Window (11.45 um) and Day/Night Band (0.7 um) images [click to enlarge]](https://cimss.ssec.wisc.edu/satellite-blog/wp-content/uploads/sites/5/2016/07/160706_0852utc_suomi_npp_viirs_Infrared_DayNightBand_Upper_Midwest_MCS_anim.gif)
![POES AVHRR Cloud Top Height product and Infrared (12.0 um) image [click to enlarge]](https://cimss.ssec.wisc.edu/satellite-blog/wp-content/uploads/sites/5/2016/07/60706_0339utc_poes_avhrr_cth_ir_anim.gif)
