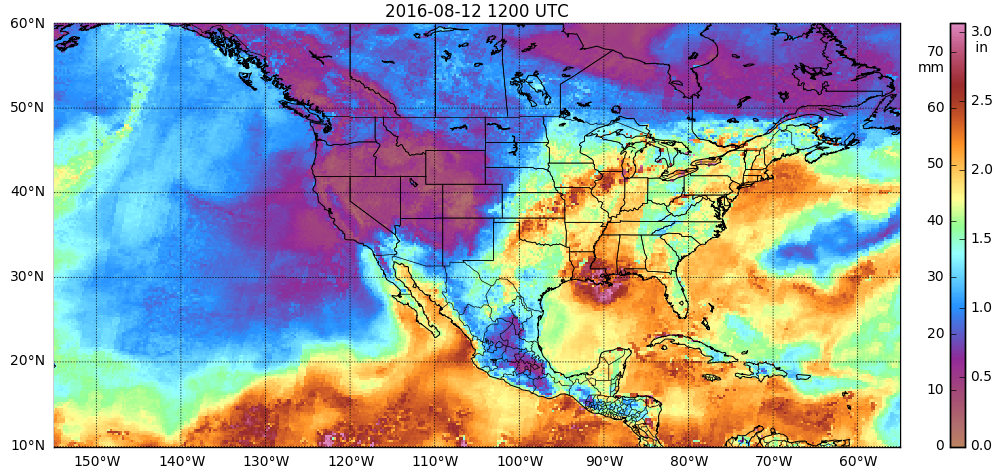
Persistent convection in an atmosphere rich in moisture has led to life-threatening flooding over many Parishes in southern Louisiana. The animation above, taken from images at this site that morphs MIRS estimates of Total Precipitable Water (with values valid over both land and water) shows values around three inches over much of southeastern... Read More
![Morphed MIRS observations of total precipitable water (TPW), 1500 UTC 11 August - 2100 UTC 12 August [click to play animation]](https://cimss.ssec.wisc.edu/satellite-blog/wp-content/uploads/sites/5/2016/08/MIMICTPw_0812_1200UTC.PNG)
Morphed MIRS observations of total precipitable water (TPW), 1500 UTC 11 August – 2100 UTC 12 August [click to play animation]
Persistent convection in an atmosphere rich in moisture has led to life-threatening flooding over many Parishes in southern Louisiana. The animation above, taken from images at
this site that morphs
MIRS estimates of Total Precipitable Water (with values valid over both land and water) shows values around three inches over much of southeastern Louisiana. These TPW values agree with
in situ observations such as the
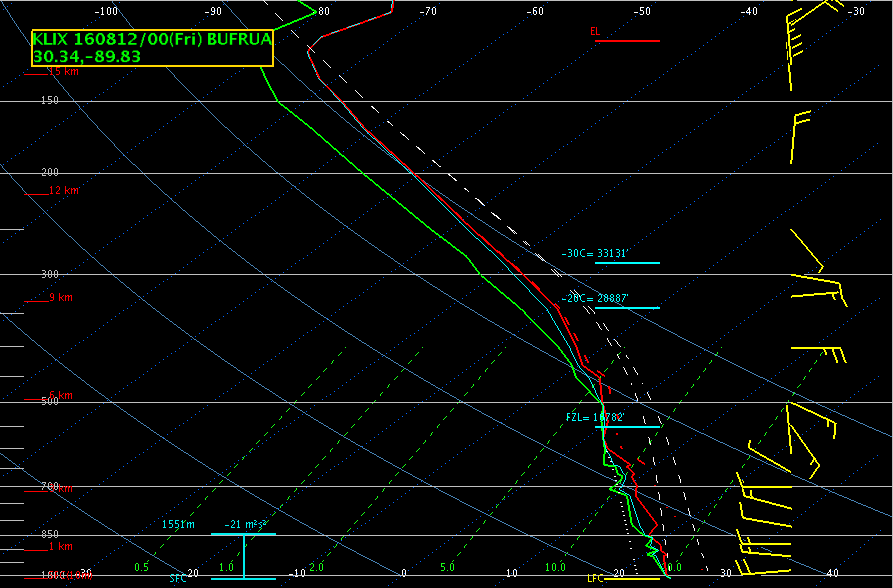
radiosonde from New Orleans at 1200 UTC on 12 August, where 2.70″ was observed. 24-hour rainfall totals ending at 1200 UTC on 12 August
(Link) show a widespread region of more than 6″; raingauge observations of 6-hour totals at 1200 and 1800 UTC, below, show that the rain continued into the day on 12 August.
![GOES-14 Visible (0.62 µm) images, with METAR observations of 6-hour precipitation, 1200 and 1800 UTC on 12 August 2016 [click to enlarge]](https://cimss.ssec.wisc.edu/satellite-blog/wp-content/uploads/sites/5/2016/08/PRECIPTOTAL_12_18_12August2016toggle.gif)
GOES-14 Visible (0.62 µm) images, with METAR observations of 6-hour precipitation, 1200 and 1800 UTC on 12 August 2016 [click to enlarge]
The flood-producing thunderstorms were very slow-moving, as evidenced in the animation of Infrared Window (10.7 µm) images from GOES-14, below (
GOES-14 is in SRSO-R mode this month). Very little motion occurs in the two hours of this loop (using images at 5-minute time steps).
![GOES-14 Infrared Window (10.7 µm) Imagery, 1625-1830 UTC on 12 August 2016 [click to play animation]](https://cimss.ssec.wisc.edu/satellite-blog/wp-content/uploads/sites/5/2016/08/GOES14_12AUG_IR4_1830.GIF)
GOES-14 Infrared Window (10.7 µm) Imagery, 1625-1830 UTC on 12 August 2016 [click to play animation]
The entire sequence of 1-minute interval GOES-14 Infrared Window (10.7 µm) images from 0001-2358 UTC on 12 August is shown below.
![GOES-14 Infrared Window (10.7 µm) images, with surface weather symbols plotted in yellow [click to play MP4 animation]](https://cimss.ssec.wisc.edu/satellite-blog/wp-content/uploads/sites/5/2016/08/960x1280_AGOES14_B4_GOES14_IR_LA_12AUG2016_2016225_235800_0001PANEL.GIF)
GOES-14 Infrared Window (10.7 µm) images, with surface weather symbols plotted in yellow [click to play MP4 animation]
This event is also discussed at the
Satellite Liaison Blog, where the focus is on 1-minute visible imagery from GOES-14 and 1-minute lightning data.
===== 13 August Update =====
![GOES-14 Infrared Window (10.7 µm) images, with hourly surface weather symbols plotted in yellow [click to play MP4 animation]](https://cimss.ssec.wisc.edu/satellite-blog/wp-content/uploads/sites/5/2016/08/960x1280_AGOES14_B4_GOES14_IR_LA_11-13AUG2016_2016226_111500_0001PANEL.GIF)
GOES-14 Infrared Window (10.7 µm) images, with hourly surface weather symbols plotted in yellow [click to play MP4 animation]
The heavy rainfall continued into 13 August, with storm total accumulations exceeding 31 inches in Louisiana (
WPC storm summary). The entire sequence of 1-minute interval GOES-14 Infrared Window (10.7 µm) images spanning the period 1115 UTC on 11 August to 2159 UTC on 13 August, above, shows the development of multiple clusters of slow-moving thunderstorms, some of which exhibited cloud-top IR brightness temperatures of -80ºC or colder (violet color enhancement).
View only this post
Read Less
![GOES-14 Visible (0.63 µm) images, with hourly surface weather symbols plotted in yellow [click to play MP4 animation]](https://cimss.ssec.wisc.edu/satellite-blog/wp-content/uploads/sites/5/2016/08/960x1280_GOES14_B1_GOES14_VIS_PACNW_17AUG2016_2016230_172600_0001PANEL.GIF)
![GOES-14 Visible (0.63 µm) images, with hourly plots of surface reports in yellow [click to play MP4 animation]](https://cimss.ssec.wisc.edu/satellite-blog/wp-content/uploads/sites/5/2016/08/960x1280_GOES14_B1_GOES14_VIS_SFO_17AUG2016_2016230_160400_0001PANEL.GIF)
![GOES-14 0.63 µm Visible (left) and 3.9 µm Shortwave Infrared (right) images, with hourly plots of surface reports in cyan/yellow [click to play MP4 animation]](https://cimss.ssec.wisc.edu/satellite-blog/wp-content/uploads/sites/5/2016/08/960x640_GOES14_B12_GOES14_VIS_SWIR_CA_FIRE_16AUG2016_2016230_154500_0002PANELS.GIF)
![GOES-14 Visible (0.63 µm) images, with county outlines and 4-character airport identifiers [click to play MP4 animation]](https://cimss.ssec.wisc.edu/satellite-blog/wp-content/uploads/sites/5/2016/08/960x1280_GOES14_B1_GOES14_VIS_BLUE_CUT_FIRE_CA_17AUG2016_2016230_213200_0001PANEL.GIF)
![Morphed MIRS observations of total precipitable water (TPW), 1500 UTC 11 August - 2100 UTC 12 August [click to play animation]](https://cimss.ssec.wisc.edu/satellite-blog/wp-content/uploads/sites/5/2016/08/MIMICTPw_0811_15_0812_21anim.gif)
![GOES-14 Infrared Window (10.7 µm) Imagery, 1625-1830 UTC on 12 August 2016 [click to play animation]](https://cimss.ssec.wisc.edu/satellite-blog/wp-content/uploads/sites/5/2016/08/GOES14_12AUG_IR4_12Aug_1625_1830anim.gif)

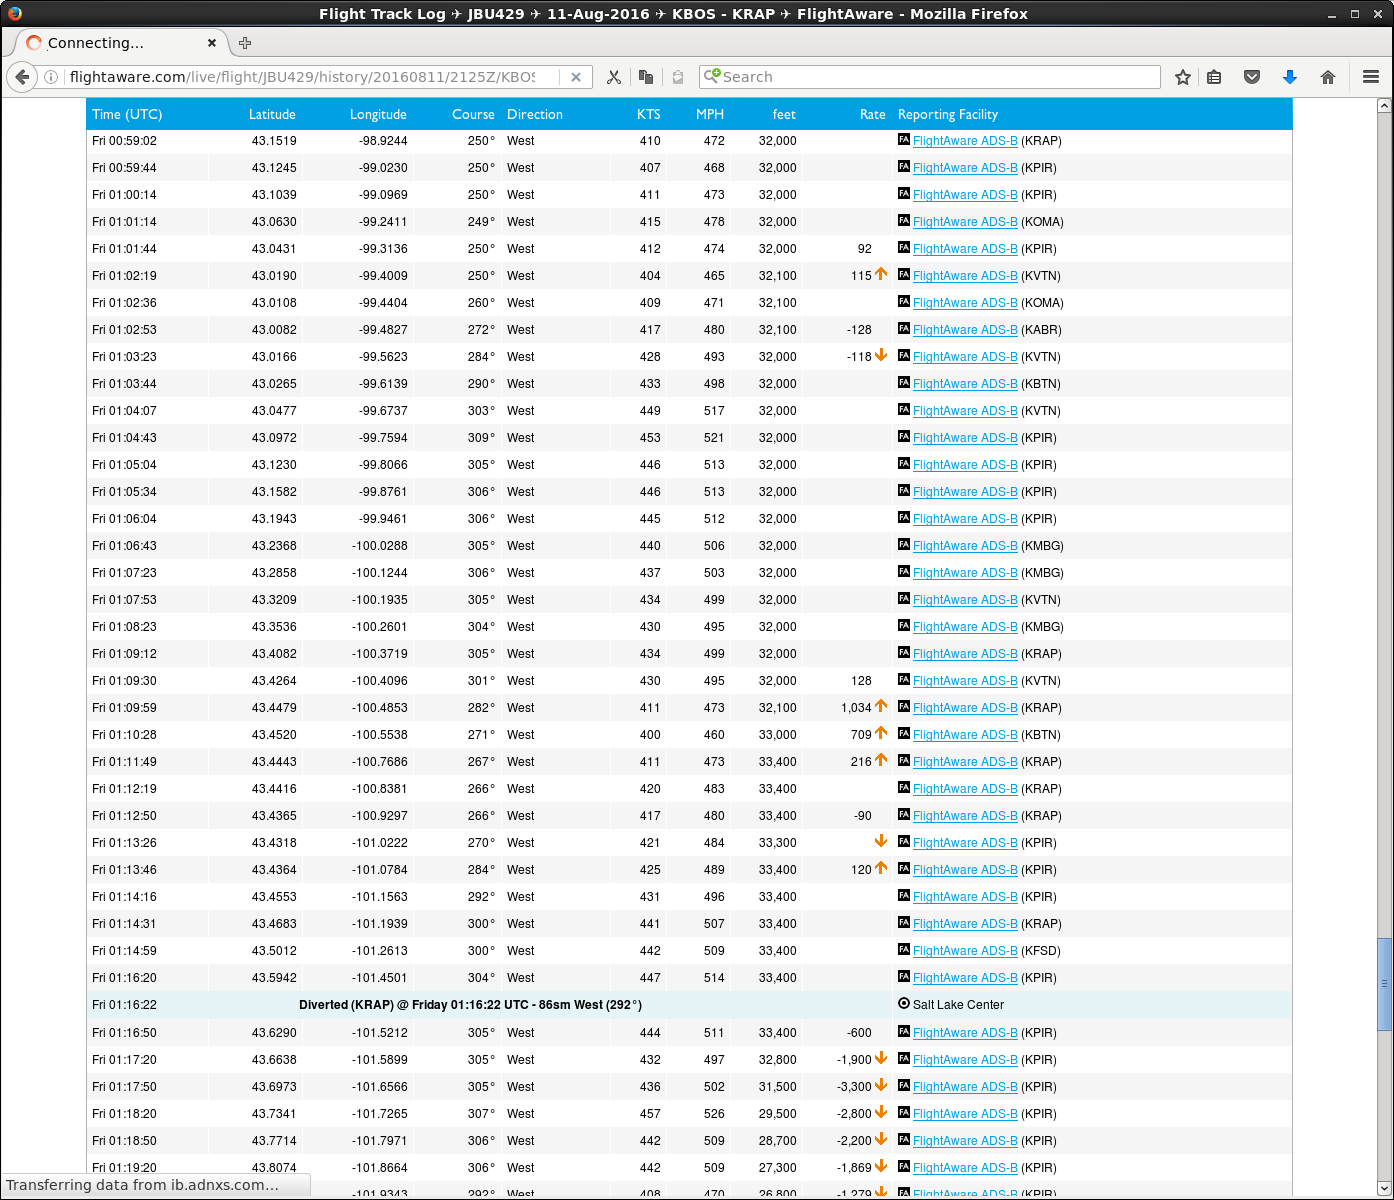
![JetBlue Flight 429 flight path [click to enlarge]](https://cimss.ssec.wisc.edu/satellite-blog/wp-content/uploads/sites/5/2016/08/160811_JetBlue_429_path_FlightAware.png)
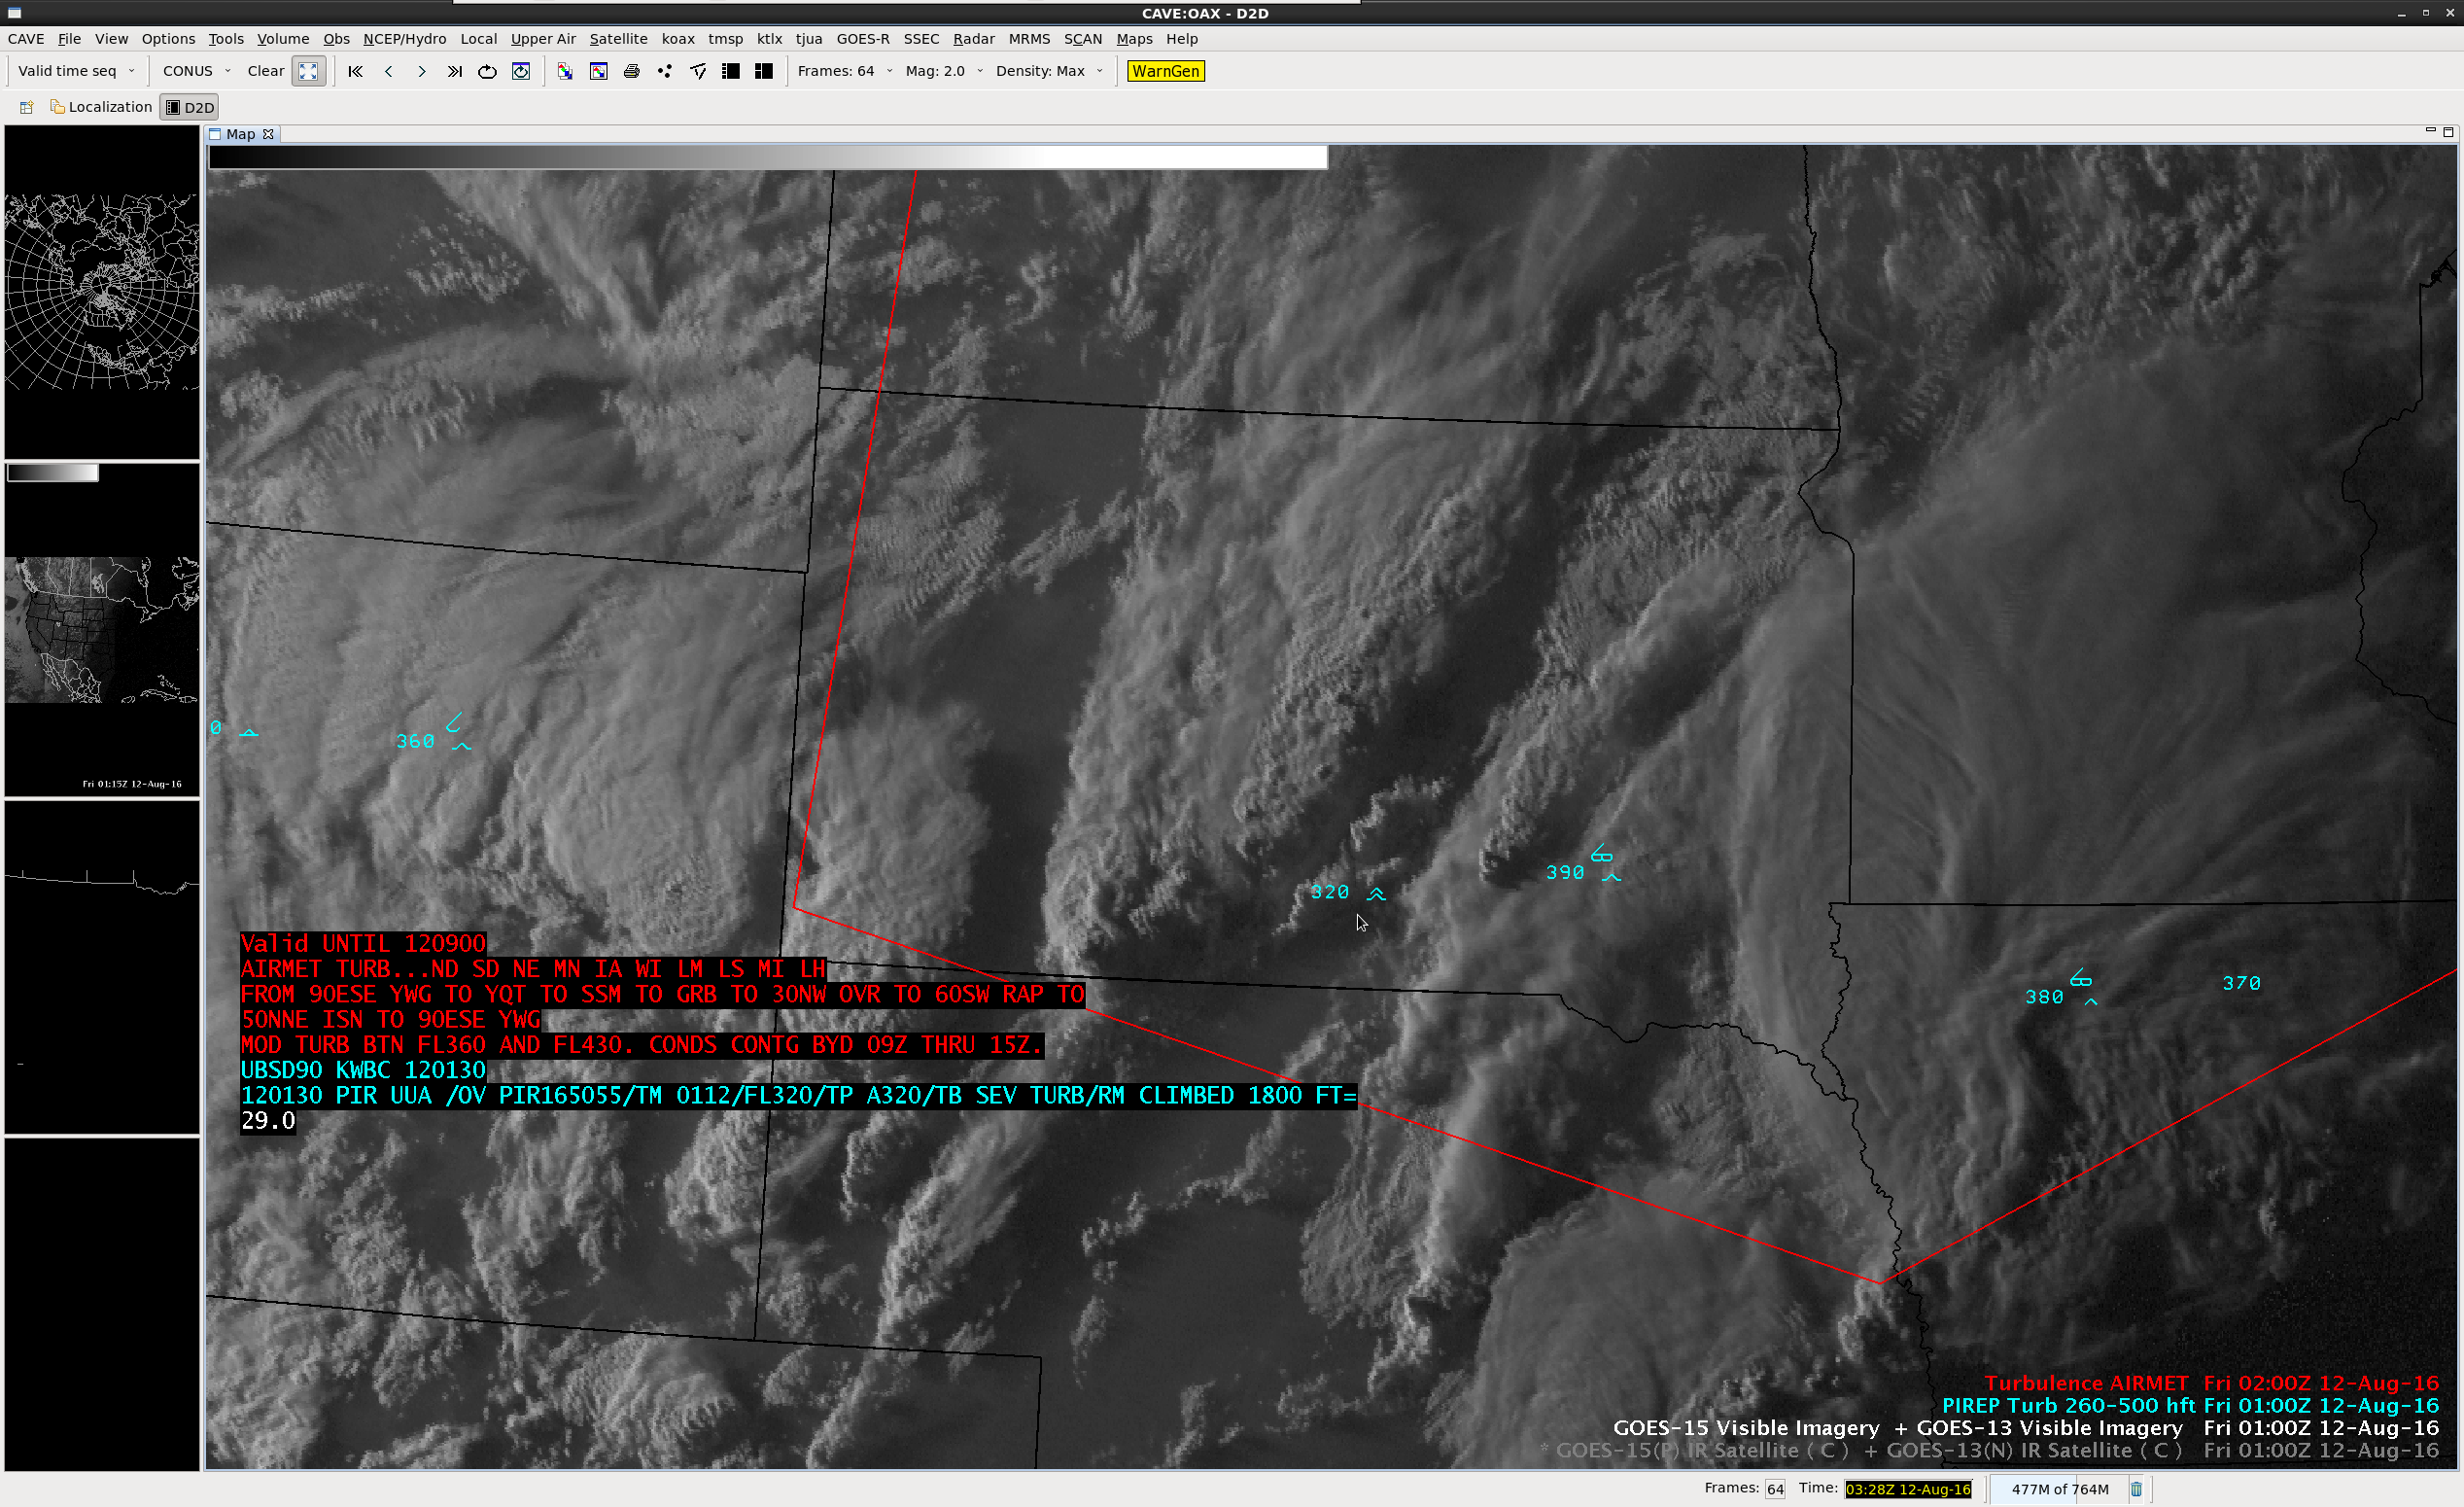
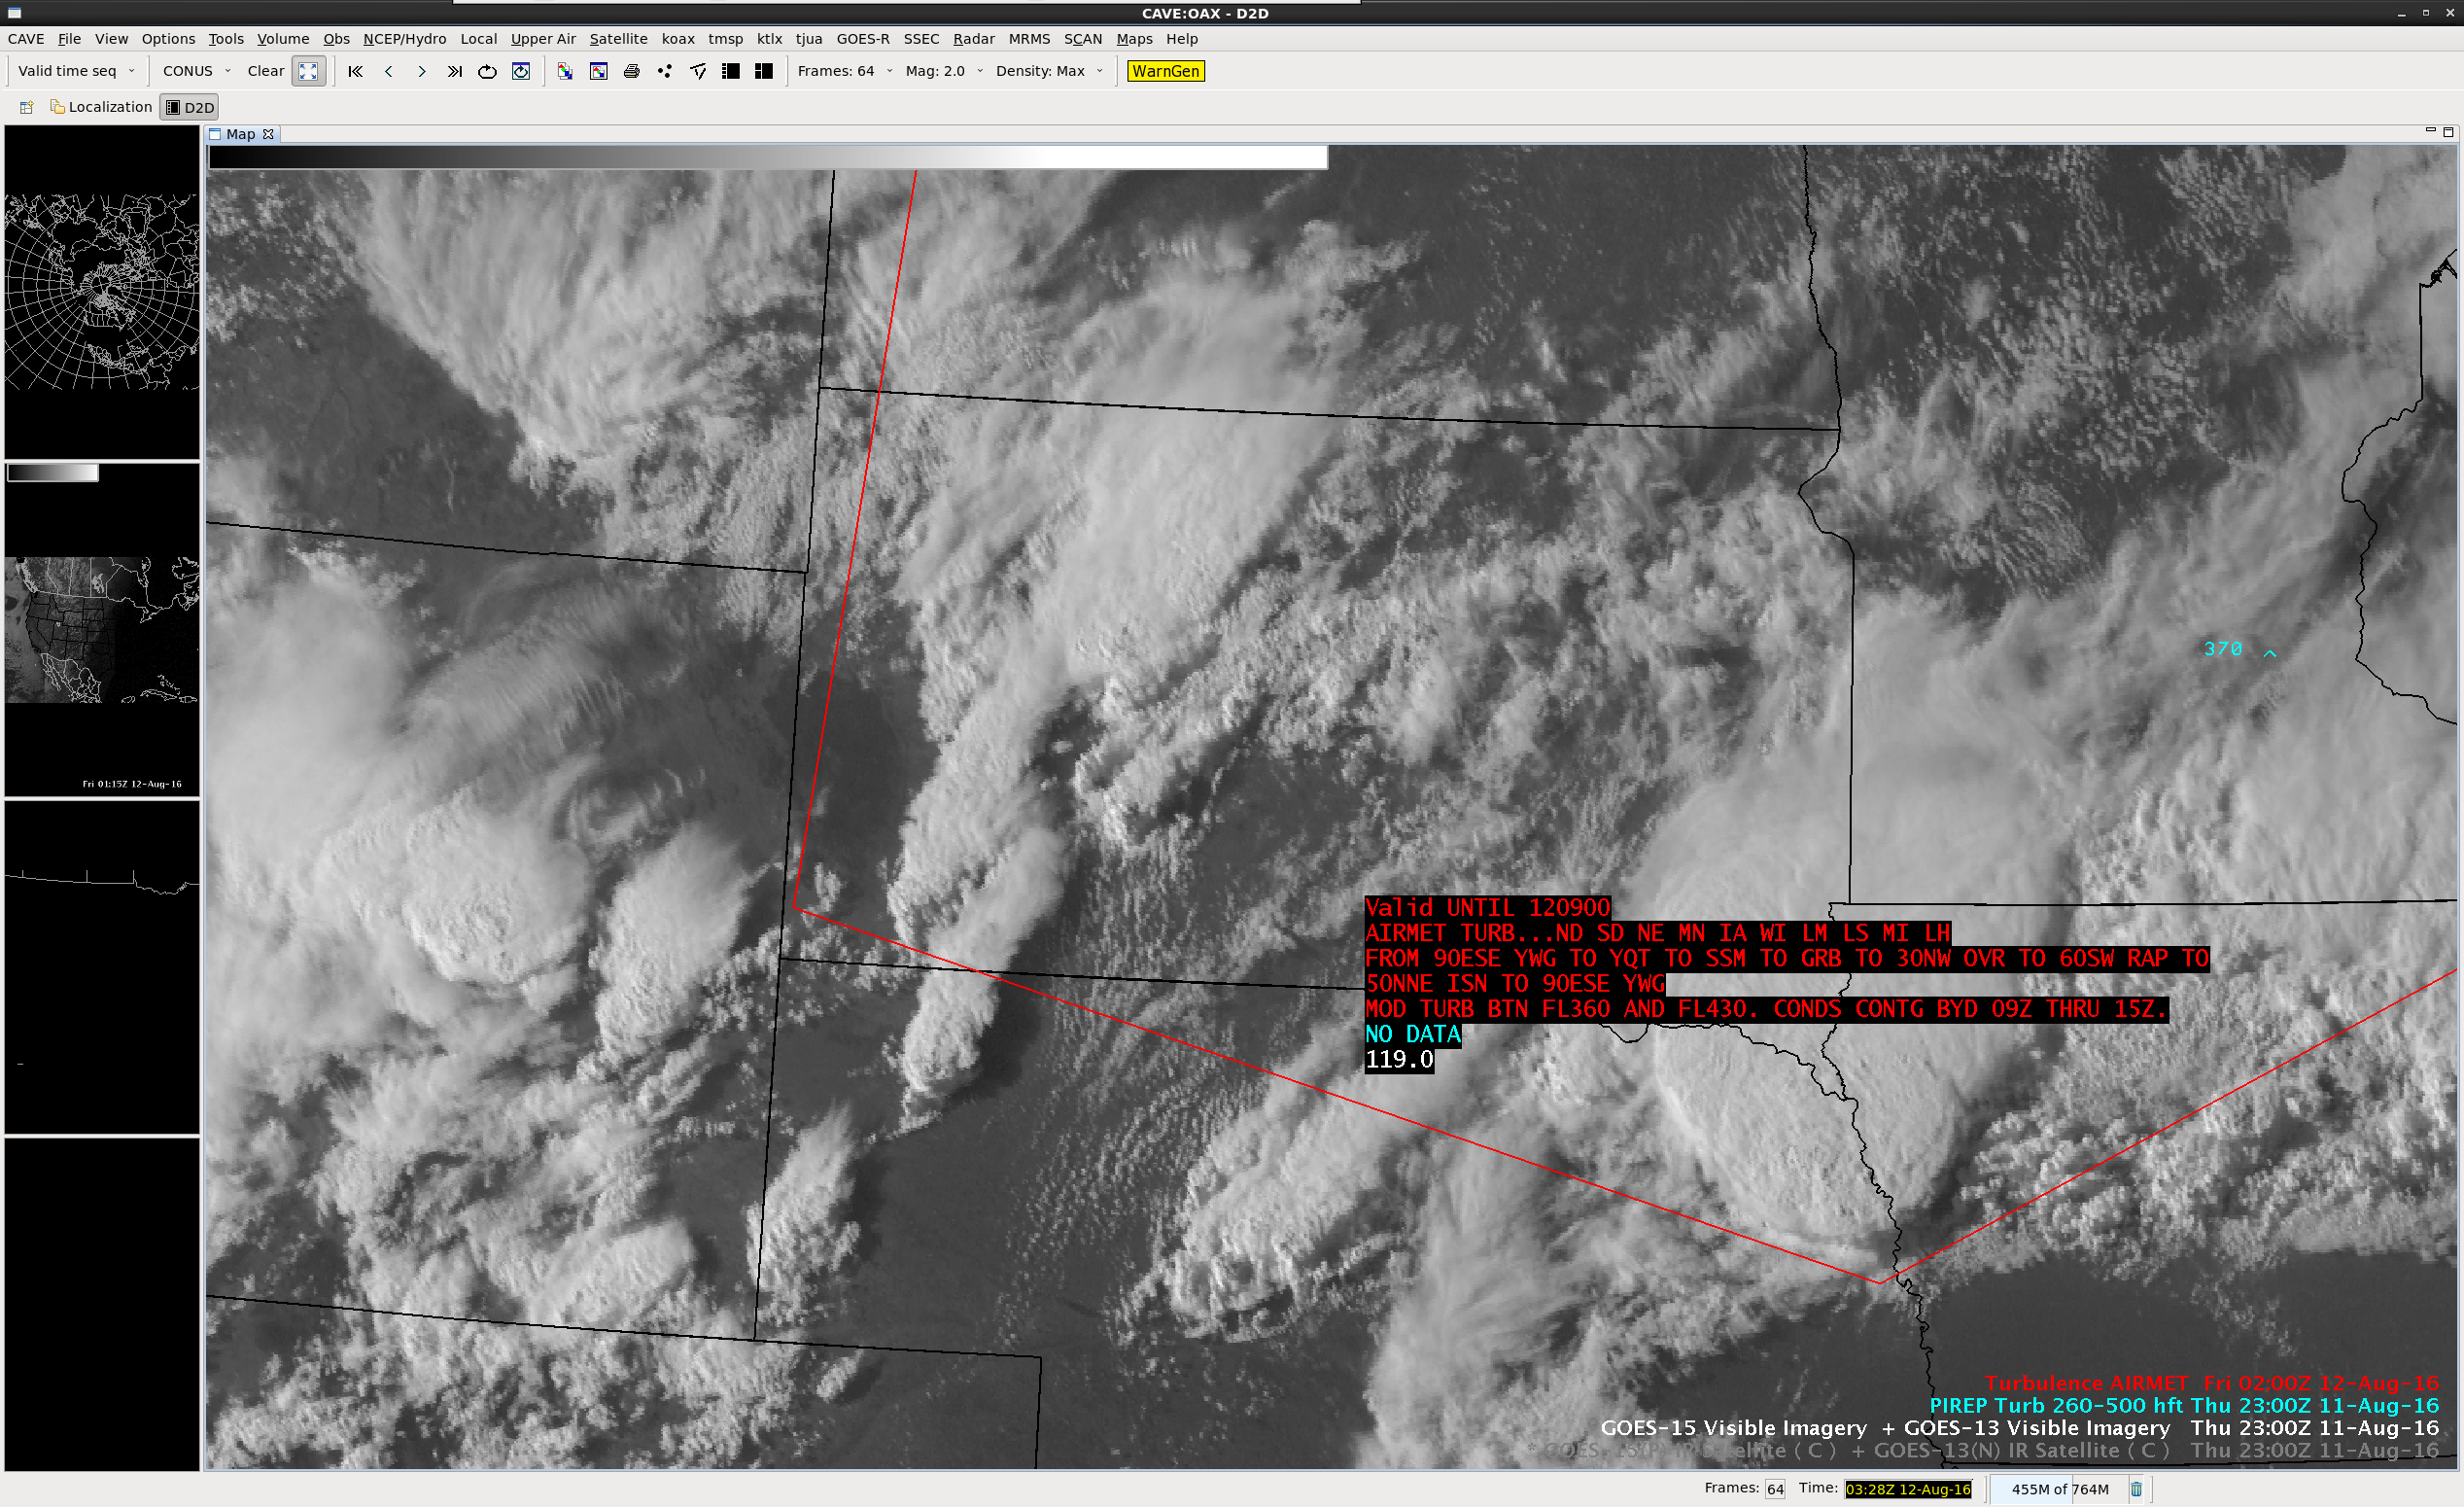
![GOES-13 Visible (0.63 µm) images, with pilot reports of turbulence [click to play animation]](https://cimss.ssec.wisc.edu/satellite-blog/wp-content/uploads/sites/5/2016/08/160811_goes13_visible_pireps_airmet_anim_2.gif)
![GOES-13 Infrared Window (10.7 µm) images, with pilot reports of turbulence [click to play animation]](https://cimss.ssec.wisc.edu/satellite-blog/wp-content/uploads/sites/5/2016/08/160811_goes13_infrared_pireps_airmet_anim_2.gif)
![POES AVHRR Visible (0.86 µm) and Infrared (12.0 µm) images, with pilot reports [click to enlarge]](https://cimss.ssec.wisc.edu/satellite-blog/wp-content/uploads/sites/5/2016/08/160811_0049utc_poes_avhrr_visible_infrared_pireps_anim.gif)
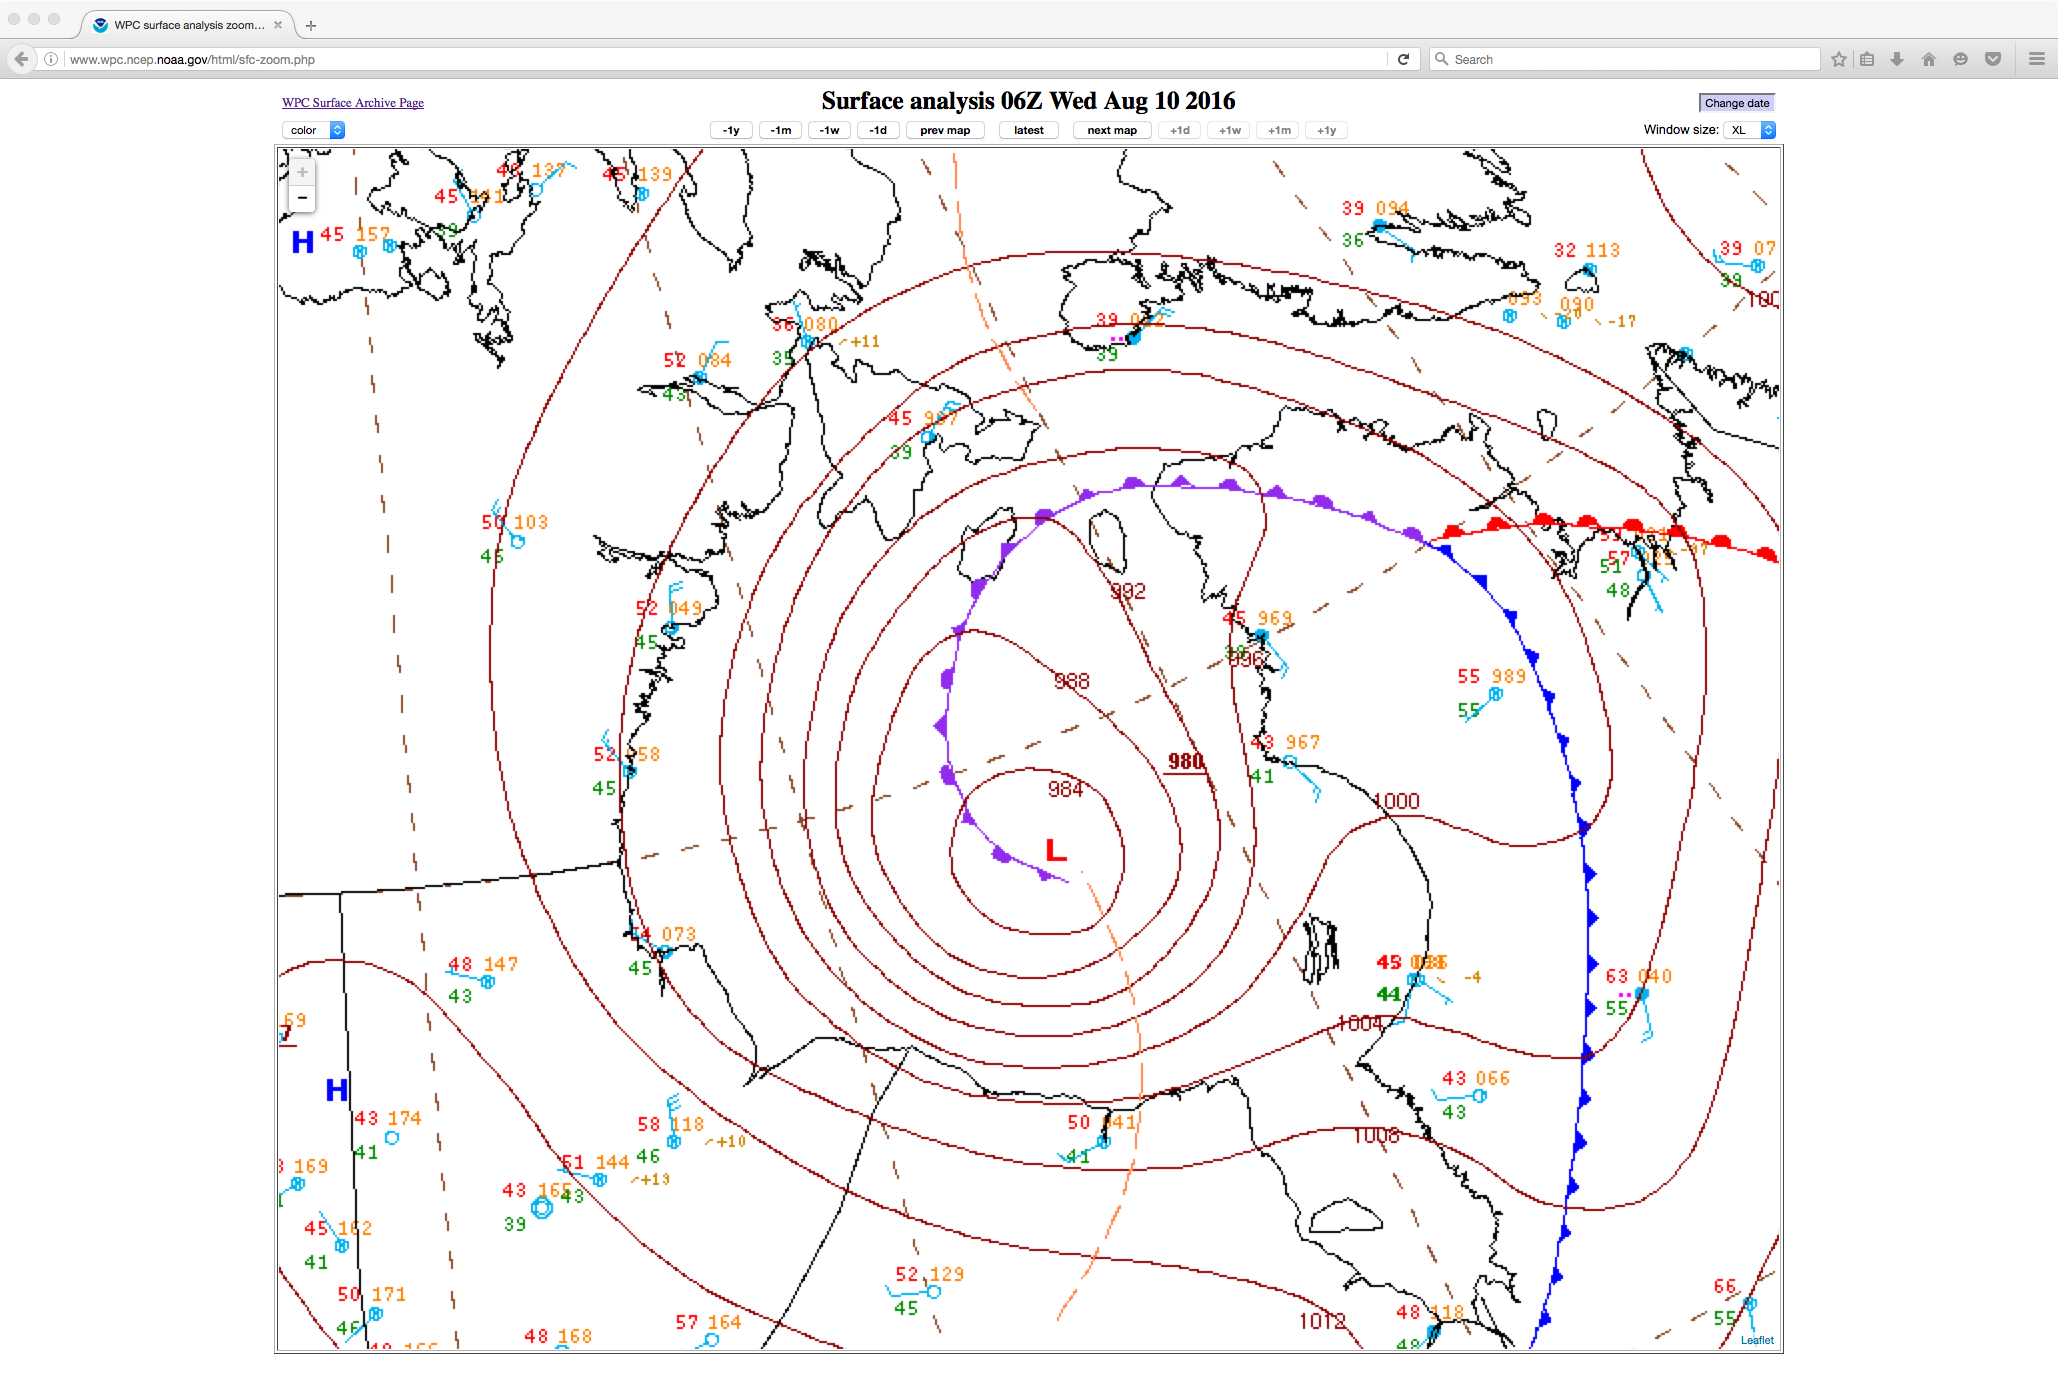
![GOES-13 Water Vapor (6.5 µm) images, with hourly surface observations [click to play animation]](https://cimss.ssec.wisc.edu/satellite-blog/wp-content/uploads/sites/5/2016/08/160809-10_goes13_water_vapor_Hudson_Bay_anim.gif)
![Suomi NPP VIIRS true-color RGB images [click to enlarge]](https://cimss.ssec.wisc.edu/satellite-blog/wp-content/uploads/sites/5/2016/08/160808-10_suomi_npp_viirs_truecolor_Hudson_Bay_cyclone_anim.gif)
