Following a short-lived eruption on 21 December, the Bogoslof volcano in the eastern Aleutian Island chain of Alaska erupted again at about 0110 UTC on 22 December 2016. The volcanic cloud could be seen moving north/northeastward away from Bogoslof (denoted by the yellow * symbol) on Himawari-8 and GOES-15 Visible images (above).... Read More
![Himawari-8 0.64 µm (left) and GOES-15 0.63 µm (right) Visible images [click to play animation]](https://cimss.ssec.wisc.edu/satellite-blog/wp-content/uploads/sites/5/2016/12/161222_HIM08_G15_VIS_BOGOSLOF_06.GIF)
Himawari-8 0.64 µm (left) and GOES-15 0.63 µm (right) Visible images [click to play animation]
Following a short-lived eruption on
21 December, the Bogoslof volcano in the eastern Aleutian Island chain of Alaska erupted again at about
0110 UTC on 22 December 2016. The volcanic cloud could be seen moving north/northeastward away from Bogoslof
(denoted by the yellow * symbol) on Himawari-8 and GOES-15 Visible images
(above). The higher spatial and temporal resolution from Himawari-8 (0.5 km at nadir, with images every 10 minutes) provided a more detailed view of the cloud feature compared to GOES-15 (with 1.0 km resolution at nadir, and images every 15 minutes); however, the
ABI instrument on the
GOES-R series will have an identical 0.5 km resolution
Visible band. Another Himawari-8 Visible image animation is available from
RAMMB.
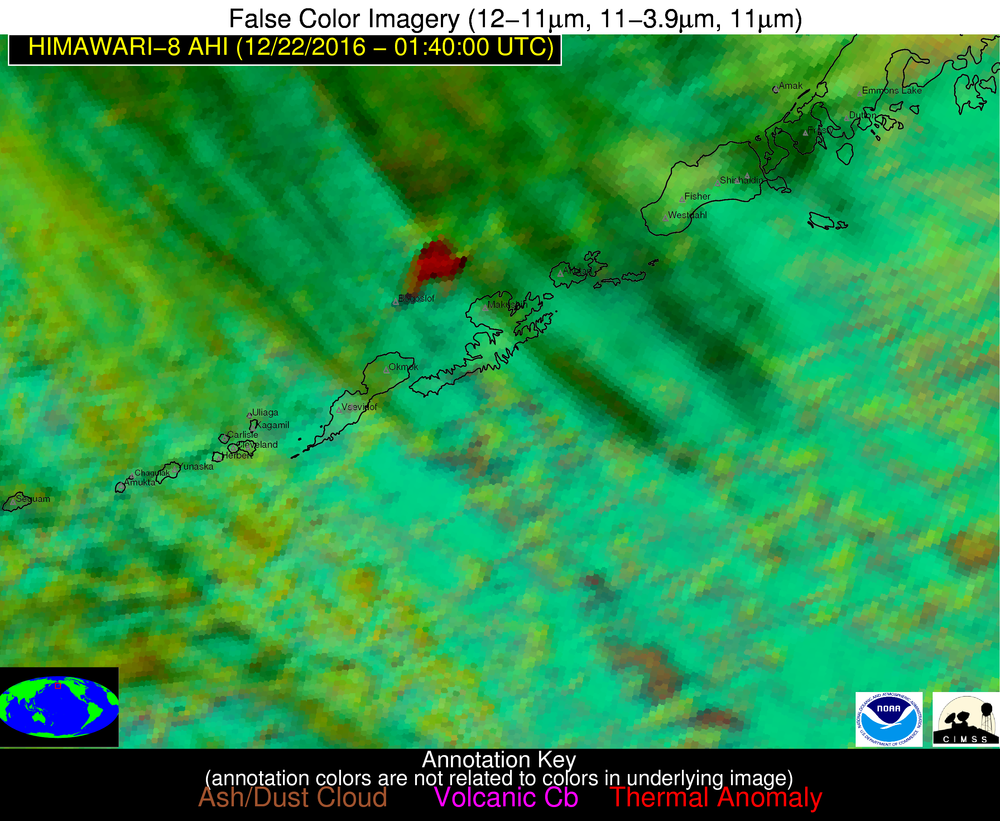
Multispectral Red/Green/Blue (RGB) images from the NOAA/CIMSS Volcanic Cloud Monitoring site (below) displayed a signal of the volcanic cloud during the ~2.5 hours following the onset of the eruption — since this particular RGB combination uses the 3.9 µm Shortwave Infrared band, the volcanic cloud feature appeared as darker shades of magenta during the first few images while reflected solar illumination was present before sunset.
![Himawari-8 false-color RGB images [click to play animation]](https://cimss.ssec.wisc.edu/satellite-blog/wp-content/uploads/sites/5/2016/12/HIMAWARI-8.AHI.2016-12-22_01-40-00.RGB1112or13um_3911um_11um.Aleutians_East_1_km.png)
Himawari-8 false-color RGB images [click to play animation]
Another variant of RGB images
(below) uses the 8.5 µm “cloud top phase” band, which is also sensitive to SO2 absorption; in this case, the appearance of the volcanic cloud feature was dominated by shades of yellow, indicating high levels of SO2.
![Himawari-8 false-color RGB images [click to play animation]](https://cimss.ssec.wisc.edu/satellite-blog/wp-content/uploads/sites/5/2016/12/HIMAWARI-8.AHI.2016-12-22_01-40-00.RGB1112um_8511um_11um.Aleutians_East_1_km.png)
Himawari-8 false-color RGB images [click to play animation]
A comparison of the 3 Himawari-8 water vapor bands
(below) showed that a strong signature of the volcanic cloud was seen on the lower-tropospheric 7.3 µm band; this was due to the fact that the 7.3 µm band is also sensitive to elevated levels of SO2 loading in the atmosphere (which was also noted at the bottom of this
Mount Pavlof eruption blog post). These same 3 water vapor bands (
Upper-level,
Mid-level and
Lower-level) will be available from the GOES-R series ABI instrument.
![Himawari-8 6.2 µm (top), 6.9 µm (middle) and 7.3 µm (bottom) Water Vapor images [click to play animation]](https://cimss.ssec.wisc.edu/satellite-blog/wp-content/uploads/sites/5/2016/12/320x1280_AHIM08_B8910_HIM08_WV_3PANEL_BOGOSLOF_22DEC2016_2016357_040000_0003PANELS.GIF)
Himawari-8 6.2 µm (top), 6.9 µm (middle) and 7.3 µm (bottom) Water Vapor images [click to play animation]
A closer view using Himawari-8 false-color images
(below) includes a magenta polygon surrounding the volcanic cloud soon after the onset of the eruption — this is an example of an experimental automated volcanic eruption
alerting system. According to Michael Pavolonis (NOAA/NESDIS), “Using our automated cloud object tracking algorithm, the eruption produced a cloud at 01:30 UTC that was about 19 deg C colder than the background imaged by Himawari-8 at 01:20 UTC. Taking into account the pixel size, background cloud cover, and time interval between successive images, the 19 deg C change is about an 11 standard deviation outlier relative to a very large database of meteorological clouds. The vertical growth anomaly calculation is the basis of one the components of our experimental automated volcanic eruption alerting system”.
![Himawari-8 false-color images, with a polygon surrounding the volcanic cloud [click to enlarge]](https://cimss.ssec.wisc.edu/satellite-blog/wp-content/uploads/sites/5/2016/12/bogoslof_alert_anim.gif)
Himawari-8 false-color images, with a polygon surrounding the volcanic cloud [click to enlarge]
The creation of RGB images such as those shown above will be possible from the GOES-R series of satellites (beginning with GOES-16), since the ABI instrument has the
8.4 µm and
12.3 µm bands that are not available from the current generation of GOES
imager instruments.
Additional satellite images of this event are available from NWS Anchorage.
View only this post
Read Less
![GOES-13 Water Vapor (6.5 µm) images, with hourly surface weather symbols [click to play animation]](https://cimss.ssec.wisc.edu/satellite-blog/wp-content/uploads/sites/5/2016/12/161225-26_goes13_water_vapor_blizzard_anim.gif)
![GOES-13 Water Vapor (6.5 µm) images, with hourly surface wind barbs and wind gusts in knots [click to play animation]](https://cimss.ssec.wisc.edu/satellite-blog/wp-content/uploads/sites/5/2016/12/161225-26_goes13_water_vapor_wind_gusts_blizzard_anim.gif)
![Aqua MODIS Visible (0.65 µm), Infrared Window (11.0 µm) and Water Vapor (6.7 µm) images [click to enlarge]](https://cimss.ssec.wisc.edu/satellite-blog/wp-content/uploads/sites/5/2016/12/161225_2001utc_aqua_modis_visible_infrared_water_vapor_Blizzard_anim.gif)
![Suom NPP VIIRS Visible (0.64 µm) and Infrared Window (11.45 µm) images [click to enlarge]](https://cimss.ssec.wisc.edu/satellite-blog/wp-content/uploads/sites/5/2016/12/161225_1952utc_suomi_npp_viirs_visible_infrared_zoom_Blizzard_anim.gif)
![Himawari-8 Infrared Window (10.4 µm) images [click to play MP4 animation]](https://cimss.ssec.wisc.edu/satellite-blog/wp-content/uploads/sites/5/2016/12/960x1280_H8F_B13_HIM08_IR_NOCK-TEN_25DEC2016_2016360_002210_0001PANEL.GIF)
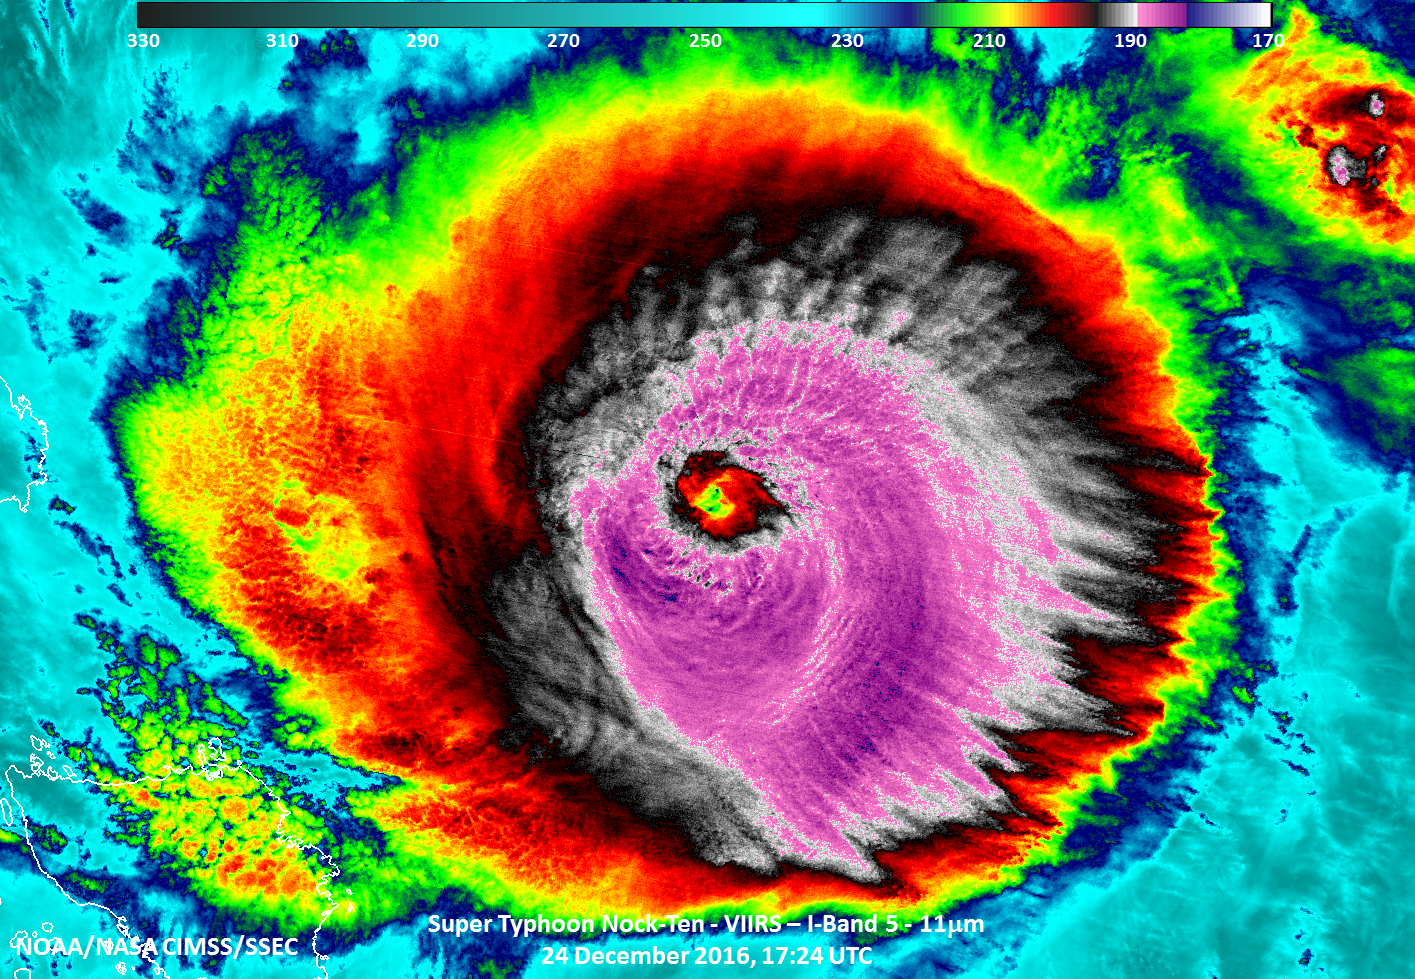
![Suomi NPP VIIRS Infrared Window (11.45 µm) image [click to enlarge]](https://cimss.ssec.wisc.edu/satellite-blog/wp-content/uploads/sites/5/2016/12/161224_1724utc_viirs_ir_Nock-Ten.png)
![Himawari-8 0.64 µm (left) and GOES-15 0.63 µm (right) Visible images [click to play animation]](https://cimss.ssec.wisc.edu/satellite-blog/wp-content/uploads/sites/5/2016/12/161222_himarari8_goes15_visible_Bogoslof_eruption_anim.gif)
![Himawari-8 false-color RGB images [click to play animation]](https://cimss.ssec.wisc.edu/satellite-blog/wp-content/uploads/sites/5/2016/12/161222_himawari8_falsecolor_rgb_1_Bogoslof_AK_anim.gif)
![Himawari-8 false-color RGB images [click to play animation]](https://cimss.ssec.wisc.edu/satellite-blog/wp-content/uploads/sites/5/2016/12/161222_himawari8_falsecolor_rgb_2_Bogoslof_AK_anim.gif)
![Himawari-8 6.2 µm (top), 6.9 µm (middle) and 7.3 µm (bottom) Water Vapor images [click to play animation]](https://cimss.ssec.wisc.edu/satellite-blog/wp-content/uploads/sites/5/2016/12/161222_himawari8_water_vapor_Bogoslof_anim.gif)
![Meteosat-10 Visible (0.635 µm) images [click to enlarge]](https://cimss.ssec.wisc.edu/satellite-blog/wp-content/uploads/sites/5/2016/12/161221_meteosat10_visible_anim.gif)
![Himawari-8 Visible (0.64 µm) images [click to play MP4 animation]](https://cimss.ssec.wisc.edu/satellite-blog/wp-content/uploads/sites/5/2016/12/960x1280_H8F_B3_HIM08_VIS_ANTARCTICA_20-21DEC2016_2016356_104000_0001PANEL.GIF)
![AMRC AWS station surface temperatures at 20 December (22 UTC) and 21 December (05 and 11 UTC) [click to enlarge]](https://cimss.ssec.wisc.edu/satellite-blog/wp-content/uploads/sites/5/2016/12/161220-21_antarctica_surface_temperatures_amrc_anim.gif)
