
The 2015 Wildfire Season is off to a quick start in Alaska (continuing an observed trend). This map (from this site) shows more than 300 active fires over Alaska at 2000 UTC on 29 June 2015. This graph (from the Alaska Climate Info Facebook page) compares early burn acreage in 2015 to that in 2004... Read More
Suomi NPP VIIRS 3.74 µm infrared channel images, times as indicated (click to enlarge)
Suomi NPP 0.64 µm visible channel images, times as indicated (click to enlarge)
The 2015 Wildfire Season is off to a quick start in Alaska (continuing an observed trend). This map (from this site) shows more than 300 active fires over Alaska at 2000 UTC on 29 June 2015. This graph (from the Alaska Climate Info Facebook page) compares early burn acreage in 2015 to that in 2004 (the year with the most acreage burned — see this graph, courtesy of Uma Bhatt, University of Alaska-Fairbanks).
Soumi NPP VIIRS 3.74 µm infrared imagery from early morning on 29 June 2015 (top) shows numerous wildfire hot spots (dark black pixels) in the region surrounding the Yukon River (the middle portion of the imagery, south of Kotzebue Sound). VIIRS visible imagery from the same time, above, shows an extensive pall of smoke over much of central Alaska.
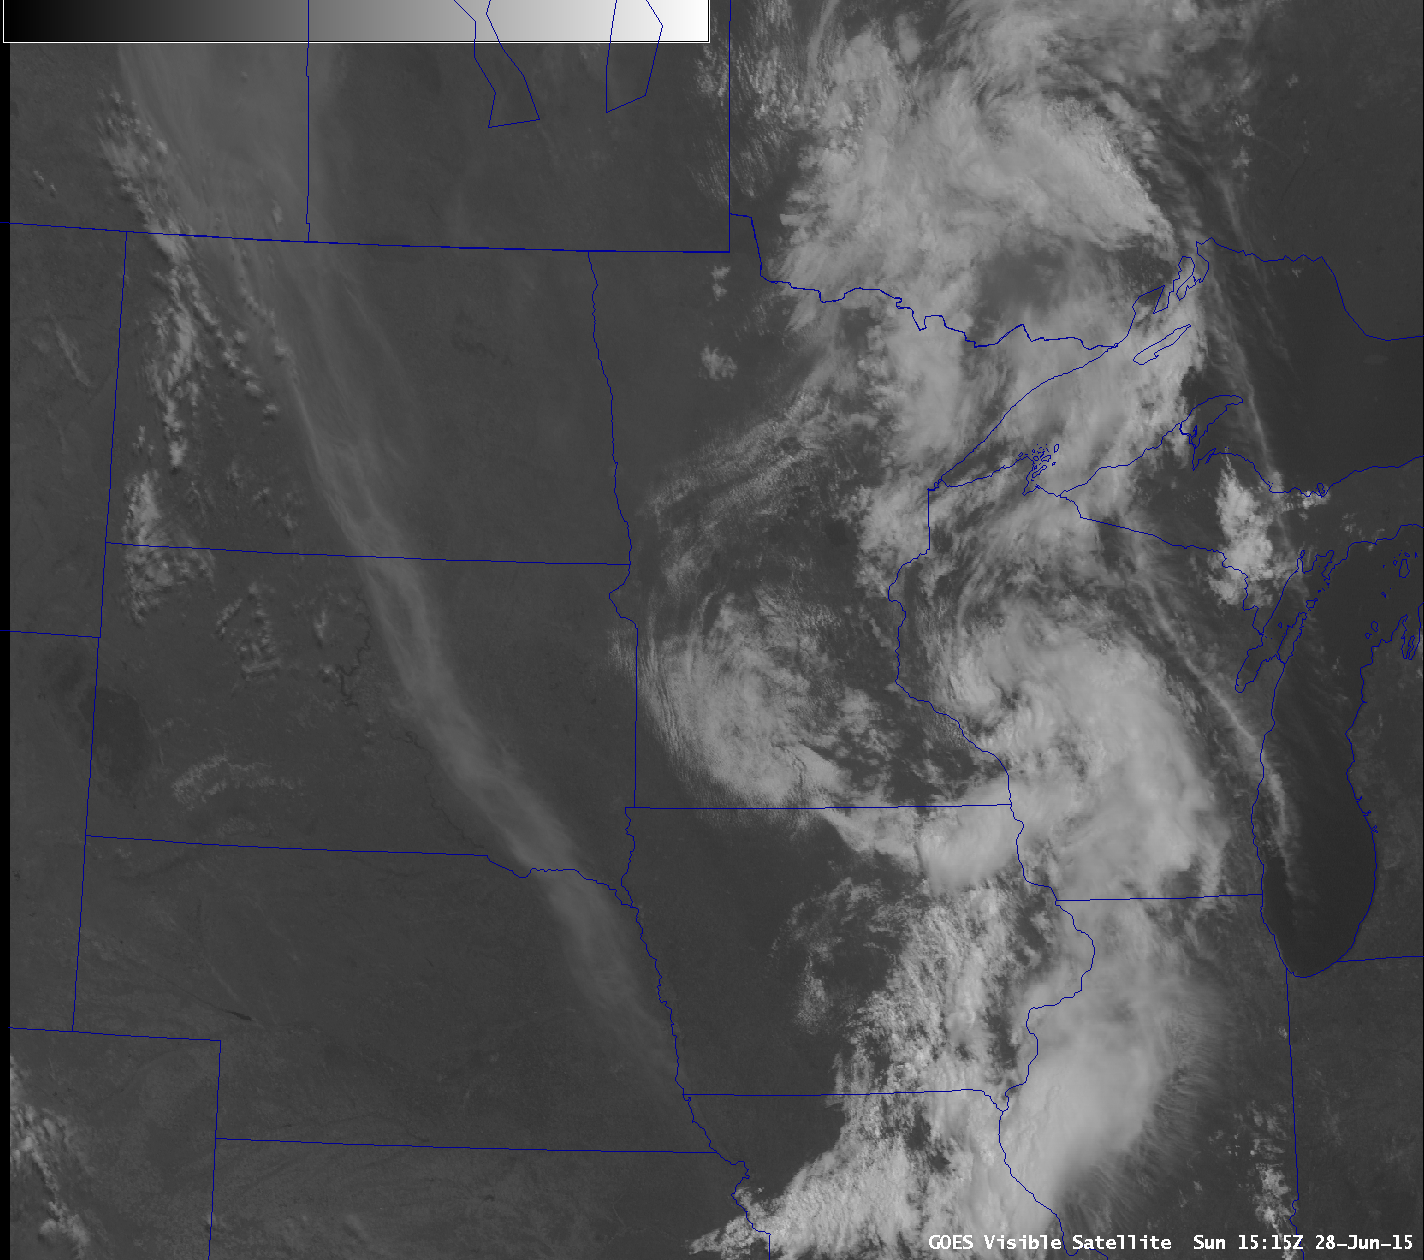
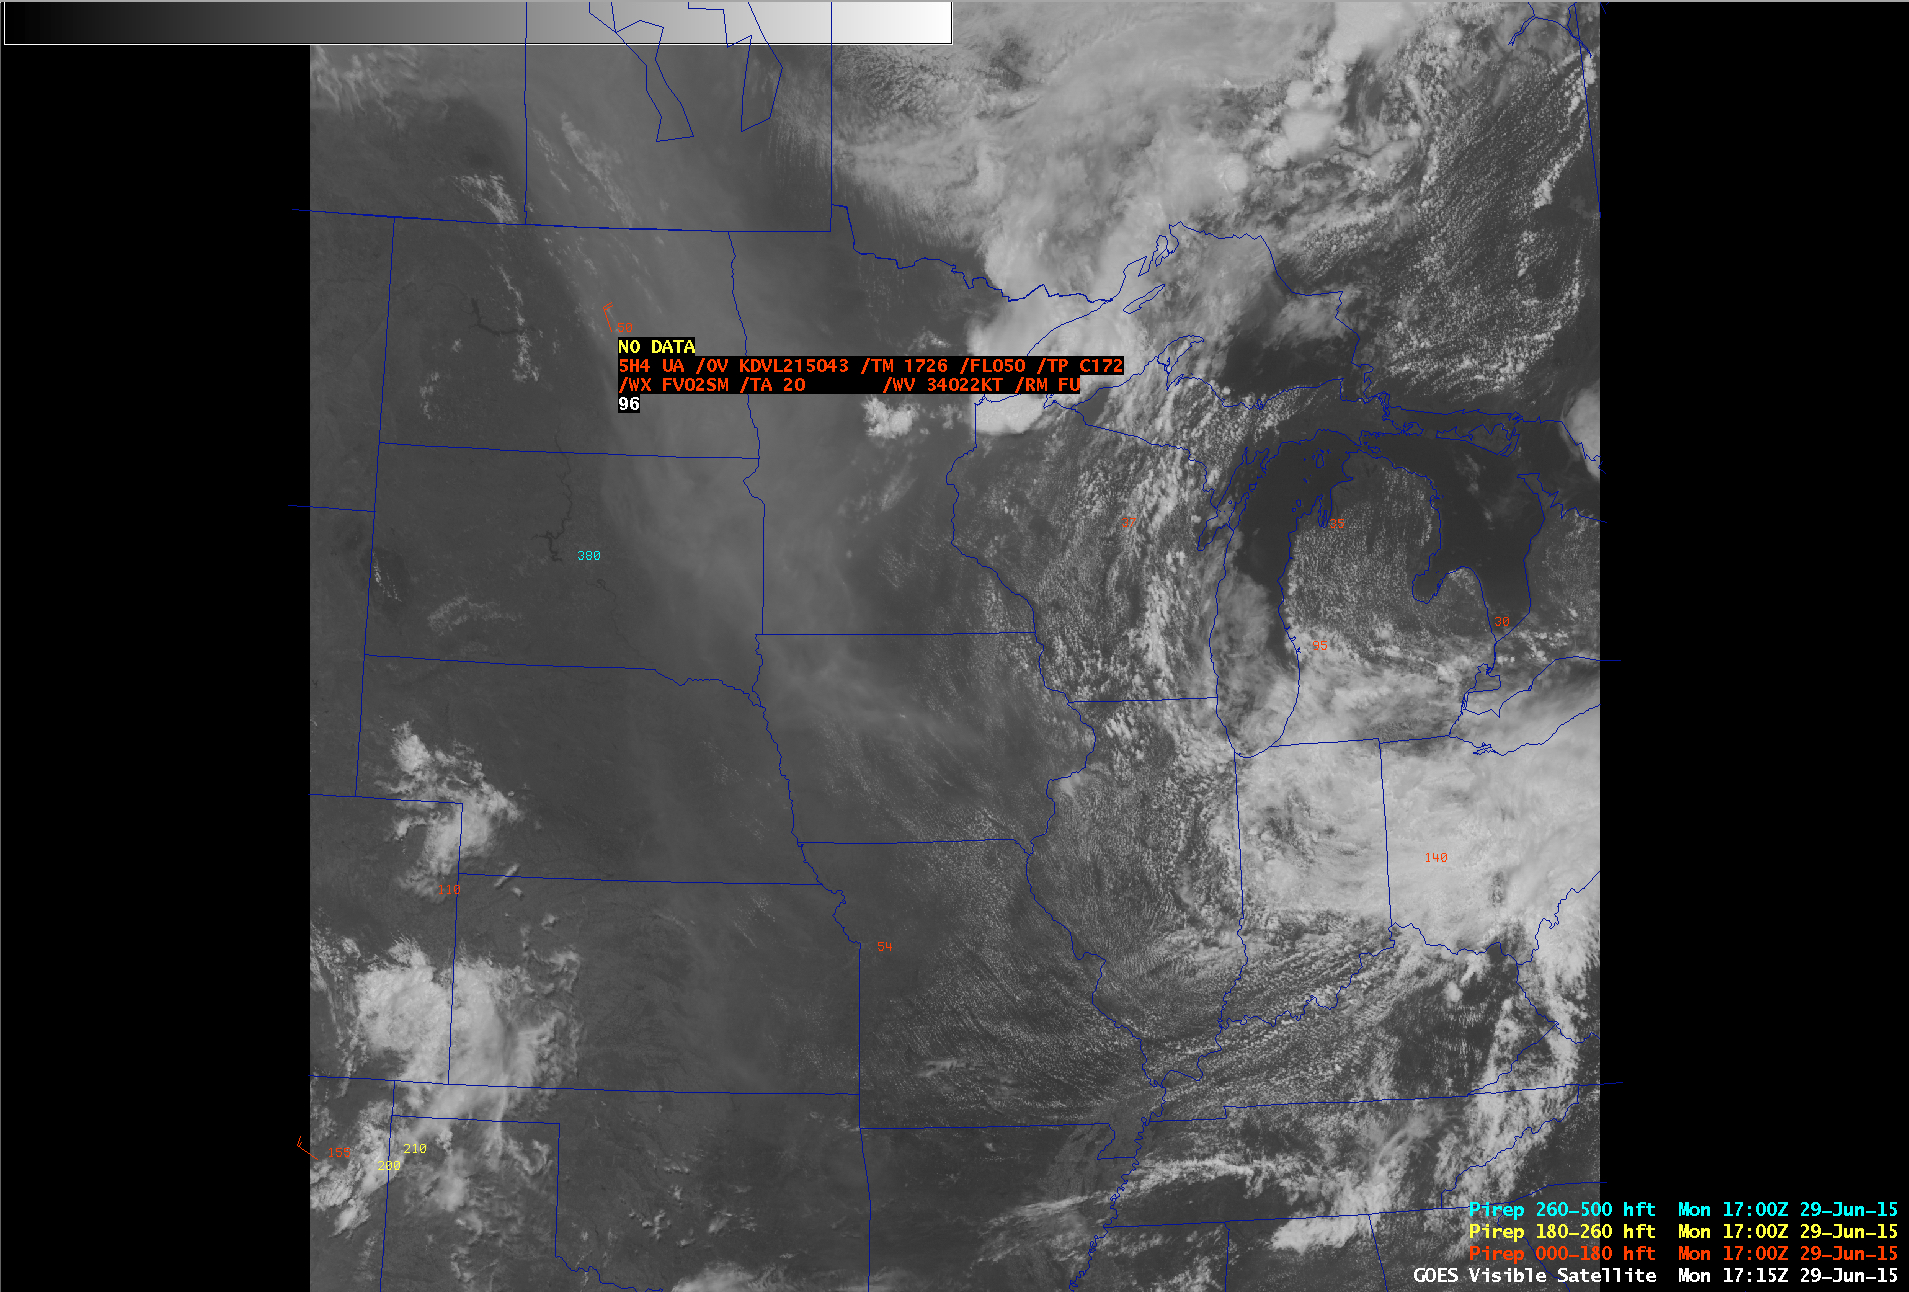
GOES-13 Visible (0.63 µm) imagery (click to play animation)
Meanwhile, thick smoke from fires burning over northern Canada (comparison of VIIRS visible and shortwave IR images from 28 June) was drifting southward over central portions of the Lower 48 states. The smoke plume on 28 June (above) was fairly narrow; however, a much broader and thicker plume was seen moving south on 29 June (GOES visible imagery below, then MODIS/VIIRS true-color RGB imagery as displayed using the SSEC RealEarth web map server). SSEC MODIS Today true-color imagery of this smoke plume is also available here. Pilot reports placed the lower and upper bounds of the thick smoke at 5000 and 17500 feet, with flight visibilities as low as 2 miles at 5000 feet. Some of the smoke subsided to the surface in southeastern South Dakota, restricting the surface visibility at Sioux Falls to 5 miles and raising the Air Quality Index there into the Unhealthy category. In fact, the smoke was so thick over far eastern South Dakota that it had the effect of reducing surface heating and slowing the rise of afternoon temperatures, such that convective temperatures were not being reached and probabilities of precipitation had to be scaled back:
AREA FORECAST DISCUSSION
NATIONAL WEATHER SERVICE SIOUX FALLS SD
356 PM CDT MON JUN 29 2015
.SHORT TERM…(THIS EVENING THROUGH TUESDAY)
ISSUED AT 356 PM CDT MON JUN 29 2015
IN ADDITION…THICK PLUME OF SMOKE CONTINUES TO DRIFT SOUTHWARD IMPACTING NEARLY ALL OF THE FORECAST AREA…BUT MOST NOTABLE ALONG AND EAST OF THE JAMES RIVER VALLEY. BECAUSE OF THIS…AFTERNOON TEMPERATURES ARE ABOUT 2 TO 4 DEGREES
COOLER THAN FORECAST AND WE ARE HAVING A HECK OF A TIME REACHING OUR CONVECTIVE TEMPERATURE. THEREFORE LOWERED THE LATE AFTERNOON AND EVENING POPS IN OUR EASTERN ZONES TO ONLY SLIGHT CHANCE POPS. BUT EVEN THOSE MAY BE TOO HIGH AND IF NOTHING DEVELOPS OVER THE NEXT COUPLE OF HOURS…THEY MAY NEED TO BE REMOVED ENTIRELY.
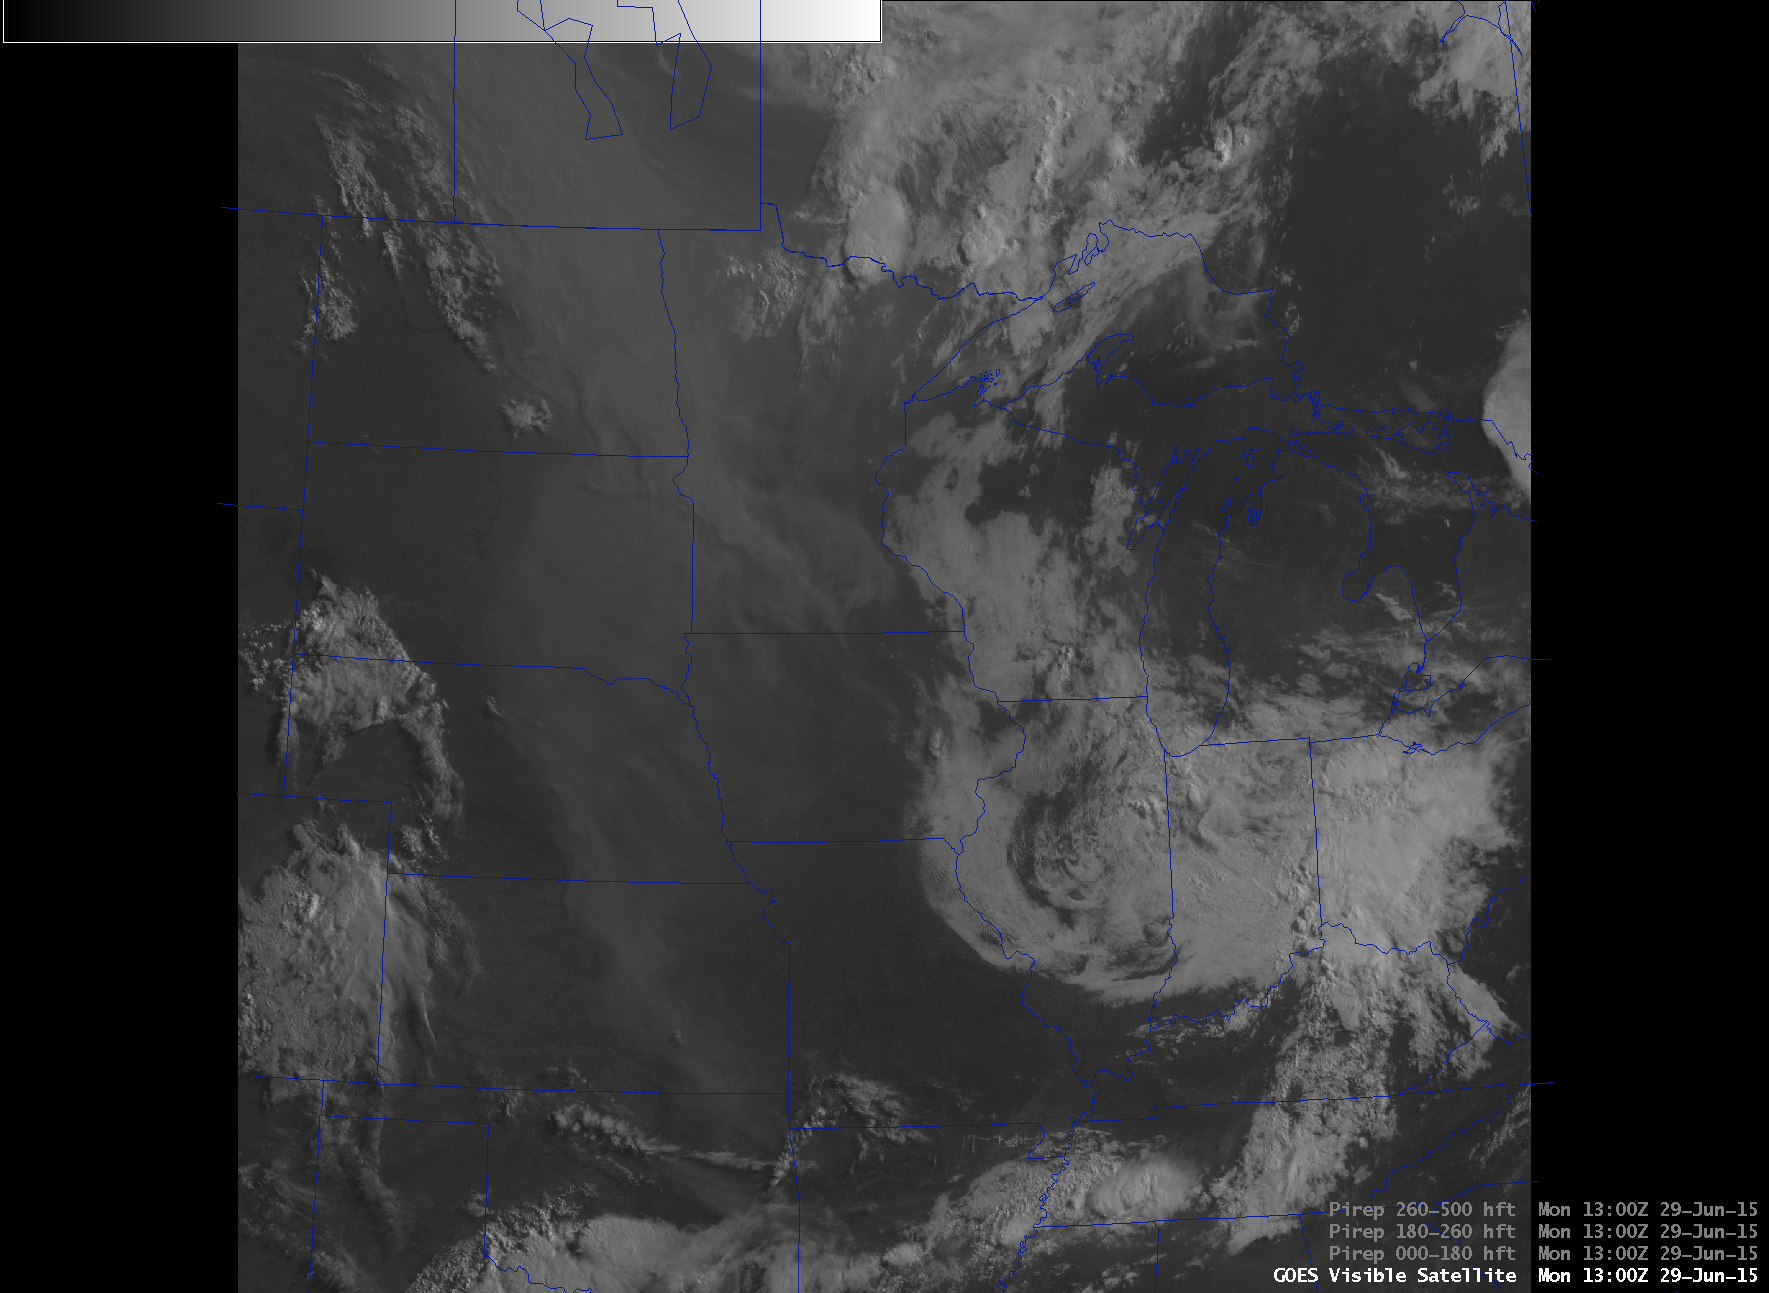
GOES-13 Visible (0.63 µm) imagery (click to play animation)
MODIS and VIIRS true-color imagery (click to enlarge)
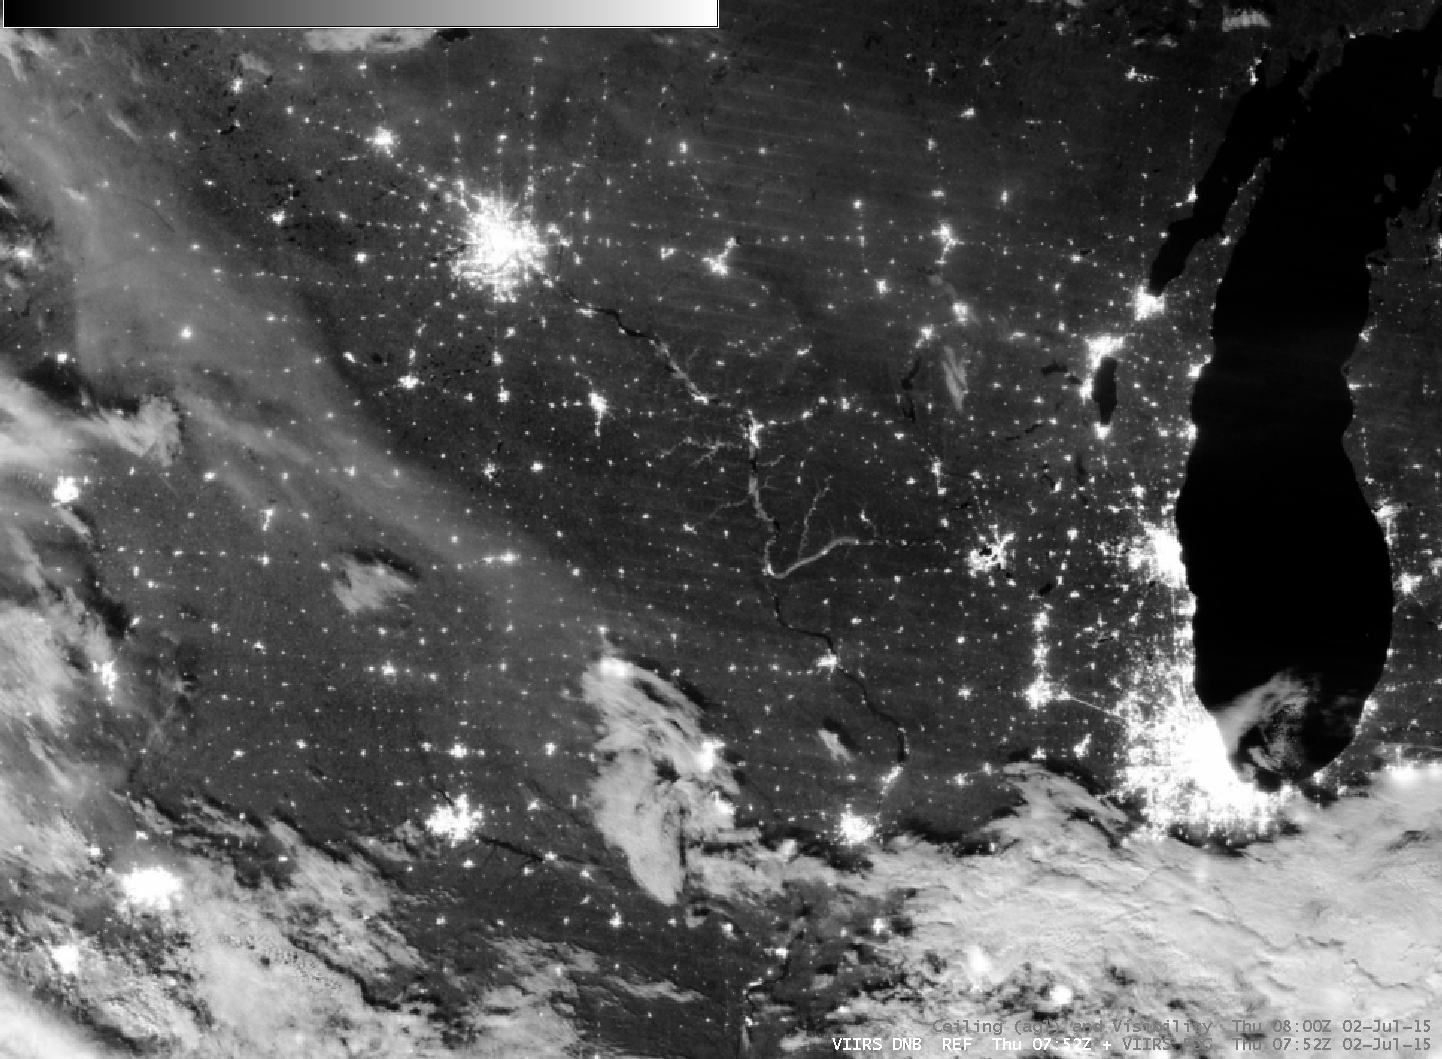
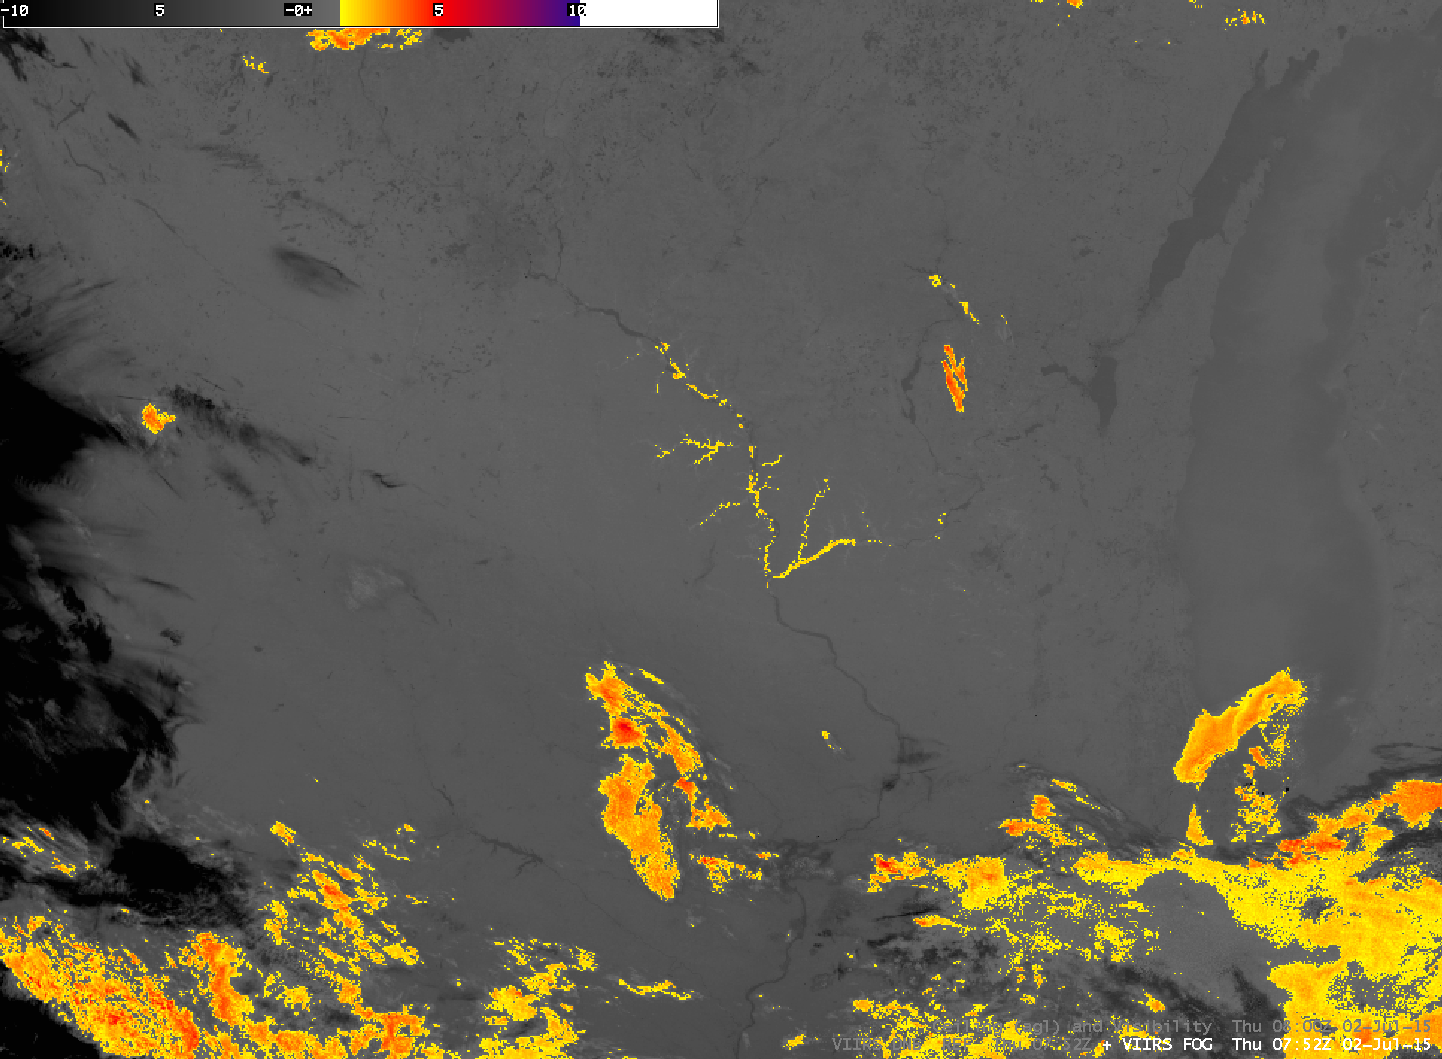
Daytime detection of smoke plumes is not difficult with visible (or true-color) imagery. At night, however, smoke detection is a challenge. The VIIRS Day/Night Band on Suomi NPP can detect smoke when Lunar Illumination is high (although detection is limited to one or sometimes two passes per night). Smoke is otherwise mostly transparent to infrared channels on the GOES Imager. Websites such as the NOAA/NESDIS IDEA and the GASP are helpful; however, the GASP product uses single-channel (visible) detection only.
Visible imagery from GOES-15, below, highlights the expansive region covered by smoke over northern Canada. Note that the smoke becomes less distinct with time as the sun rises higher in the sky, because forward scattering of visible light by smoke particles is more effective than backward scattering.

GOES-15 Visible (0.62 µm) imagery, times as indicated (click to animate)
View only this post
Read Less


