|
|
|
|
|
Hourly images of the NOAA GOES-12 10.7 micrometer InfraRed (IR) channel (above, left) and GOES Sounder derived Precipitable Water (above, right) show the evolution of Katrina during the 25-29 August 2005 period. On 25 August, prior to landfall in southern Florida, Tropical Storm Katrina began to exhibit very cold cloud top temperatures (less than -80 C, light purple enhancement). Deep tropospheric moisture was abundant over much of the Gulf of Mexico prior to the arrival of Hurricane Katrina, with precipitable water (PW) values in excess of 50 mm (dark purple enhancement) -- PW values greater than 60 mm were noted around the periphery of the tropical cyclone. Heavy rainfall associated with Katrina included 16.33 inches at Perrine, Florida, 14.82 inches at Big Branch, Lousiana, 9.84 inches at Hancock, Mississippi, and 7.9 inches in Charlevoix, Quebec.
After the tropical cyclone entered the Gulf of Mexico on 26 August, there were two factors that favored continued intensification: (1) the storm was moving into a low-shear environment, as indicated by GOES winds derived shear products (below, left), and (2) warm sea surface temperatures were in place across the northern portion of the Gulf, as shown by the warm brightness temperatures on Terra MODIS IR imagery (below, right).

|
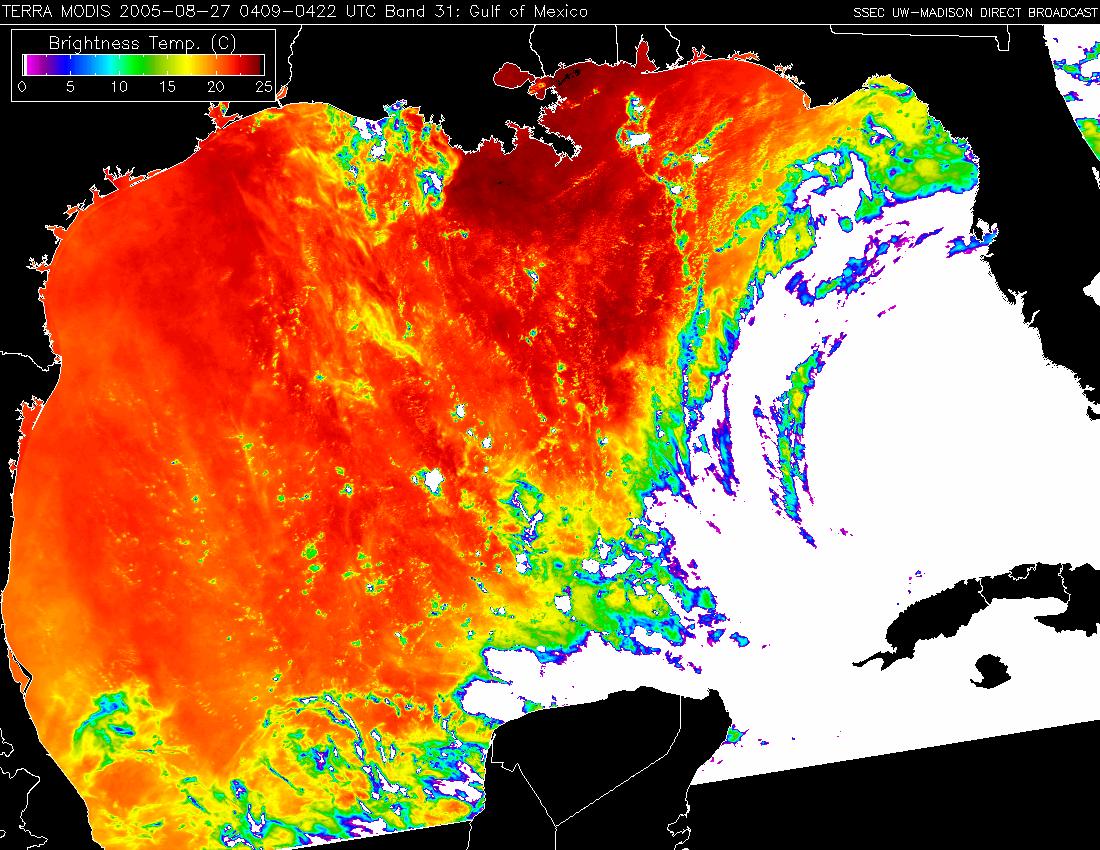
Terra MODIS IR image (04 UTC 27 August)
|

|
During the day on 27 August, 5-minute interval GOES-12 Rapid Scan Operations (RSO) IR imagery (above) revealed a series of convective bursts near the center of the storm, followed by rapid axisymmetrization of these features as they wrapped around the eye. On 28 August, as Katrina quickly intensified to Category 5 strength (with wind speeds in excess of 150 mph), the large eye (aircraft photos) began to take on a more classic appearance in the IR and visible imagery (below). The 902 hPa central pressure measured at 17:55 UTC and 19:23 UTC on 28 August was the 4th lowest pressure on record for a hurricane in the Atlantic basin.
|
|

