
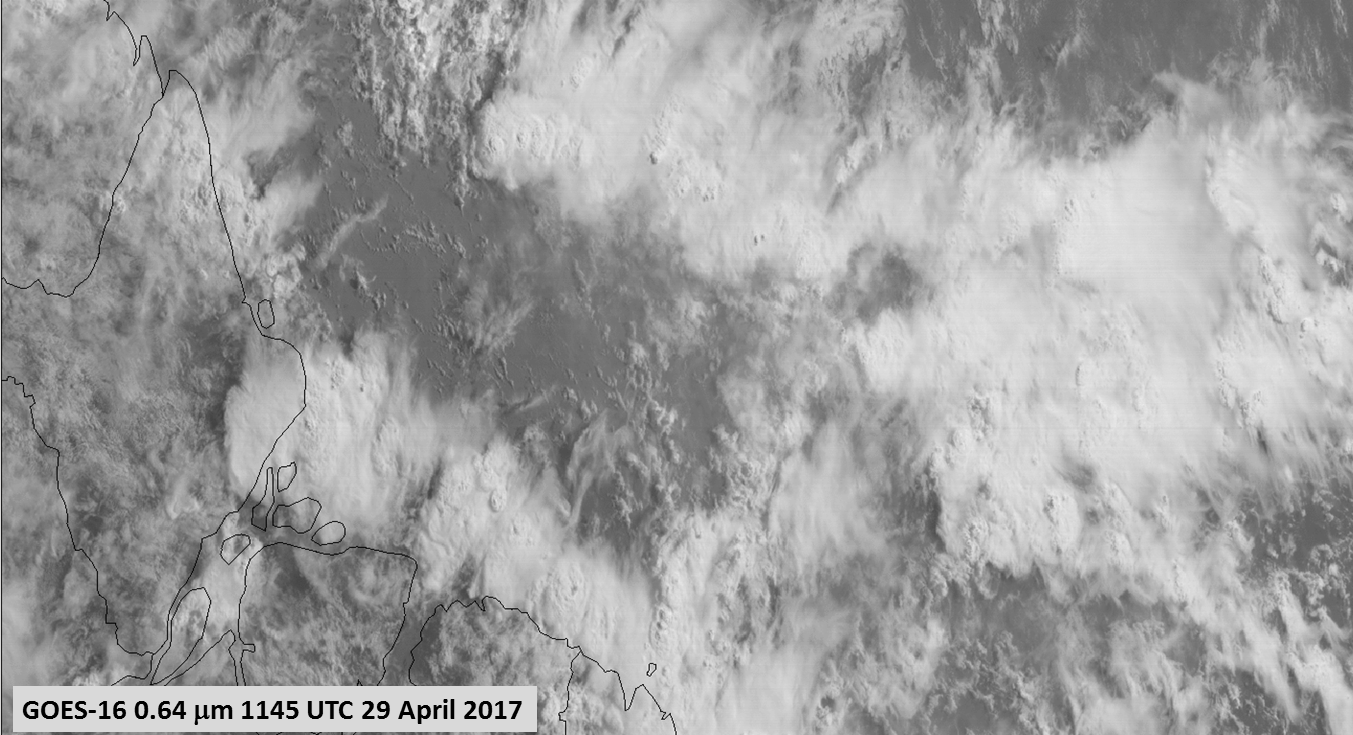
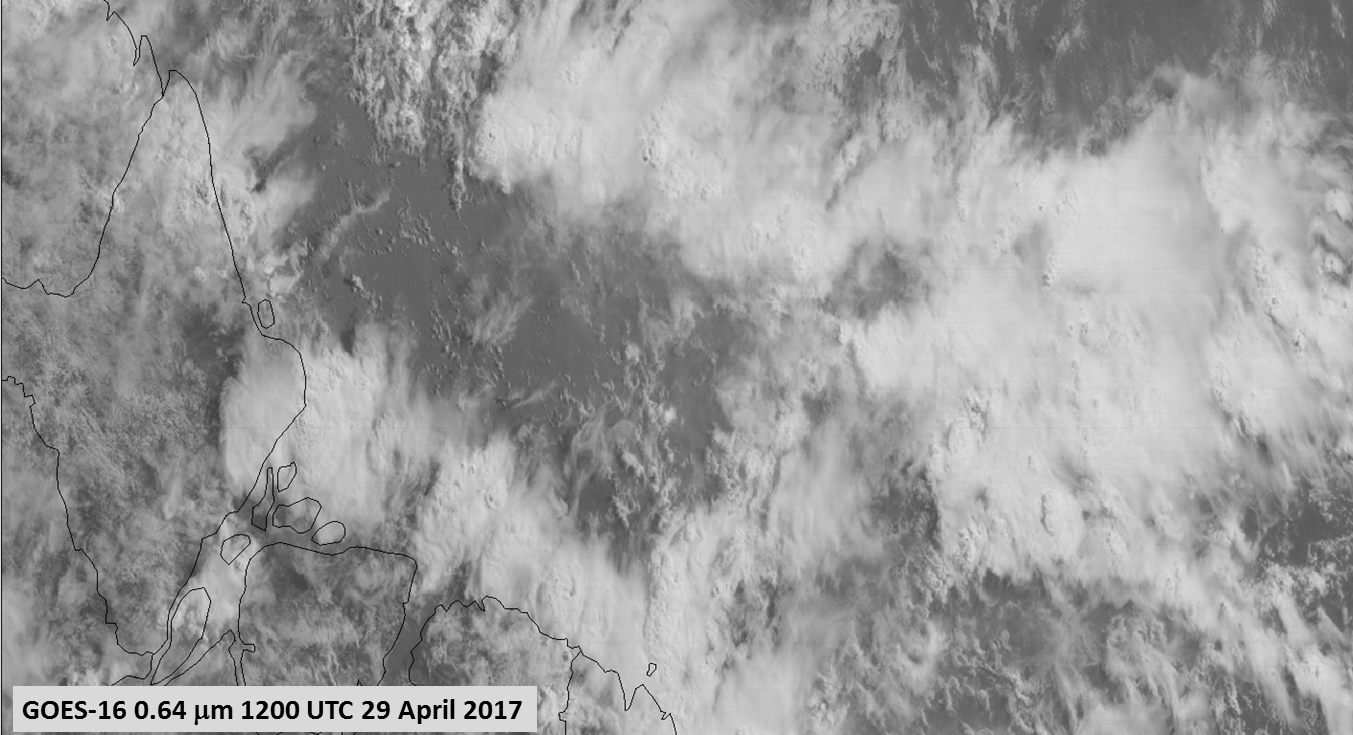
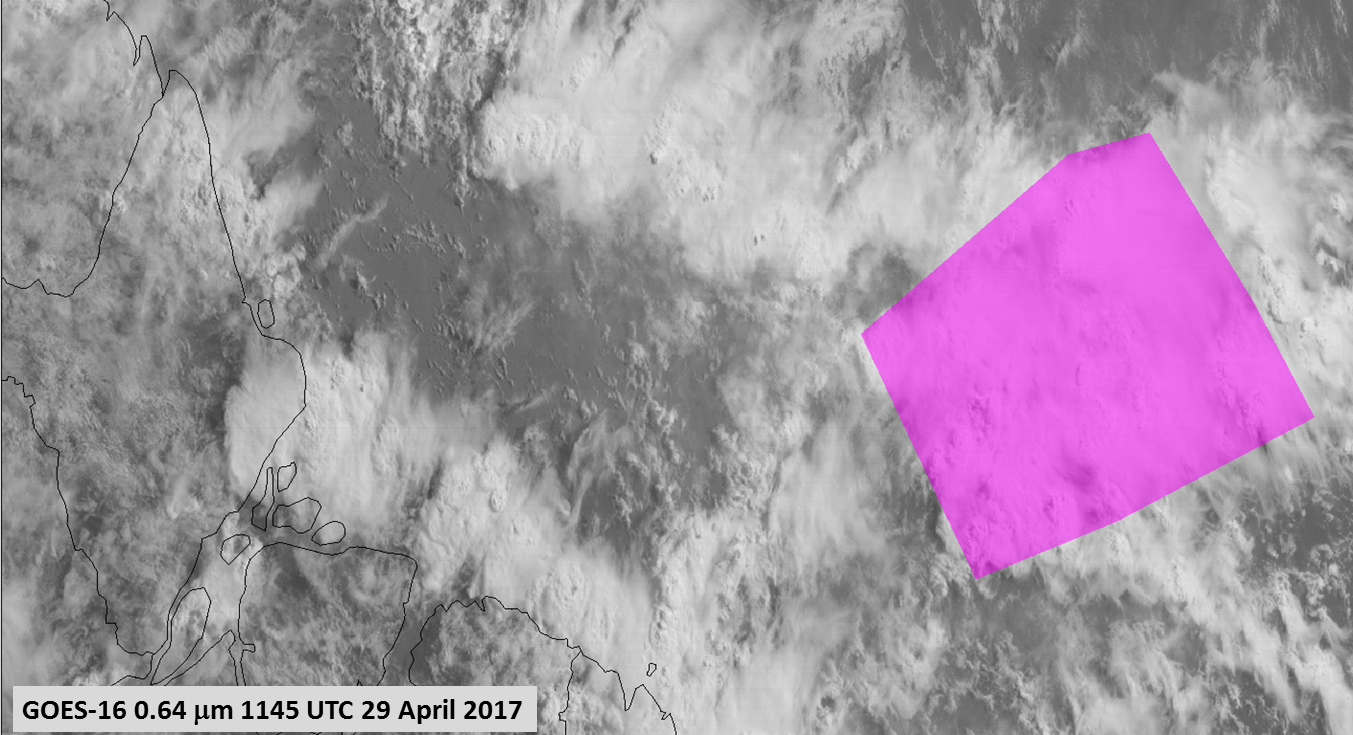
GOES-16 Visible (0.64) Imagery at 1145 UTC and 1200 UTC on 29 April 2017, before and after, respectively, a calibration change (Click to enlarge)
Reflectance values detected near Solar Noon over thick clouds can exceed 1 (i.e., the albedo will exceed 100%) because of contributions (caused by scattering) to a pixel from neighboring pixels. A fix that allows for these larger-than-one reflectance values in the GOES-16 Processing is scheduled to take place in July. Until July the values exceeding one will be treated as missing in AWIPS. The change discussed in this blog post, below, implemented on 29 April 2017, should reduce the number of those missing pixels.
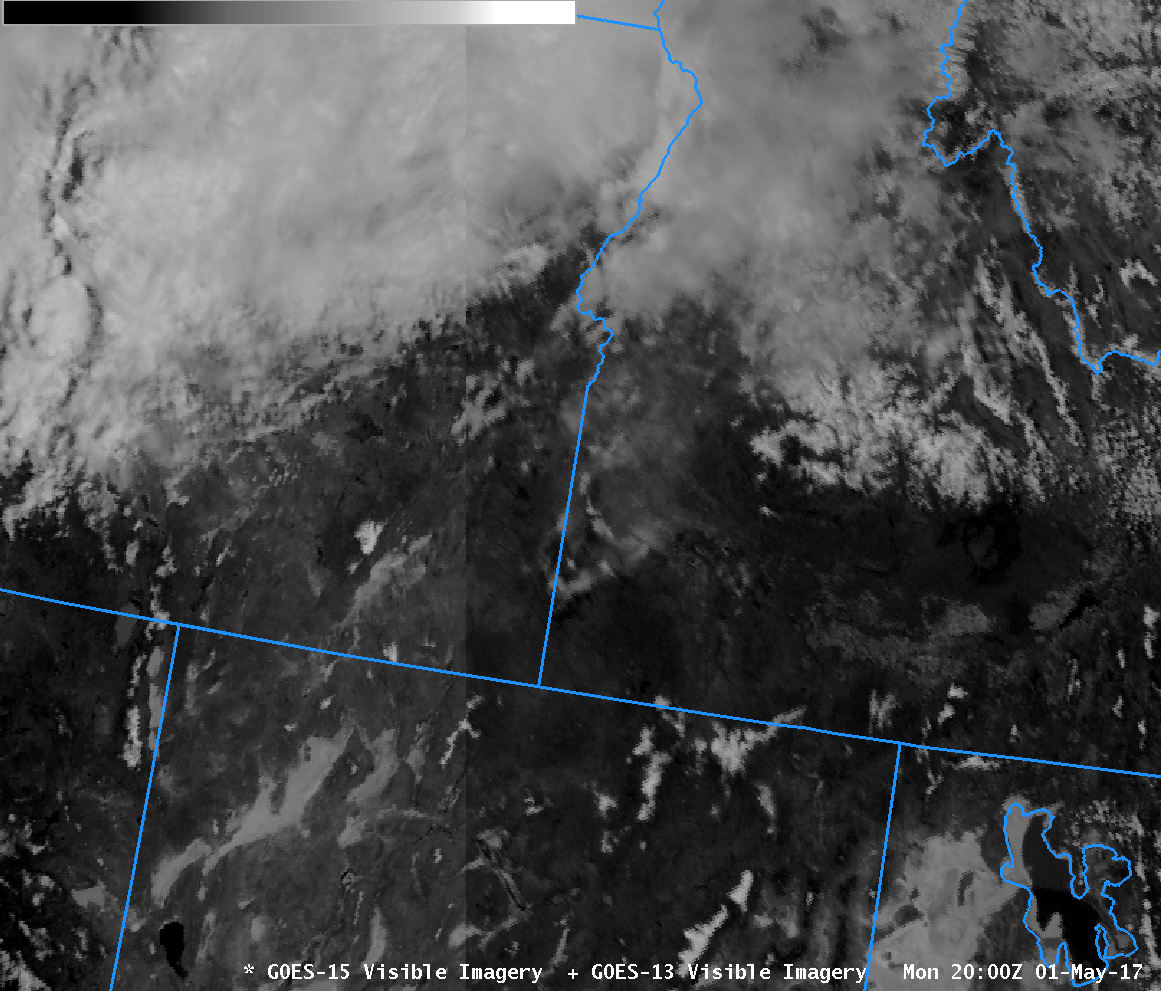
GOES-16 has on-orbit calibration of visible and near-infrared channels. This is in contrast to legacy GOES (GOES-13, GOES-14 and GOES-15); the lack of on-orbit calibration means that visible imagery from GOES-13 and GOES-15 show different reflectance values, as shown in this image from 2000 UTC on 01 May 2017: GOES-13 shows smaller reflectance (the right half of the image) than GOES-15 (the left half of the image). Such degradation should not occur with GOES-16.
On-orbit calibration is achieved by viewing the Sun for a set period and determining the photons detected. That value is then related to the amount of solar energy reflected back from the Earth from bright surfaces. It’s important that the exact amount of time for the solar view is known; otherwise the reflectance cannot be calibrated correctly.
NESDIS Engineers and the NOAA CWG (Calibration Working Group) determined in April that visible and near-infrared reflectances were too large (by up to 10%) because the amount of time viewing the Sun was different than the time-value used in the calibration. Shortly before 1200 UTC on 29 April a change in the calibration module was made to mitigate this mis-match. Reflectances dropped about 10% because of this calibration change.
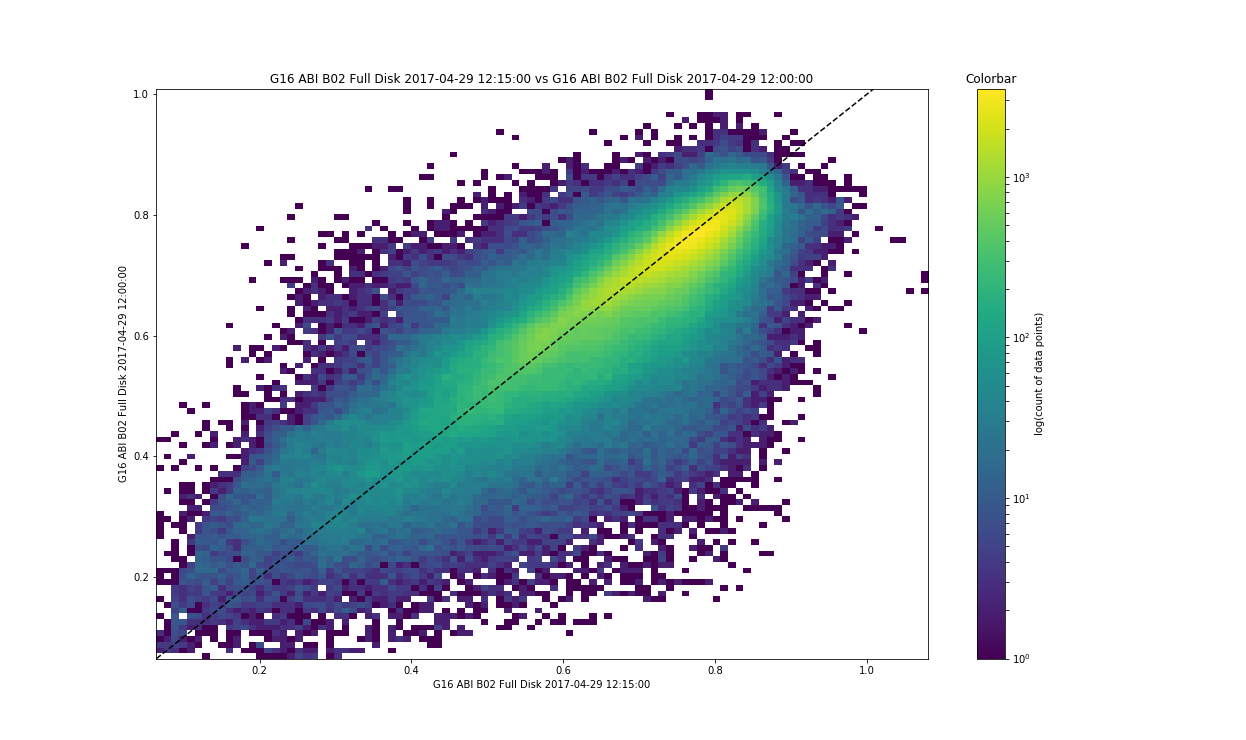
The animation above shows GOES-16 0.64 imagery before and after the calibration change and it’s difficult to note a reduction in the brightness; however, a scatterplot of the reflectance over the convection that is over the tropical Atlantic east of the Amazon (click here to see the region, it is shaded in purple; this image shows the 1145 UTC image with the region toggled on and off) does show higher values at 1145 vs. 1200 UTC, at a time during the day when the rising Sun should cause increases in reflectance. (A similar plot of 1215 UTC vs. 1200 UTC shows reflectance values with no bias).
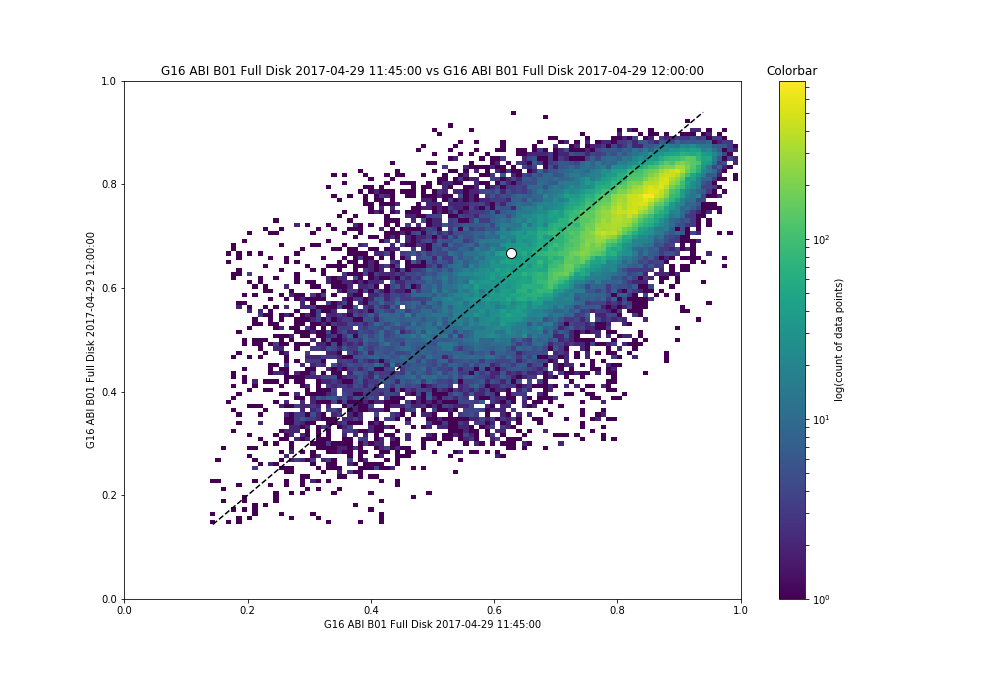
Density Diagram of GOES-16 Reflectance Values at 1145 UTC (x-axis) vs. GOES-16 Reflectance Values at 1200 UTC (y-axis) (Click to enlarge)
Imagery in this blog post was created using the Satellite Information Familiarization Tool (SIFT).
GOES-16 data posted on this page are preliminary, non-operational data and are undergoing testing.
View only this post Read Less
![GOES-16 Visible (0.64 µm) images, with surface winds (knots) plotted in cyan [click to play animation]](https://cimss.ssec.wisc.edu/satellite-blog/wp-content/uploads/sites/5/2017/04/170427_goes16_visible_surface_winds_ME_MA_undular_bores_anim.gif)
![GOES-16 Visible (0.64 µm, left) and GOES-13 Visible (0.63 µm, right) images [click to play animation]](https://cimss.ssec.wisc.edu/satellite-blog/wp-content/uploads/sites/5/2017/04/170427_goes16_goes13_visible_surface_winds_ME_MA_undular_bores_anim.gif)
![GOES-16 Infrared Window (10.3 µm) images [click to play MP4 animation]](https://cimss.ssec.wisc.edu/satellite-blog/wp-content/uploads/sites/5/2017/04/960x1280_AGOES16_B13_G16_IR_ME_MA_BORES_26-27APR2017_2017116_120720_0001PANEL.GIF)
![GOES-16 Blue Visible (0.47 µm, top), Red Visible (0.64 µm, center) and Shortwave Infrared (3.9 µm, bottom) images, with hourly surface plots in yellow [click to play animation]](https://cimss.ssec.wisc.edu/satellite-blog/wp-content/uploads/sites/5/2017/04/170425_goes16_visible_shortwaveIR_GA_fires_zoom_anim.gif)
![Spectral Response Function plots for GOES-16 ABI Band 5 (1.61 µm), Band 6 (2.24 µm) and Band 7 (3.9 µm) [click to enlarge]](https://cimss.ssec.wisc.edu/satellite-blog/wp-content/uploads/sites/5/2017/04/ABI_Band_5_6_7_Spectral_Response_Functions_Fires.png)
![Full Disk images of all 16 bands of the GOES-16 ABI {click to enlarge]](https://cimss.ssec.wisc.edu/satellite-blog/wp-content/uploads/sites/5/2017/04/170422_1725utc_goes16_abi_bands_Earth_Day_anim.gif)
![GOES-16 Visible (0.64 µm) images [click to play animation]](https://cimss.ssec.wisc.edu/satellite-blog/wp-content/uploads/sites/5/2017/04/170422_goes16_visible_band2_full_disk_anim.gif)
![GOES-16 Visible (0.47 µm and 0.64 µm) and Near Infrared (0.86 µm) images [click to enlarge]](https://cimss.ssec.wisc.edu/satellite-blog/wp-content/uploads/sites/5/2017/04/170422_1725utc_goes16_visible_band1_band2_band3_Amazon_River_anim.gif)
