
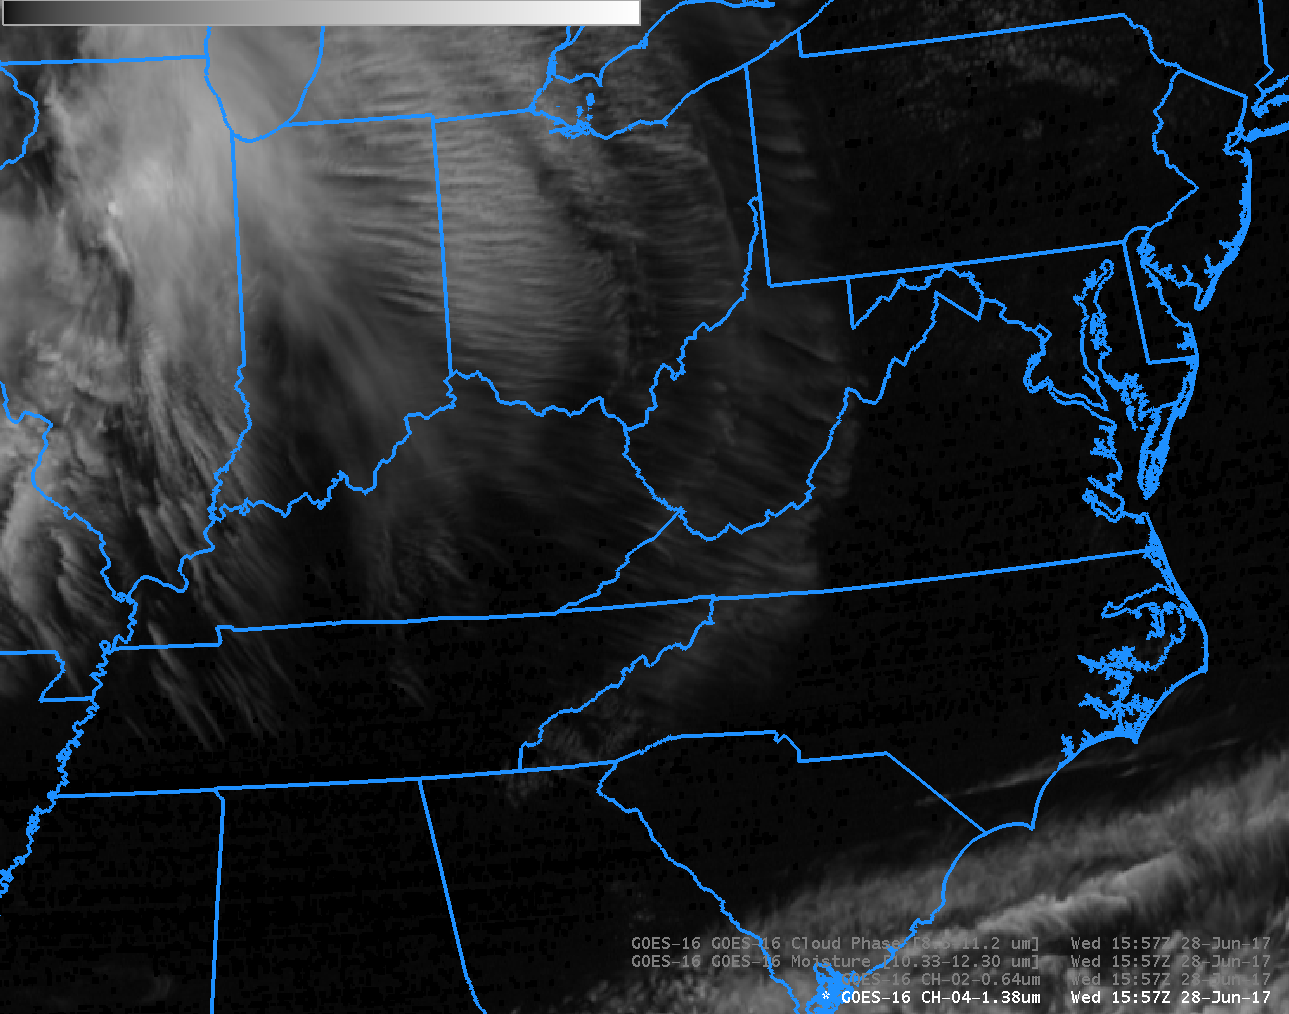
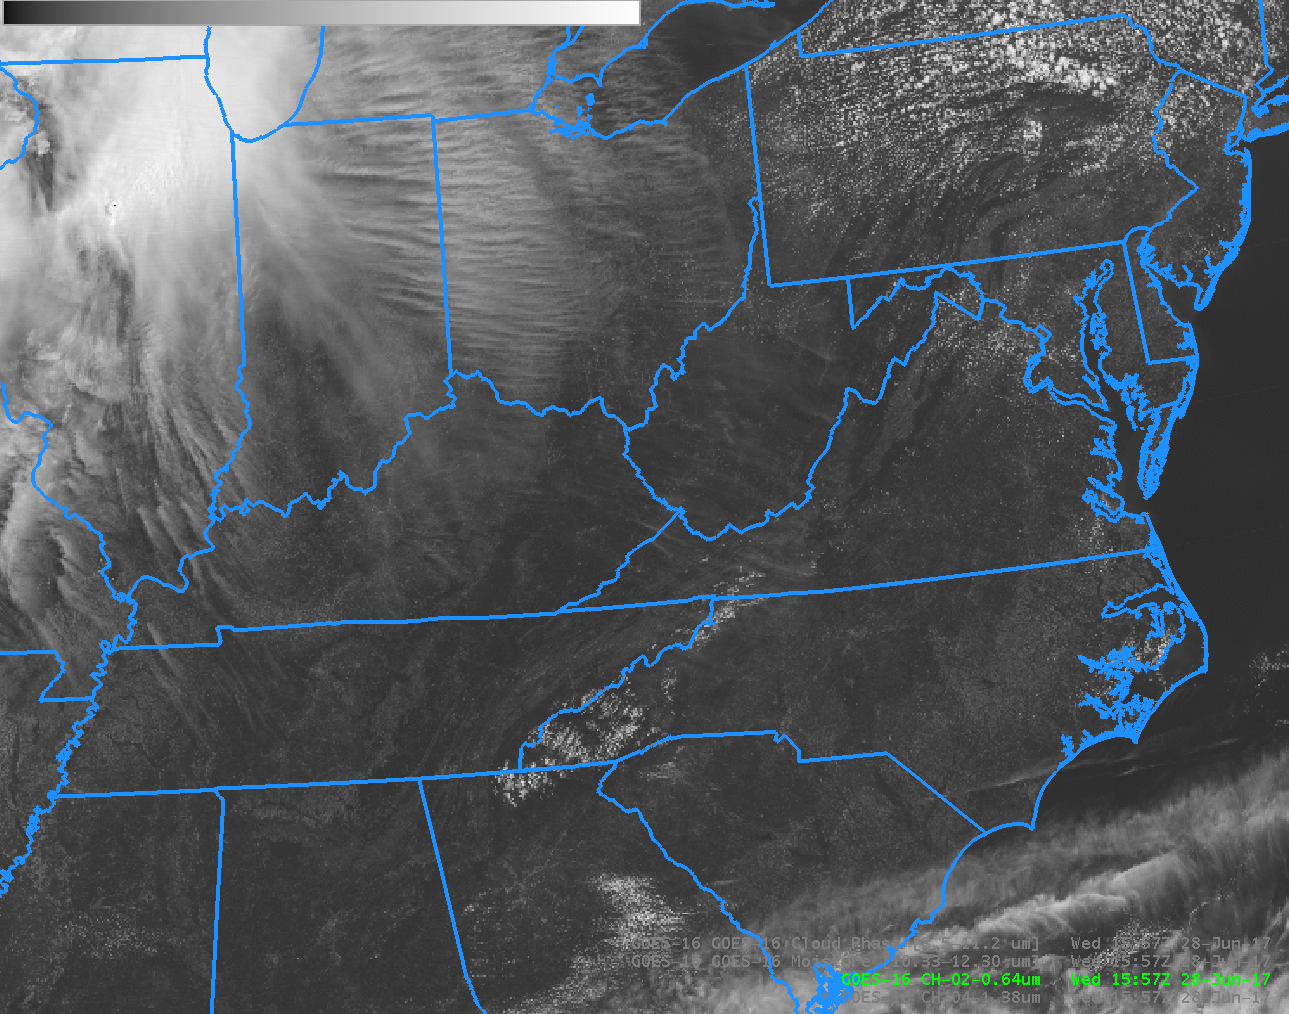
GOES-16 Visible Image (0.64 µm) at 1557 UTC on 28 June 2017 (Click to enlarge)
GOES-16 data posted on this page are preliminary, non-operational data and are undergoing testing
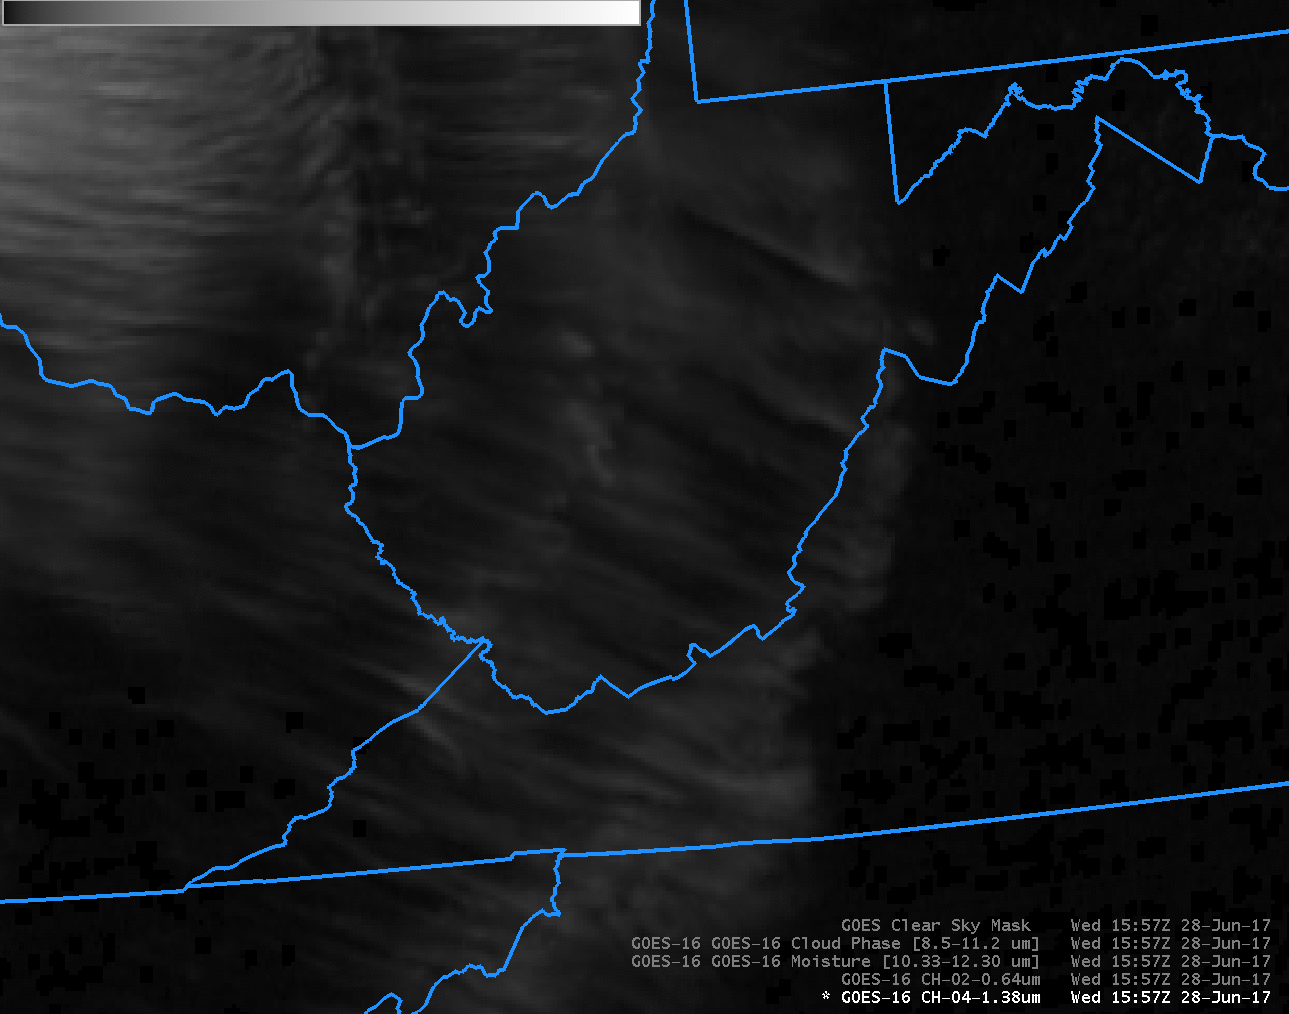
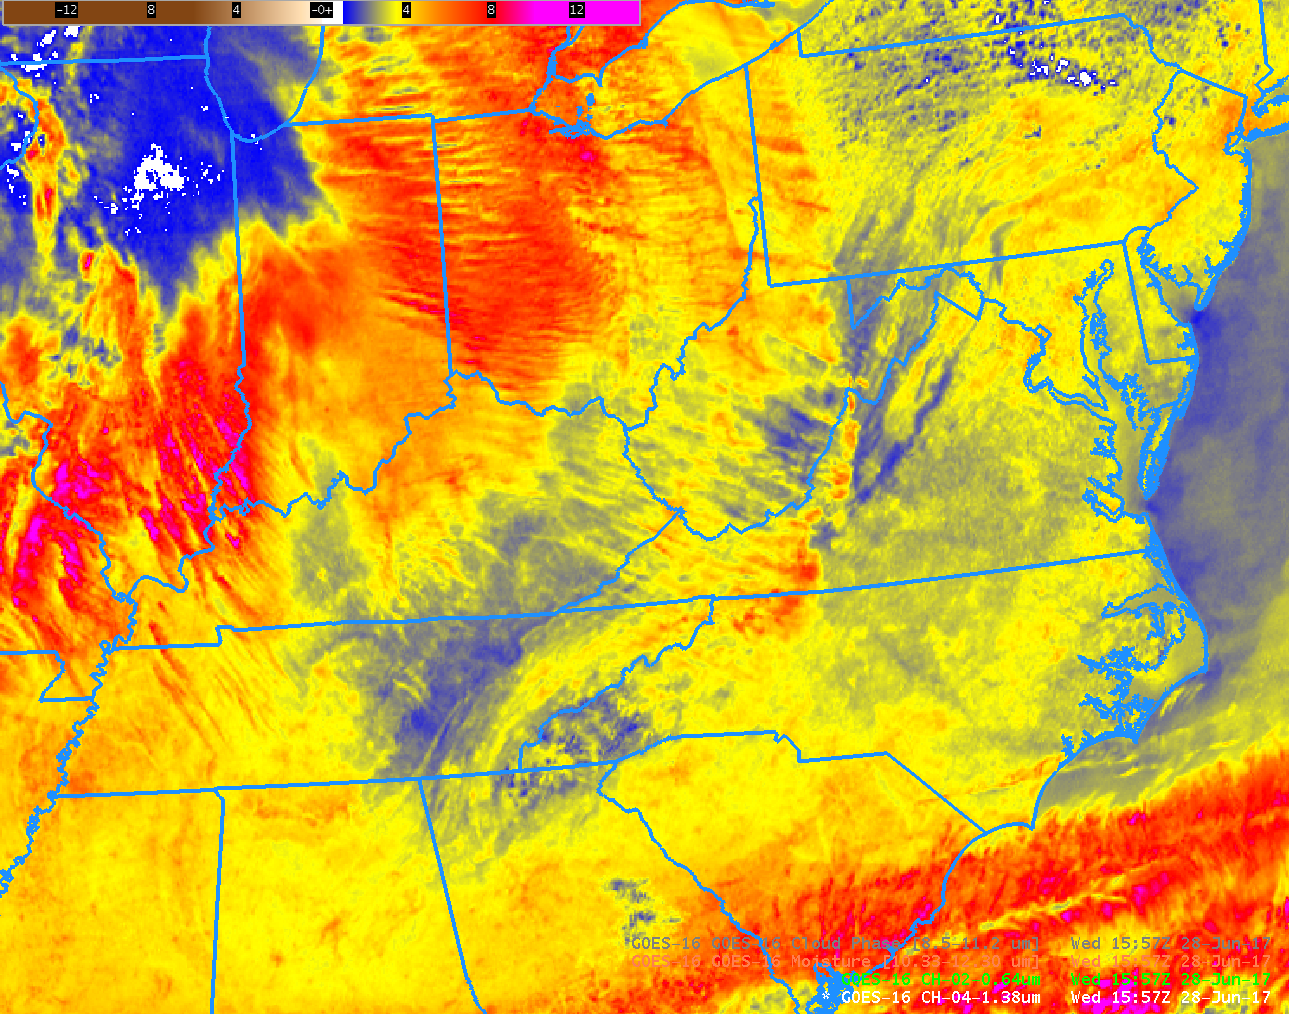
Consider the visible image above. Can you tell where the eastern and southern edge of the cirrus shield is over the eastern United States? When the Sun is not on the horizon, thin cirrus can be very hard to detect in visible imagery because cirrus clouds are not efficient back-scatterers of solar radiation (all clouds forward-scatter very effectively, but cirrus are optically thin). In a still image, then, with a high sun angle, cirrus can be hard to discern. There are brightness temperature difference fields that can also be used to infer the presence of cirrus. For example, the Split Window Difference field (10.3 µm – 12.3 µm) and the Cloud Phase Difference (8.5 µm – 11.2 µm), toggled below, will highlight regions of cloudiness. But do they also capture very thin cirrus?

Split Window Difference field (10.3 µm – 12.3 µm) and the Cloud Phase Difference (8.5 µm – 11.2 µm) fields at 1557 UTC on 28 June 2017 (Click to enlarge)
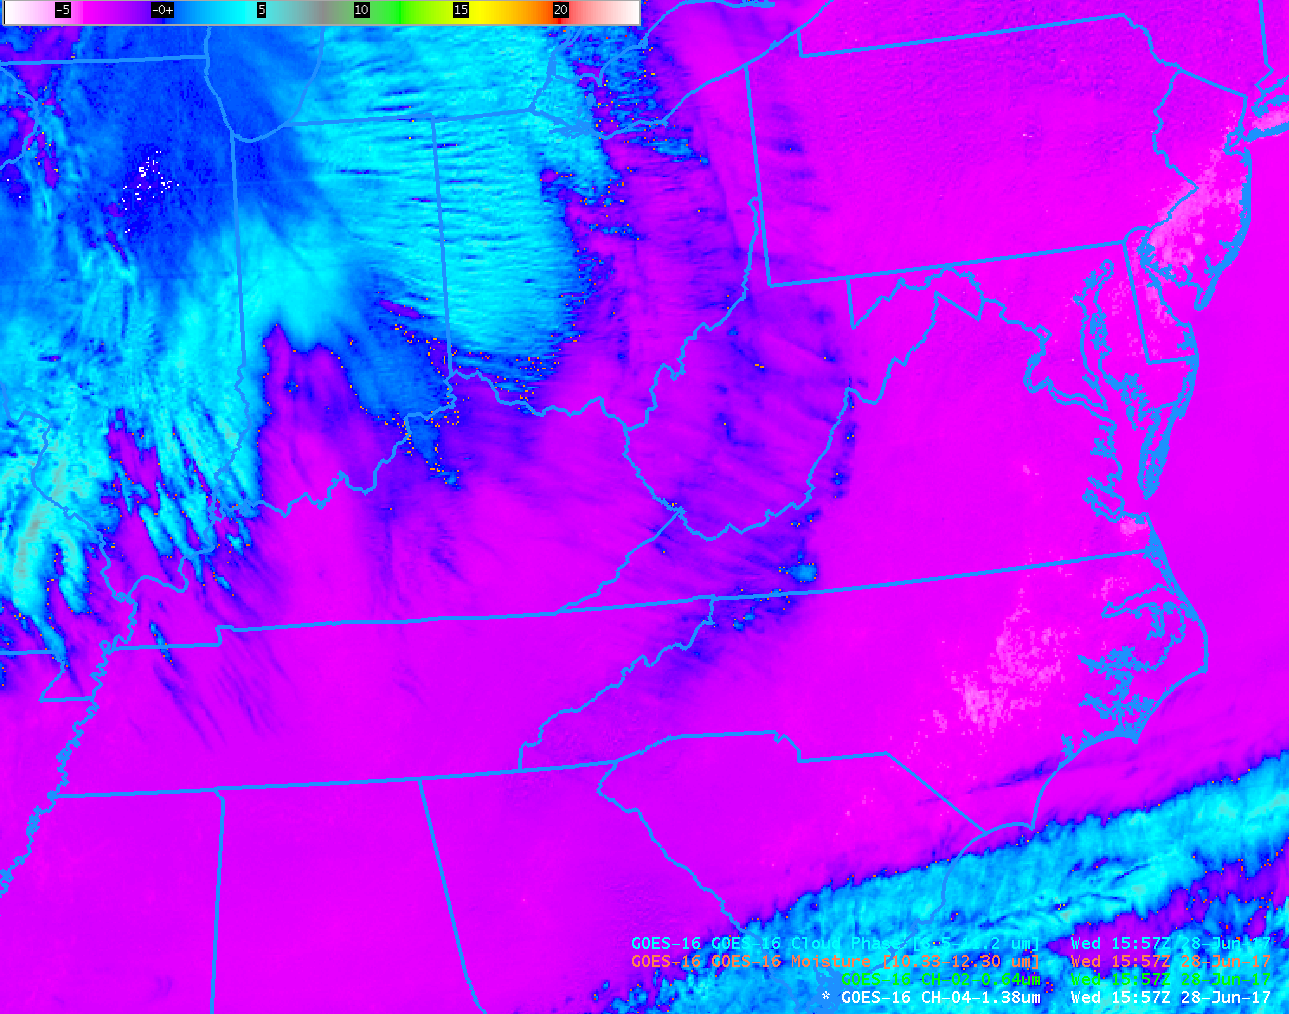
The Cirrus Channel on GOES-16 (1.38 µm), below, better captures the areal extent of the cirrus. This is because it is very sensitive to reflective features such as cirrus clouds, and because it is in a region of the electromagnetic spectrum where water vapor absorption occurs — so surface features that might complicate the interpretation are masked (Note, for example, that cumuliform clouds over Northwestern Pennsylvania are not apparent in the Cirrus Band imagery). Click here to toggle between all 4 images.
GOES-16 “Cirrus Channel” (Band 4, 1.38 µm) fields at 1557 UTC on 28 June 2017 (Click to enlarge)
One of the GOES-16 Baseline Products is a Cloud Mask — this is important because many other Baseline Products use the output from the Cloud Mask in decision trees. The toggle below shows the Cirrus Band (1.38 µm), the Red Visible (0.64 µm) and the Cloud Mask for 1557 UTC on 28 June 2017.
GOES-16 “Cirrus Band” (Band 4, 1.38 µm), “Red Visible” (0.64 µm) and Cloud Mask Baseline Product (White=Cloud, Black= Clear) (Click to enlarge)
View only this post Read Less
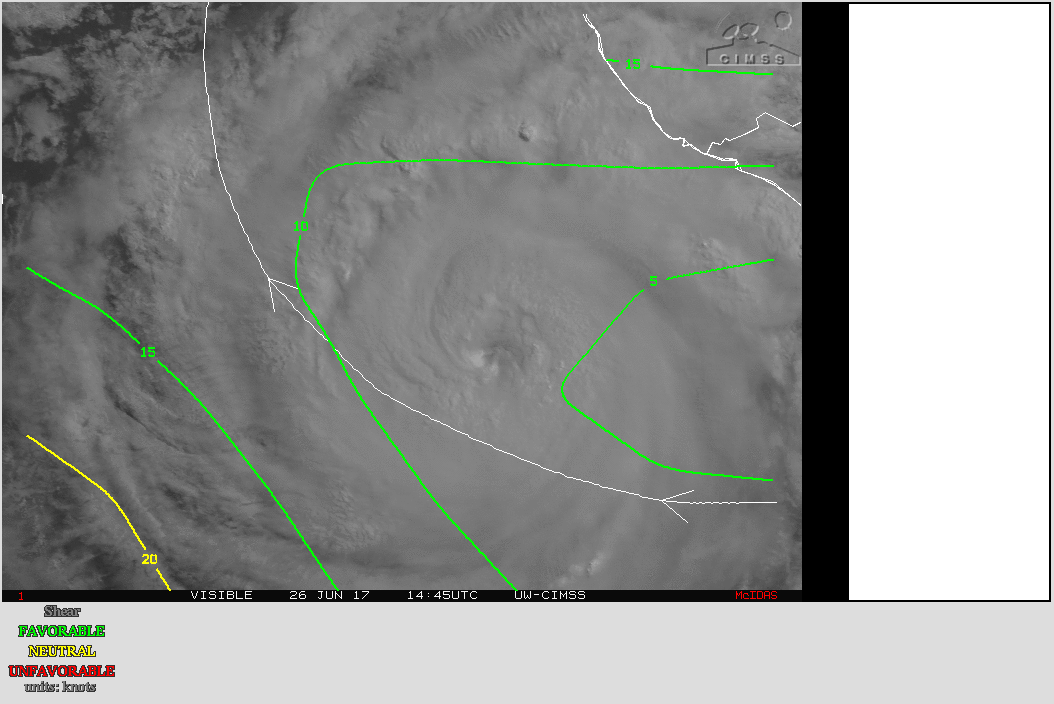
![GOES-16 Infrared Window (10.3 µm) images, with SPC storm reports of wind and hail [click to play MP4 animation]](https://cimss.ssec.wisc.edu/satellite-blog/wp-content/uploads/sites/5/2017/06/G16_IR_WY_SD_NE_SPC_27-28JUN2017_960x1280_B13_2017179_020027_0001PANEL.GIF)
![GOES-16 Visible (0.64 µm) and Infrared Window (10.3 µm) images [click to play MP4 animation]](https://cimss.ssec.wisc.edu/satellite-blog/wp-content/uploads/sites/5/2017/06/958x638_GOES16A_B213_G16_VIS_IR_DORA_26JUN2017_2017178_000719_0002PANELS.GIF)
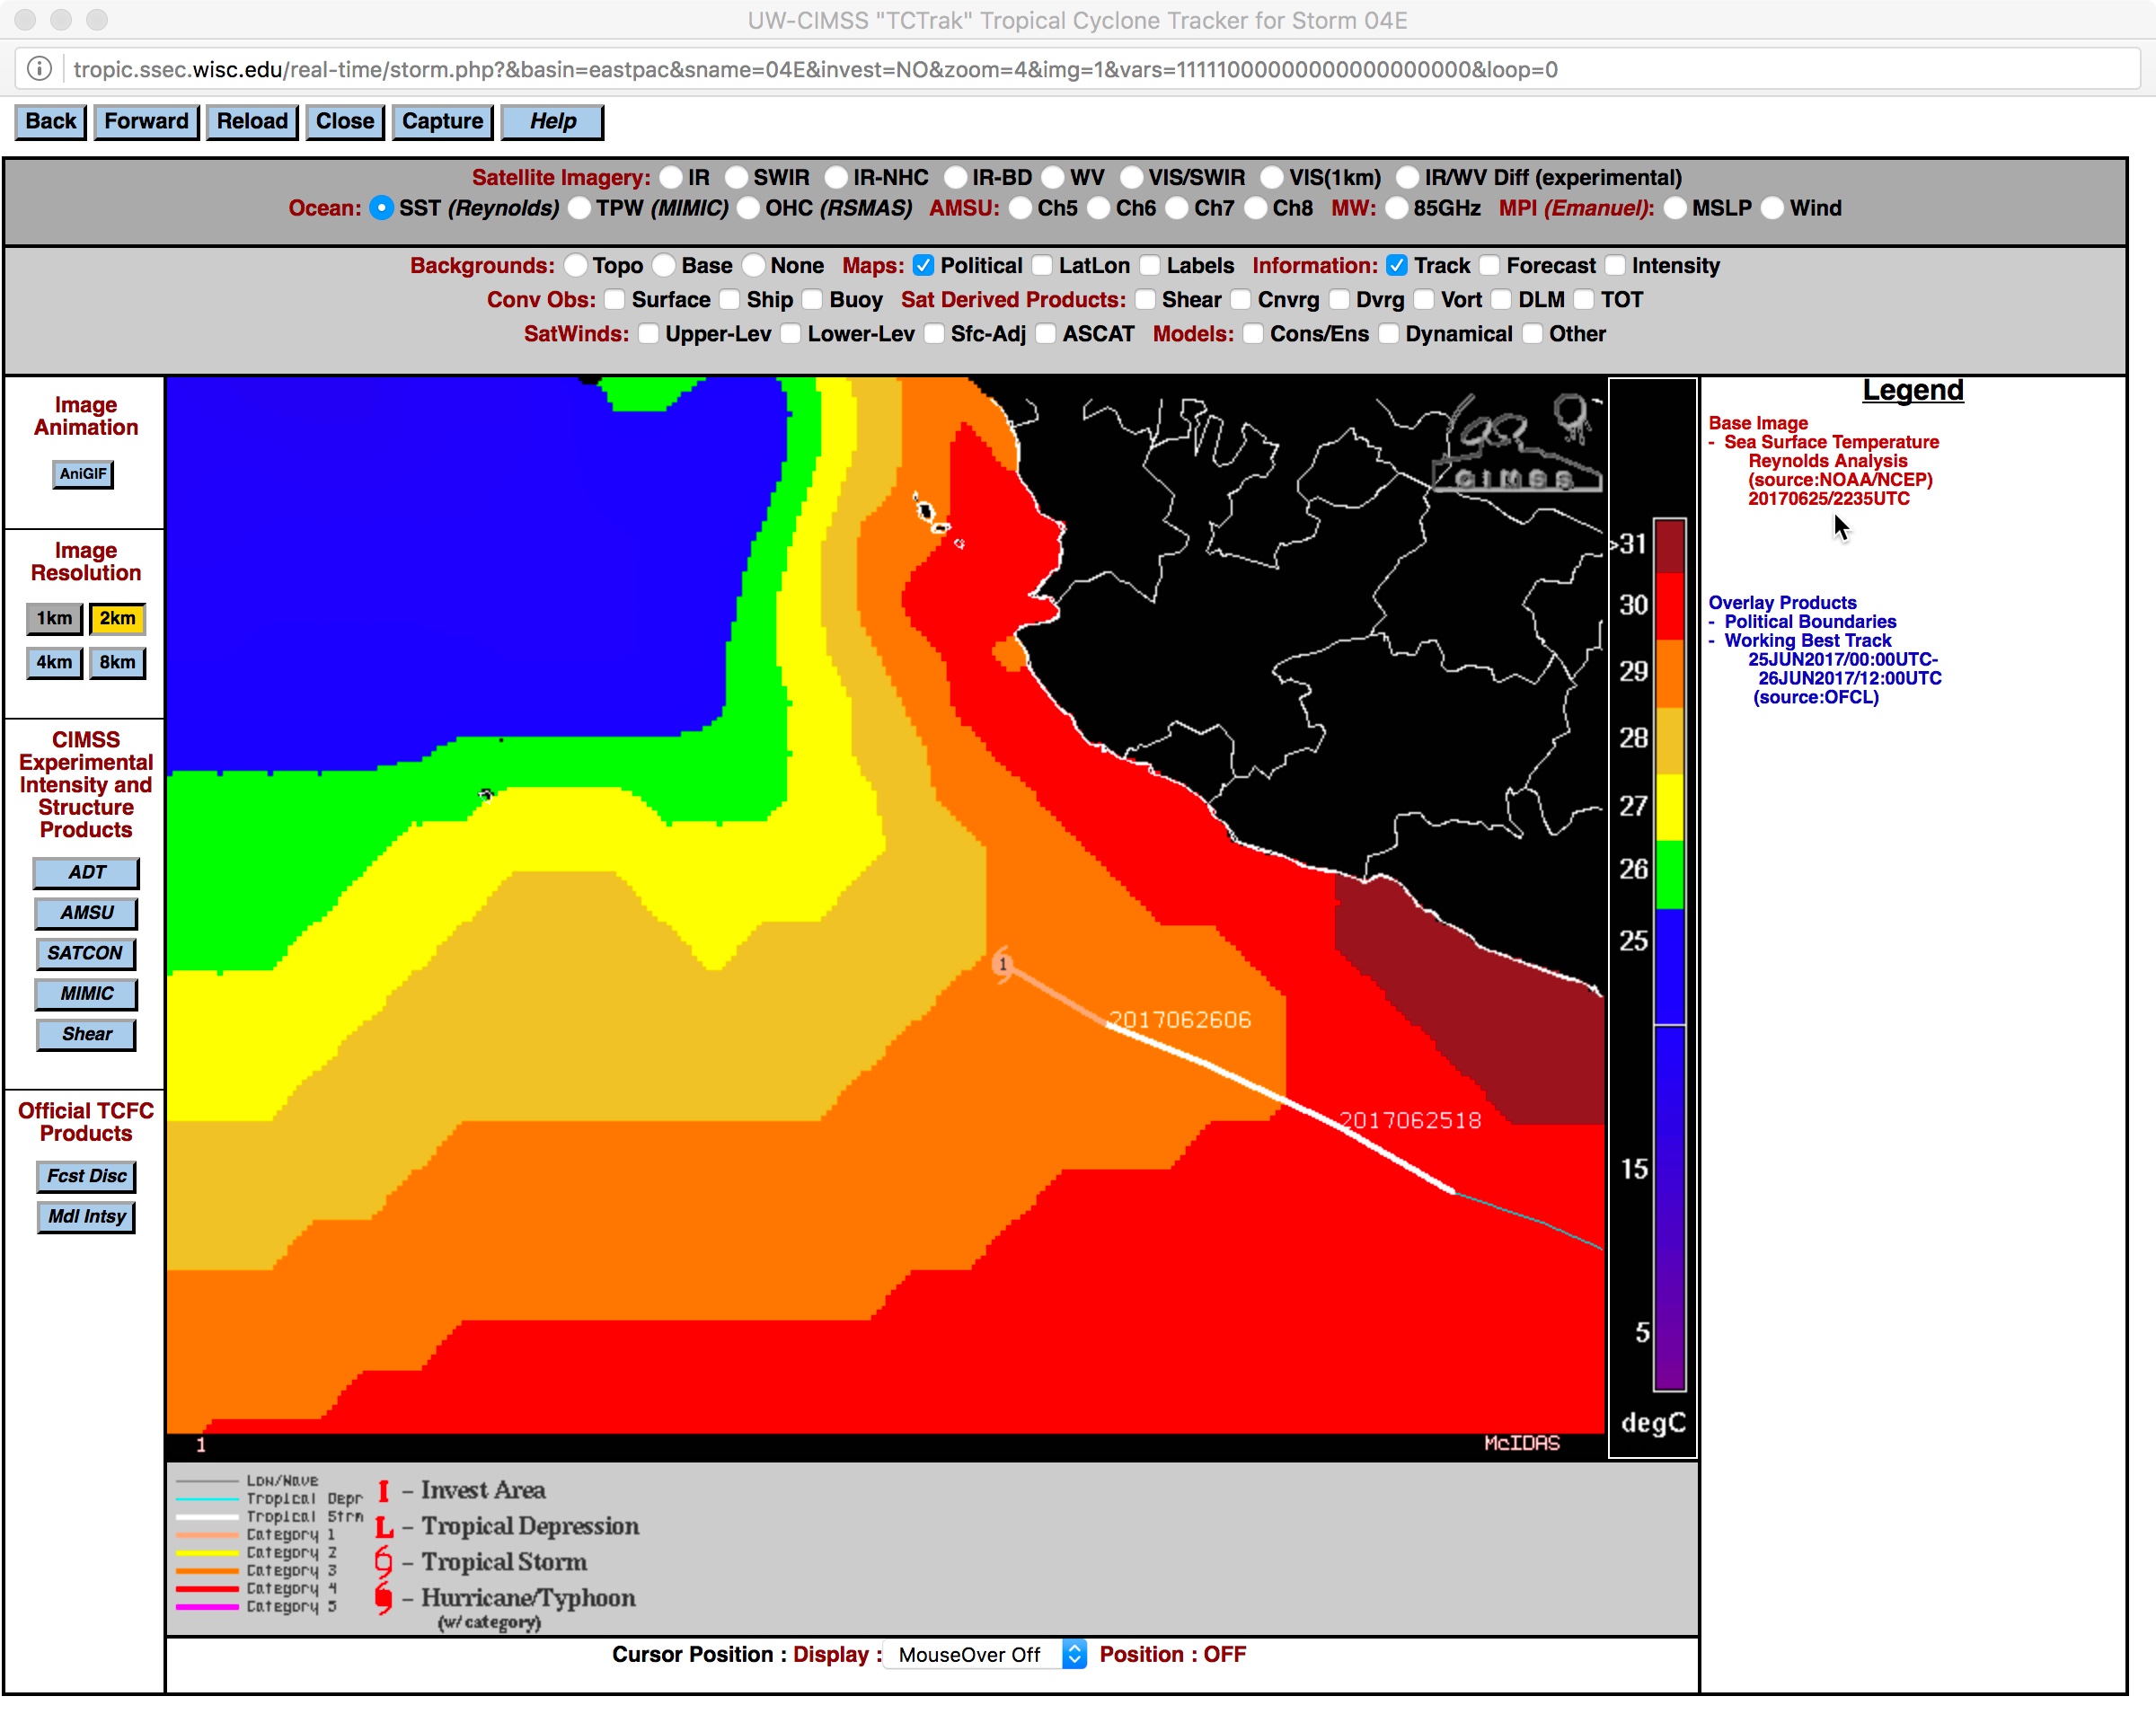
![DMSP-17 SSMIS Microwave (85 GHz) and GOES-15 Infrared Window (10.7 µm) images [click to enlarge]](https://cimss.ssec.wisc.edu/satellite-blog/wp-content/uploads/sites/5/2017/06/170626_1315utc_goes15_infrared_dmsp17_ssmis_microwave_Dora_anim.gif)
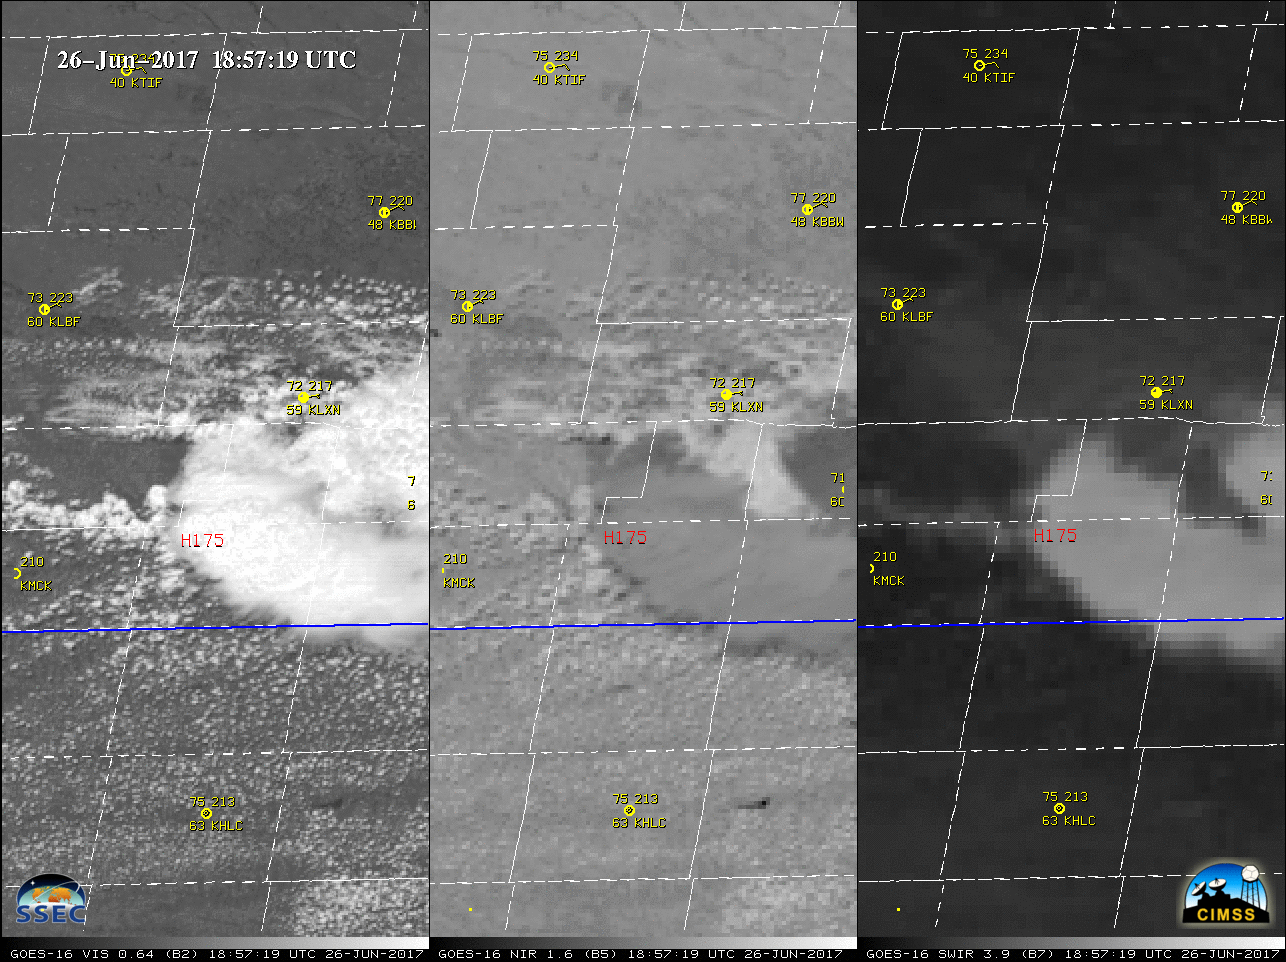
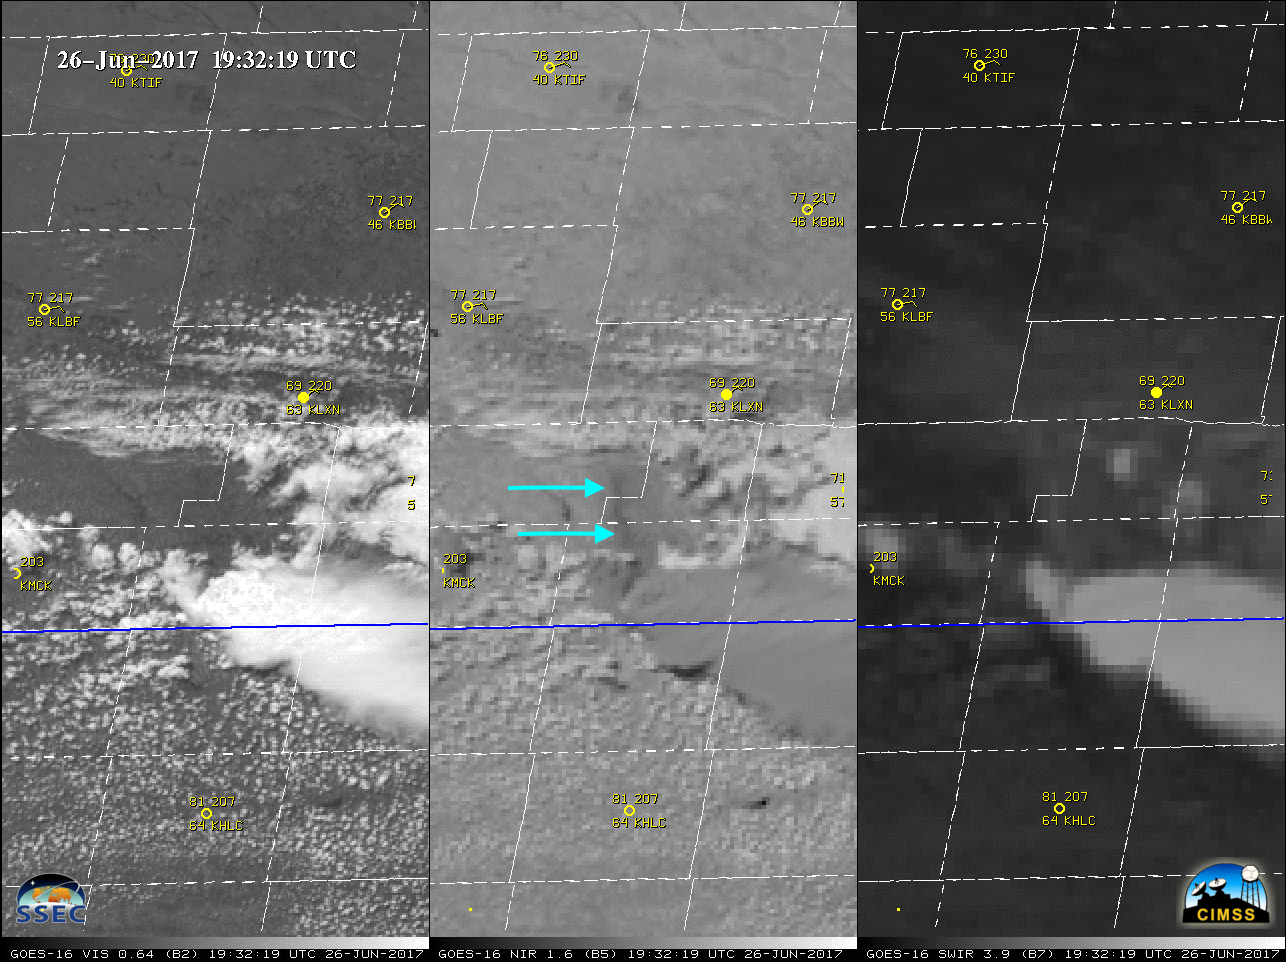
![GOES-16 Visible (0.64 µm, left), Snow/Ice (1.61 µm, center) and Shortwave Infrared (3.9 µm, right) images, with hourly surface reports plotted in yellow and SPC storm reports of hail size plotted in red [click to play MP4 animation]](https://cimss.ssec.wisc.edu/satellite-blog/wp-content/uploads/sites/5/2017/06/960x427_GOES16A_B257_G16_3PANEL_NE_HAIL_SWATH_26JUN2017_2017177_185719_0003PANELS.GIF)
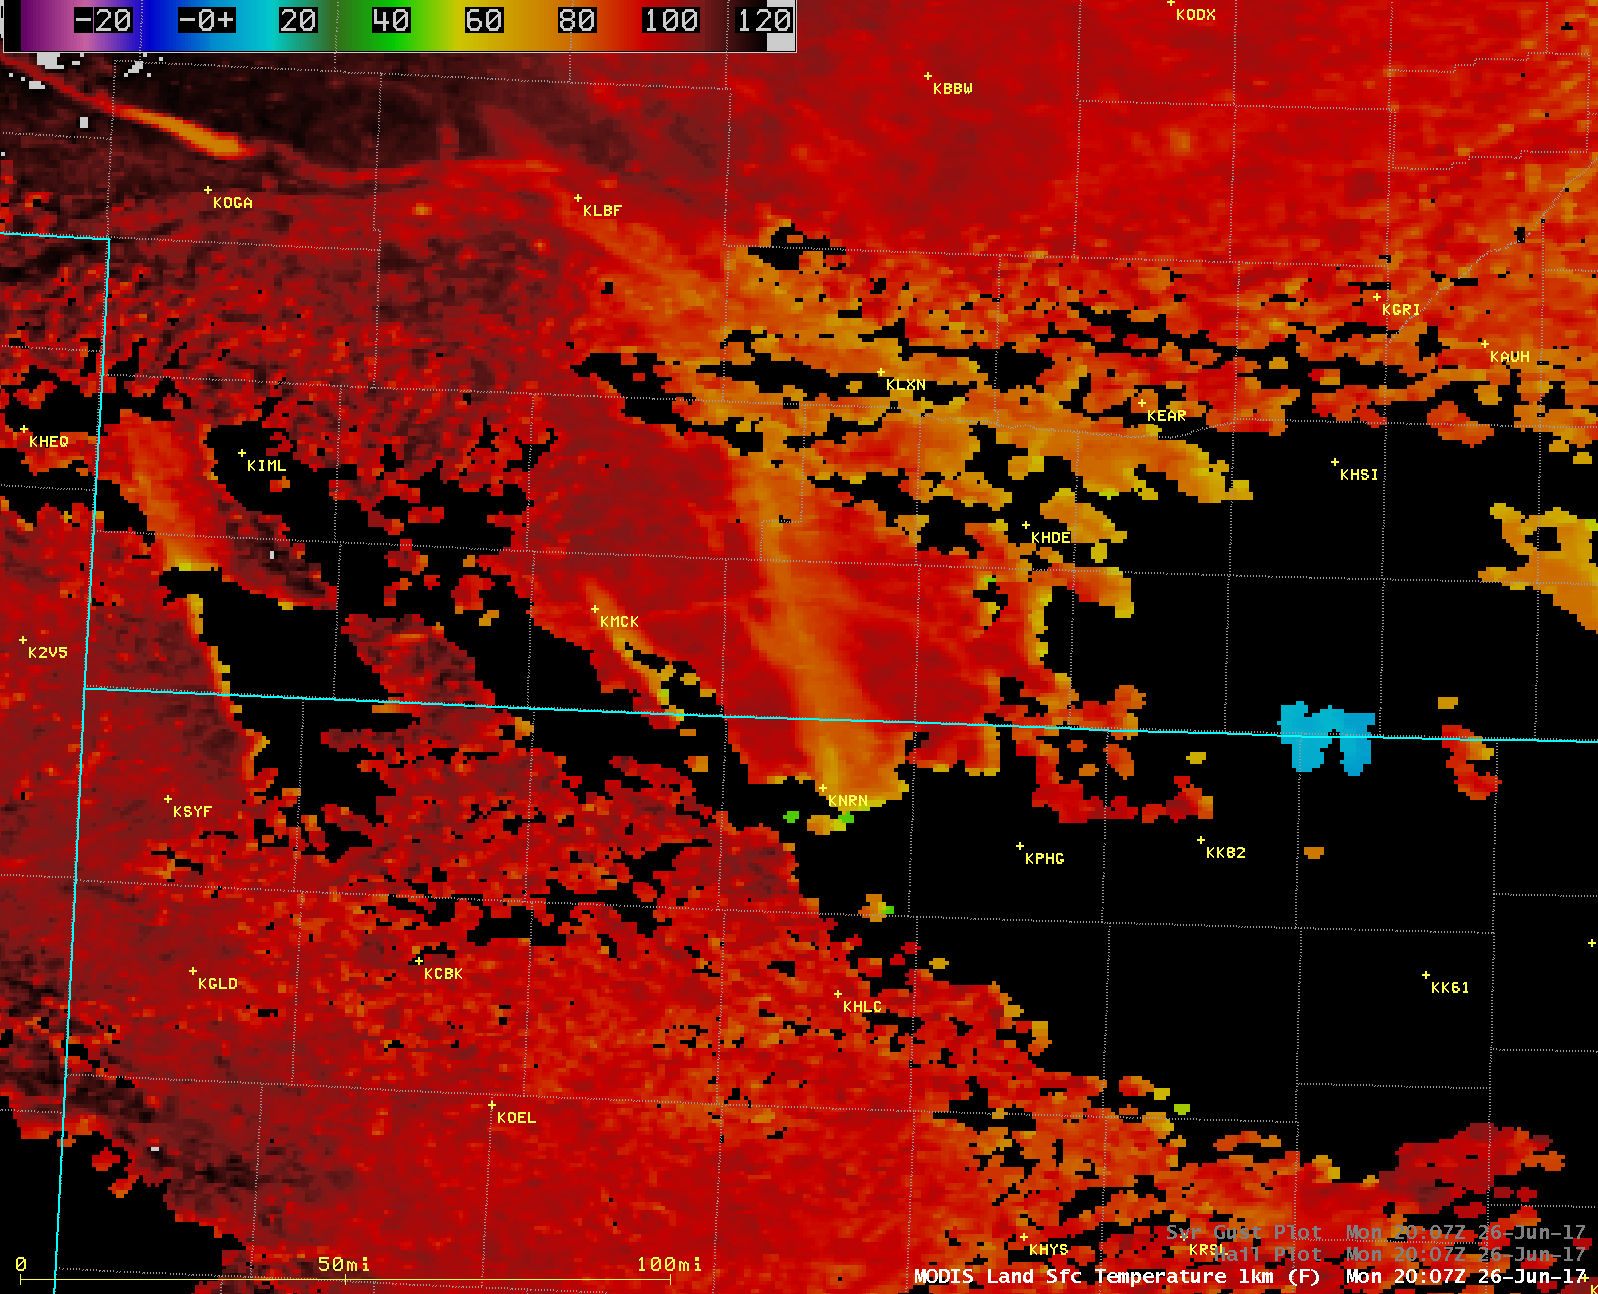
![Aqua MODIS Land Surface Temperature product, Visible (0.65 µm), Infrared Window (11.0 µm) and Shortwave Infrared (3.7 µm) images [click to enlarge]](https://cimss.ssec.wisc.edu/satellite-blog/wp-content/uploads/sites/5/2017/06/170626_2007utc_aqua_modis_LandSurfaceTemperature_Visible_InfraredWindow_ShortwaveInfrared_NE_KS_anim.gif)
