Lake effect snow bands seen in water vapor imagery
![GOES-13 Visible (0.63 µm) images [click to play animation]](https://cimss.ssec.wisc.edu/satellite-blog/wp-content/uploads/sites/5/2016/02/160212_goes13_visible_MI_lake_effect_snow_bands_anim.gif)
GOES-13 Visible (0.63 µm) images [click to play animation]
Many of these lake effect snow bands could also be seen on the corresponding GOES-13 Water Vapor (6.5 µm, 4-km resolution) images (below).
![GOES-13 Water Vapor (6.5 µm) images [click to play animation]](https://cimss.ssec.wisc.edu/satellite-blog/wp-content/uploads/sites/5/2016/02/160212_goes13_water_vapor_MI_lake_effect_snow_bands_anim.gif)
GOES-13 Water Vapor (6.5 µm) images [click to play animation]
![Aqua MODIS Visible (0.65 m) and Water Vapor (6.7 µm) images [click to enlarge]](https://cimss.ssec.wisc.edu/satellite-blog/wp-content/uploads/sites/5/2016/02/160212_1854utc_modis_water_vapor_visible_MI_les_bands_anim.gif)
Aqua MODIS Visible (0.65 m) and Water Vapor (6.7 µm) images [click to enlarge]
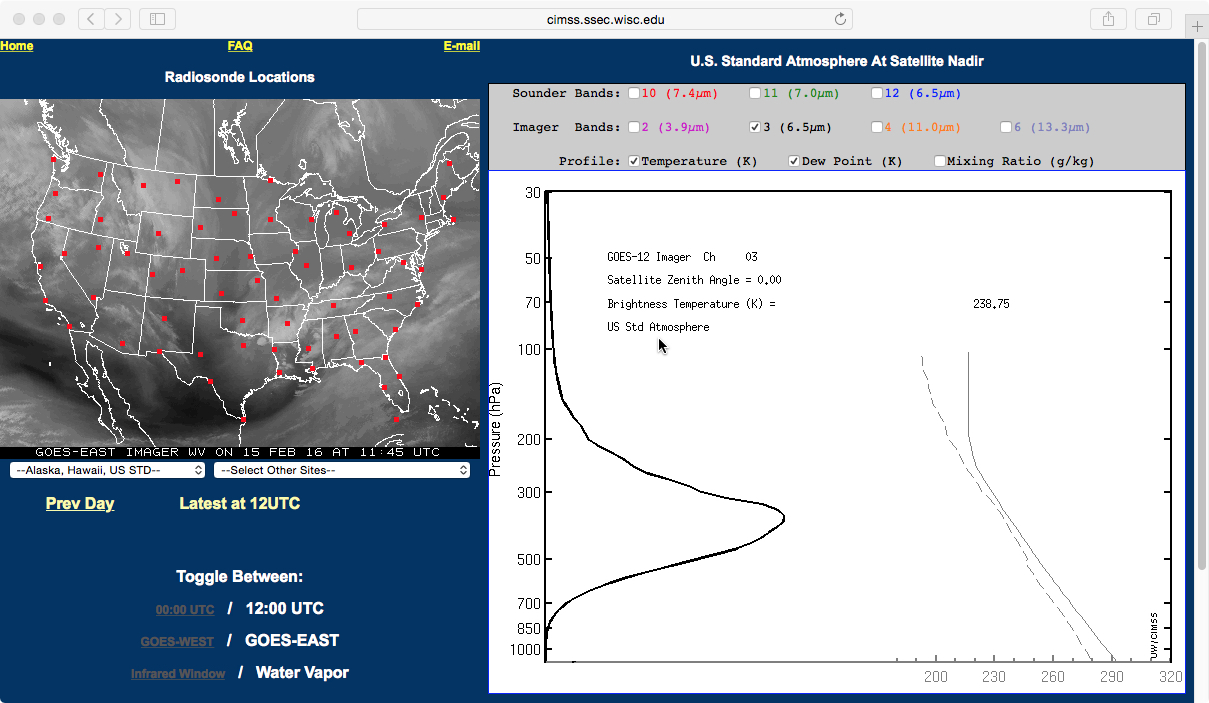
![GOES-13 imager Water Vapor (6.5 µm) weighting function plots for Green Bay WI and Detroit MI at 12 UTC on 12 February [click to enlarge]](https://cimss.ssec.wisc.edu/satellite-blog/wp-content/uploads/sites/5/2016/02/160212_12utc_GRB_DTX_water_vapor_weighting_function_anim.gif)
GOES-13 imager Water Vapor (6.5 µm) weighting function plots for Green Bay WI and Detroit MI at 12 UTC on 12 February [click to enlarge]
![GOES-13 imager Water Vapor (6.5 µm) weighting function plots calculated from Detroit MI rawindsonde data at 12 UTC on 12 February and 00 UTC on 13 February [click to enlarge]](https://cimss.ssec.wisc.edu/satellite-blog/wp-content/uploads/sites/5/2016/02/160212_12utc_160213_00utc_DTX_water_vapor_weighting_function_anim.gif)
GOES-13 imager Water Vapor (6.5 µm) weighting function plots calculated from Detroit MI rawindsonde data at 12 UTC on 12 February and 00 UTC on 13 February [click to enlarge]
Hat tip to @turnageweather for the suggestion to blog about this case!
Hey @CIMSS_Satellite, ystdy aftn very shallow lake effect clouds over Lower MI clearly seen on WV channel. Willing to blog on this? #miwx
— T.J. Turnage (@turnageweather) February 13, 2016