* GOES-16 data posted on this page are preliminary, non-operational and are undergoing testing*GOES-16 “Red” Visible (0.64 µm) and Shortwave Infrared (3.9 µm) images (above) along with “Red” Visible and “Clean” Infrared Window (10.3 µm) images (below) showed the formation of 3 pyrocumulonimbus( pyroCb) clouds late in the evening on 12 August 2017, within the... Read More
![GOES-16 Visible (0.64 µm) and Shortwave Infrared (3.9 µm) images, with hourly surface reports plotted in yellow [click to play animation]](https://cimss.ssec.wisc.edu/satellite-blog/wp-content/uploads/sites/5/2017/08/480x1280_AGOES16_B27_G16_VIS_SWIR_BC_FIRES_2PANEL_12AUG2017_2017225_010036_0002PANELS.GIF)
GOES-16 Visible (0.64 µm, top) and Shortwave Infrared (3.9 µm, bottom) images, with hourly surface reports plotted in yellow [click to play animation]
GOES-16 “Red” Visible (0.64 µm) and Shortwave Infrared (3.9 µm) images (above) along with “Red” Visible and “Clean” Infrared Window (10.3 µm) images (below) showed the formation of 3 pyrocumulonimbus( pyroCb) clouds late in the evening on 12 August 2017, within the cluster of ongoing intense wildfires in British Columbia, Canada.
![GOES-16 Visible (0.64 µm) and Infrared Window (10.3 µm) images, with hourly surface reports plotted in yellow [click to play animation]](https://cimss.ssec.wisc.edu/satellite-blog/wp-content/uploads/sites/5/2017/08/480x1280_AGOES16_B213_G16_VIS_IR_BC_FIRES_2PANEL_ZOOM_12AUG2017_2017225_010036_0002PANELS.GIF)
GOES-16 Visible (0.64 µm, top) and Infrared Window (10.3 µm, bottom) images, with hourly surface reports plotted in yellow [click to play animation]
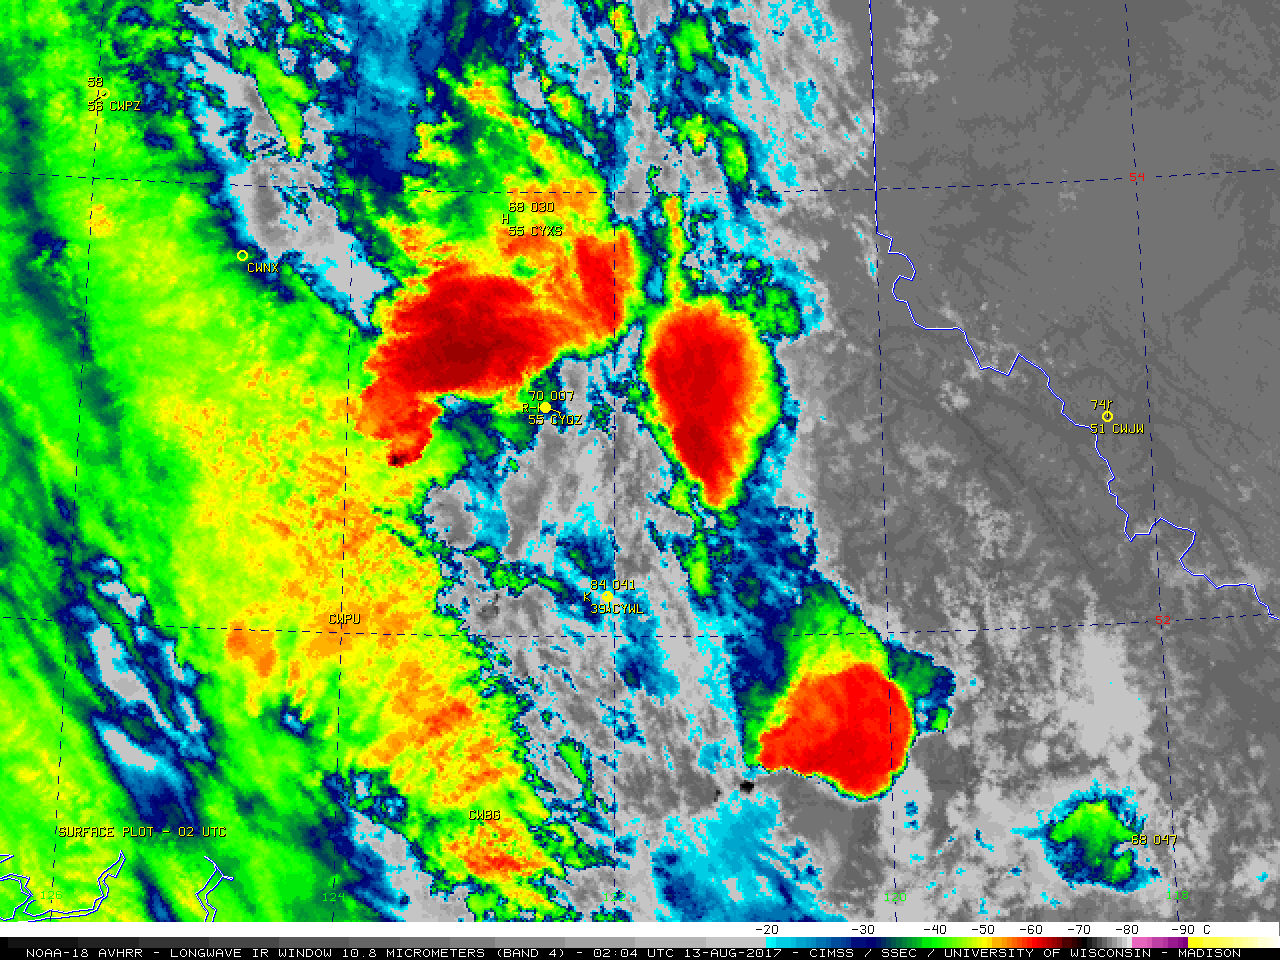
A toggle between NOAA-18
AVHRR Visible (0.63 µm), Near-Infrared (0.86 µm), Shortwave Infrared (3.9 µm) and Longwave Infrared Window (10.8 µm) images is shown below. The coldest cloud-top IR brightness temperature was -70º C (associated with the northernmost pyroCb).
![NOAA-18 Visible (0.63 µm), Shortwave Infrared (3.9 µm) and Longwave Infrared Window (10.3 µm) images, with surface station plots in yellow [click to enlarge]](https://cimss.ssec.wisc.edu/satellite-blog/wp-content/uploads/sites/5/2017/08/170813_0204utc_noaa18_bands010220304_BC_fires_anim.gif)
NOAA-18 Visible (0.63 µm), Shortwave Infrared (3.9 µm) and Longwave Infrared Window (10.3 µm) images, with surface station plots in yellow [click to enlarge]
In a daytime Suomi NPP VIIRS true-color Red/Green/Blue (RGB) image (from
RealEarth) with VIIRS-detected fire locations plotted in red
(below), a very large pall of exceptionally-dense smoke from the BC fires could be seen drifting northward as far as the Northwest Territories of Canada.
![Suomi NPP VIIRS true-color image, with VIIRS-detected fire locations plotted in red [click to enlarge]](https://cimss.ssec.wisc.edu/satellite-blog/wp-content/uploads/sites/5/2017/08/170812_viirs_fires.jpeg)
Suomi NPP VIIRS true-color image, with VIIRS-detected fire locations plotted in red [click to enlarge]
The Suomi NPP OMPS Aerosol Index (AI) product
(below; courtesy of Colin Seftor, SSAI) displayed AI values as high as 17.18 within the thick BC fire smoke pall.
![Suomi NPP OMPS Aerosol Index [click to enlarge]](https://cimss.ssec.wisc.edu/satellite-blog/wp-content/uploads/sites/5/2017/08/OMPS_AI_nam_2017_08_12.jpg)
Suomi NPP OMPS Aerosol Index [click to enlarge]
===== 13 August Update =====
![Suomi NPP OMPS Aerosol Index product [click to enlarge]](https://cimss.ssec.wisc.edu/satellite-blog/wp-content/uploads/sites/5/2017/08/OMPS_AI_nam_2017_08_13_new_scale.jpg)
Suomi NPP OMPS Aerosol Index product [click to enlarge]
On 13 August, a maximum OMPS AI value of 39.91 was seen at around 21:13 UTC over the Northwest Territories of Canada
(above) — according to Colin Seftor and Mike Fromm (NRL), this value surpassed the highest pyroCb-related AI value ever measured by TOMS or OMI (whose period of record began in 1979).
The north-northeastward transport of BC fire smoke — as well as a prominent increase in smoke from fires across northern Canada and the Prairies — was evident in an animation of daily composites of Suomi NPP VIIRS true-color images from 07-13 August (below).
![Daily Suomi NPP VIIRS true-color image composites (07-13 August), with VIIRS-detected fire locations plotted in red [click to play animation]](https://cimss.ssec.wisc.edu/satellite-blog/wp-content/uploads/sites/5/2017/08/170813_viirs_fires.jpeg)
Daily Suomi NPP VIIRS true-color image composites (07-13 August), with VIIRS-detected fire locations plotted in red [click to play animation]
View only this post
Read Less
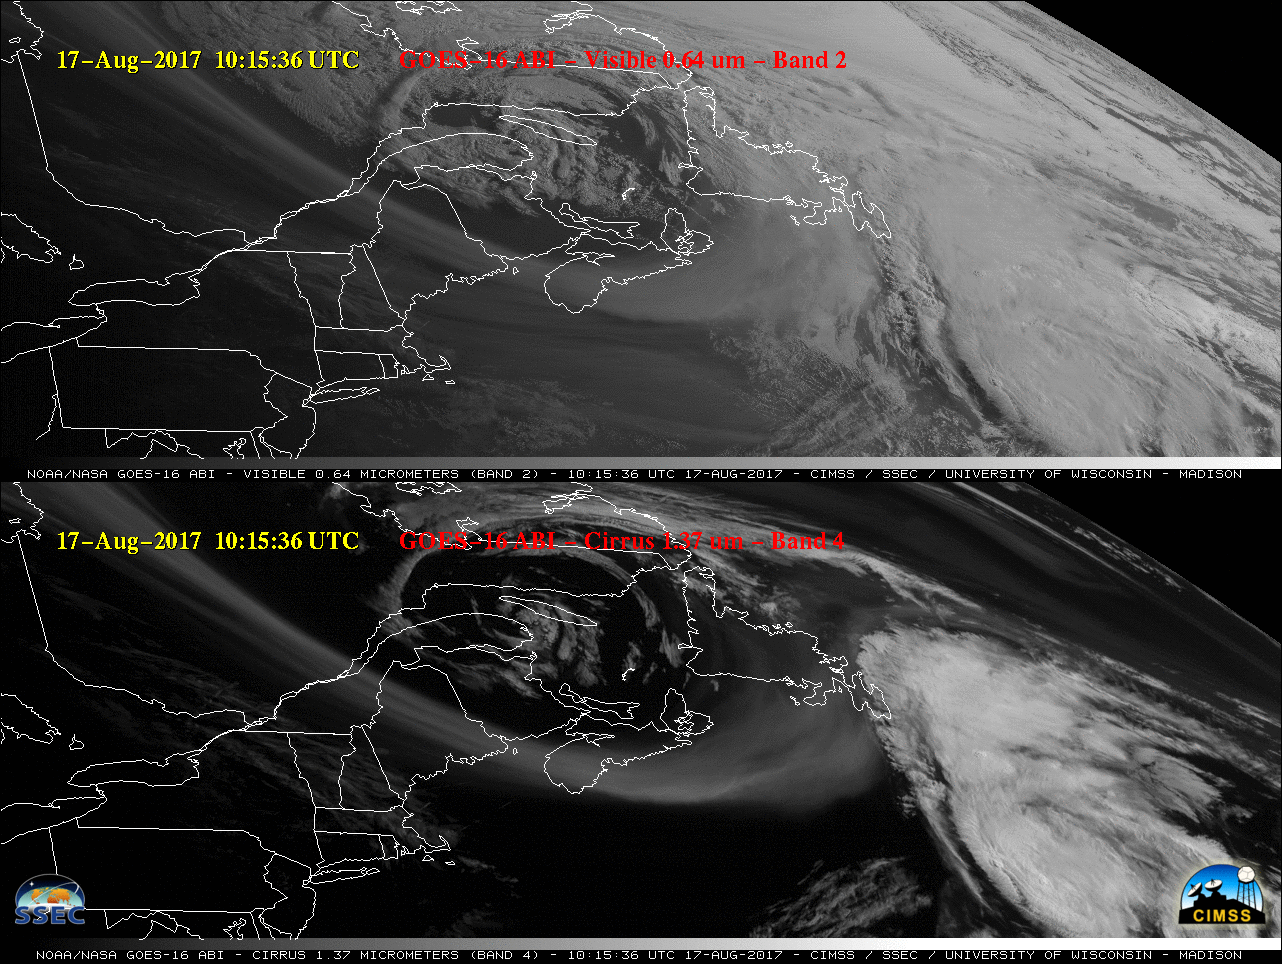
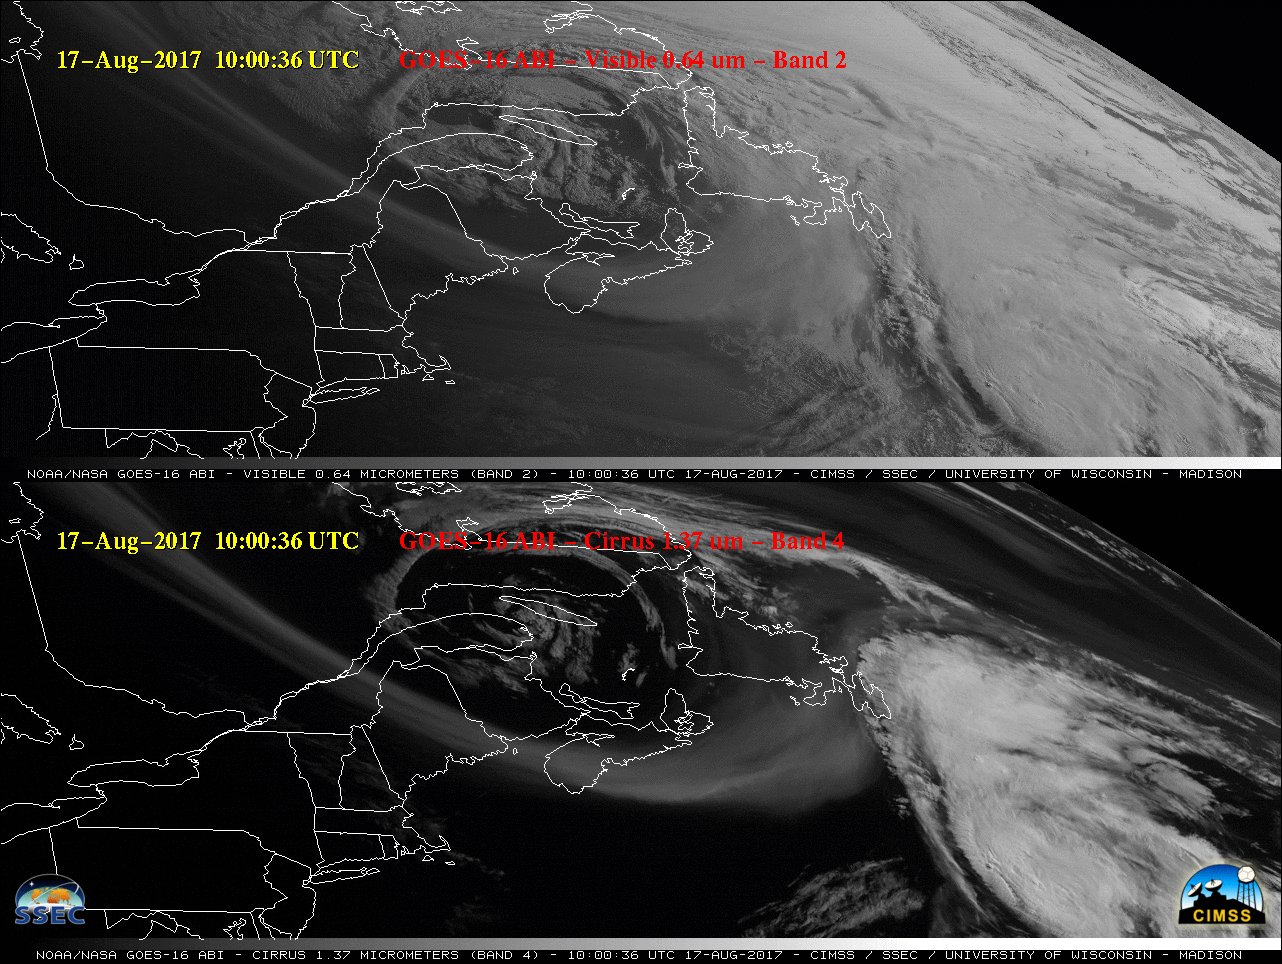
![GOES-16 Visible (0.64 µm, top) and Cirrus (1.37 µm, bottom) images [click to play MP4 animation]](https://cimss.ssec.wisc.edu/satellite-blog/wp-content/uploads/sites/5/2017/08/G16_VIS_CIRRUS_SMOKE_MARITIMES_17AUG2017_480x1280_B24_2017229_101536_0002PANELS_00002.GIF)
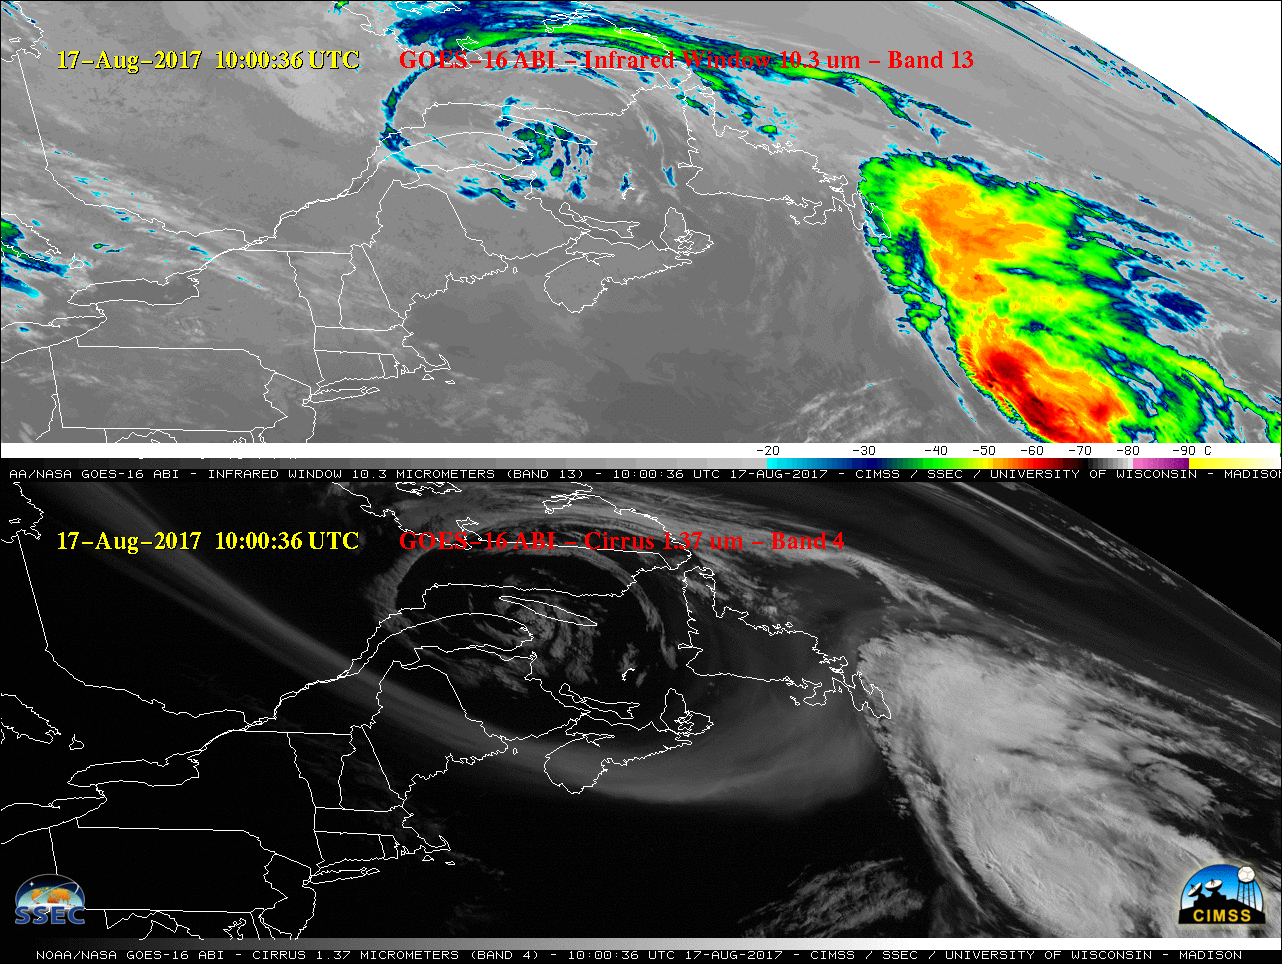
![GOES-16 Infrared Window (10.3 µm, top) and Cirrus (1.37 µm, bottom) images [click to play MP4 animation]](https://cimss.ssec.wisc.edu/satellite-blog/wp-content/uploads/sites/5/2017/08/G16_IR_CIRRUS_SMOKE_MARITIMES_17AUG2017_480x1280_B134_2017229_101536_0002PANELS_00002.GIF)
![Terra MODIS Visible (0.65 µm), Cirrus (1.375 µm) and Infrared Window (11.0 µm) images [click to enlarge]](https://cimss.ssec.wisc.edu/satellite-blog/wp-content/uploads/sites/5/2017/08/170817_1626utc_terra_modis_Visible_Cirrus_InfraredWindow_Canadian_wildfire_smoke_anim.gif)
![Suomi NPP VIIRS daily true-color images [click to enlarge]](https://cimss.ssec.wisc.edu/satellite-blog/wp-content/uploads/sites/5/2017/08/170812-17_suomi_npp_viirs_truecolor_Canada_wildfire_smoke_anim.gif)
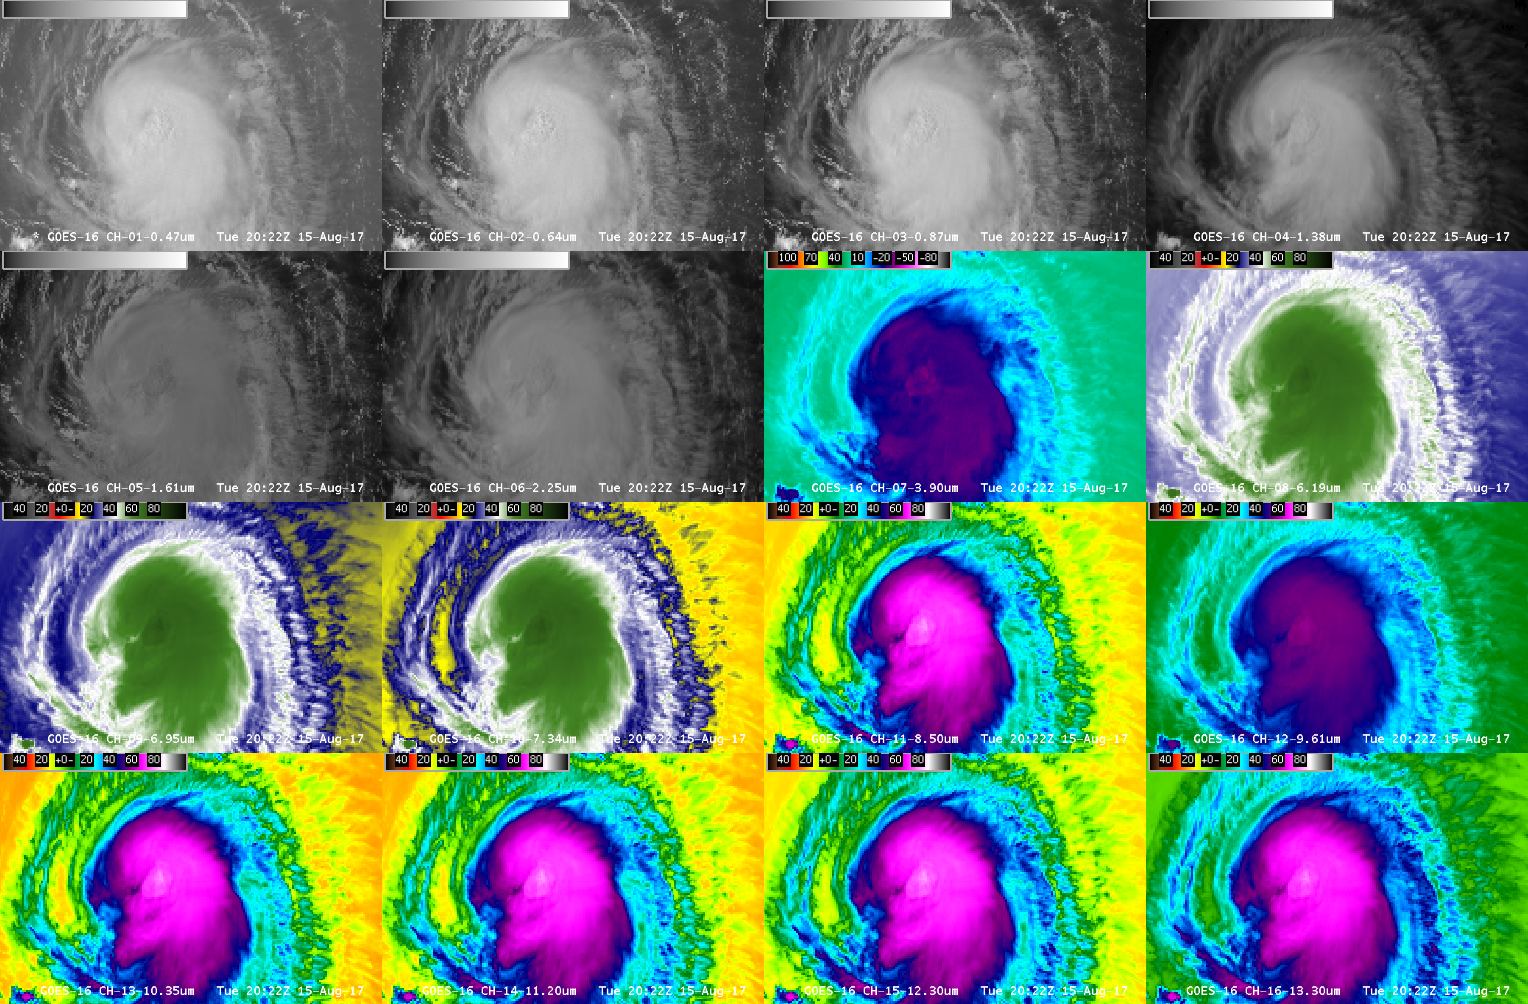
![GOES-16 imagery (all 16 ABI Bands) from 1912-2132 UTC, 15 August 2017 [click to play animation]](https://cimss.ssec.wisc.edu/satellite-blog/wp-content/uploads/sites/5/2017/08/Gert_ABI_16Pan_1912_2132_15Aug2015anim.gif)
![GOES-16 imagery Low-Level Water Vapor (7.34 µm) Infrared Imagery from 1832-2137 UTC, 15 August 2017 [click to play animation]](https://cimss.ssec.wisc.edu/satellite-blog/wp-content/uploads/sites/5/2017/08/Gert_ABI_Band10-20170815_1832_2137anim.gif)
![GOES-16 imagery (all 16 ABI Bands) from 1117-1337 UTC, 16 August 2017 [click to play animation]](https://cimss.ssec.wisc.edu/satellite-blog/wp-content/uploads/sites/5/2017/08/Gert_ABI16Panel-20170816_1117_1337_anim.gif)
![GOES-16 Visible (0,64 µm, top) and Infrared Window (10.3 µm, bottom) images [click to play MP4 animation]](https://cimss.ssec.wisc.edu/satellite-blog/wp-content/uploads/sites/5/2017/08/480x1280_GOES16A_B213_G16_VIS_IR_GERT_16UG2017_2017228_175125_0002PANELS.GIF)
![GOES-16 Visible (0.64 µm) and Shortwave Infrared (3.9 µm) images, with hourly surface reports plotted in yellow [click to play animation]](https://cimss.ssec.wisc.edu/satellite-blog/wp-content/uploads/sites/5/2017/08/170812_goes16_visible_shortwave_infrared_BC_fires_pyrocb_anim.gif)
![GOES-16 Visible (0.64 µm) and Infrared Window (10.3 µm) images, with hourly surface reports plotted in yellow [click to play animation]](https://cimss.ssec.wisc.edu/satellite-blog/wp-content/uploads/sites/5/2017/08/170812_goes16_visible_infrared_BC_fires_pyrocb_anim.gif)
![Daily Suomi NPP VIIRS true-color image composites (07-13 August), with VIIRS-detected fire locations plotted in red [click to play animation]](https://cimss.ssec.wisc.edu/satellite-blog/wp-content/uploads/sites/5/2017/08/170807_170813_suomi_npp_viirs_truecolor_fire_detections_BC_fires_anim.gif)
