* GOES-16 data posted on this page are preliminary, non-operational and are undergoing testing *On 16 September 2017, GOES-16 “Clean” Infrared Window (10.3 µm) images (above) showed the early stages of development of Tropical Storm Maria in the central Atlantic Ocean (located at 12.3 ºN latitude, 52.6 ºW longitude at 2100 UTC). Convective... Read More
GOES-16 “Clean” Infrared Window (10.3 µm) images [click to animate]
* GOES-16 data posted on this page are preliminary, non-operational and are undergoing testing *
On 16 September 2017, GOES-16 “Clean” Infrared Window (10.3 µm) images (above) showed the early stages of development of Tropical Storm Maria in the central Atlantic Ocean (located at 12.3 ºN latitude, 52.6 ºW longitude at 2100 UTC). Convective bursts exhibited cloud-top infrared brightness temperatures in the -77 ºC to -79 ºC range (brighter white enhancement). The hourly surface report from TBPB (along the left edge of the images) is Bridgetown in Barbados.
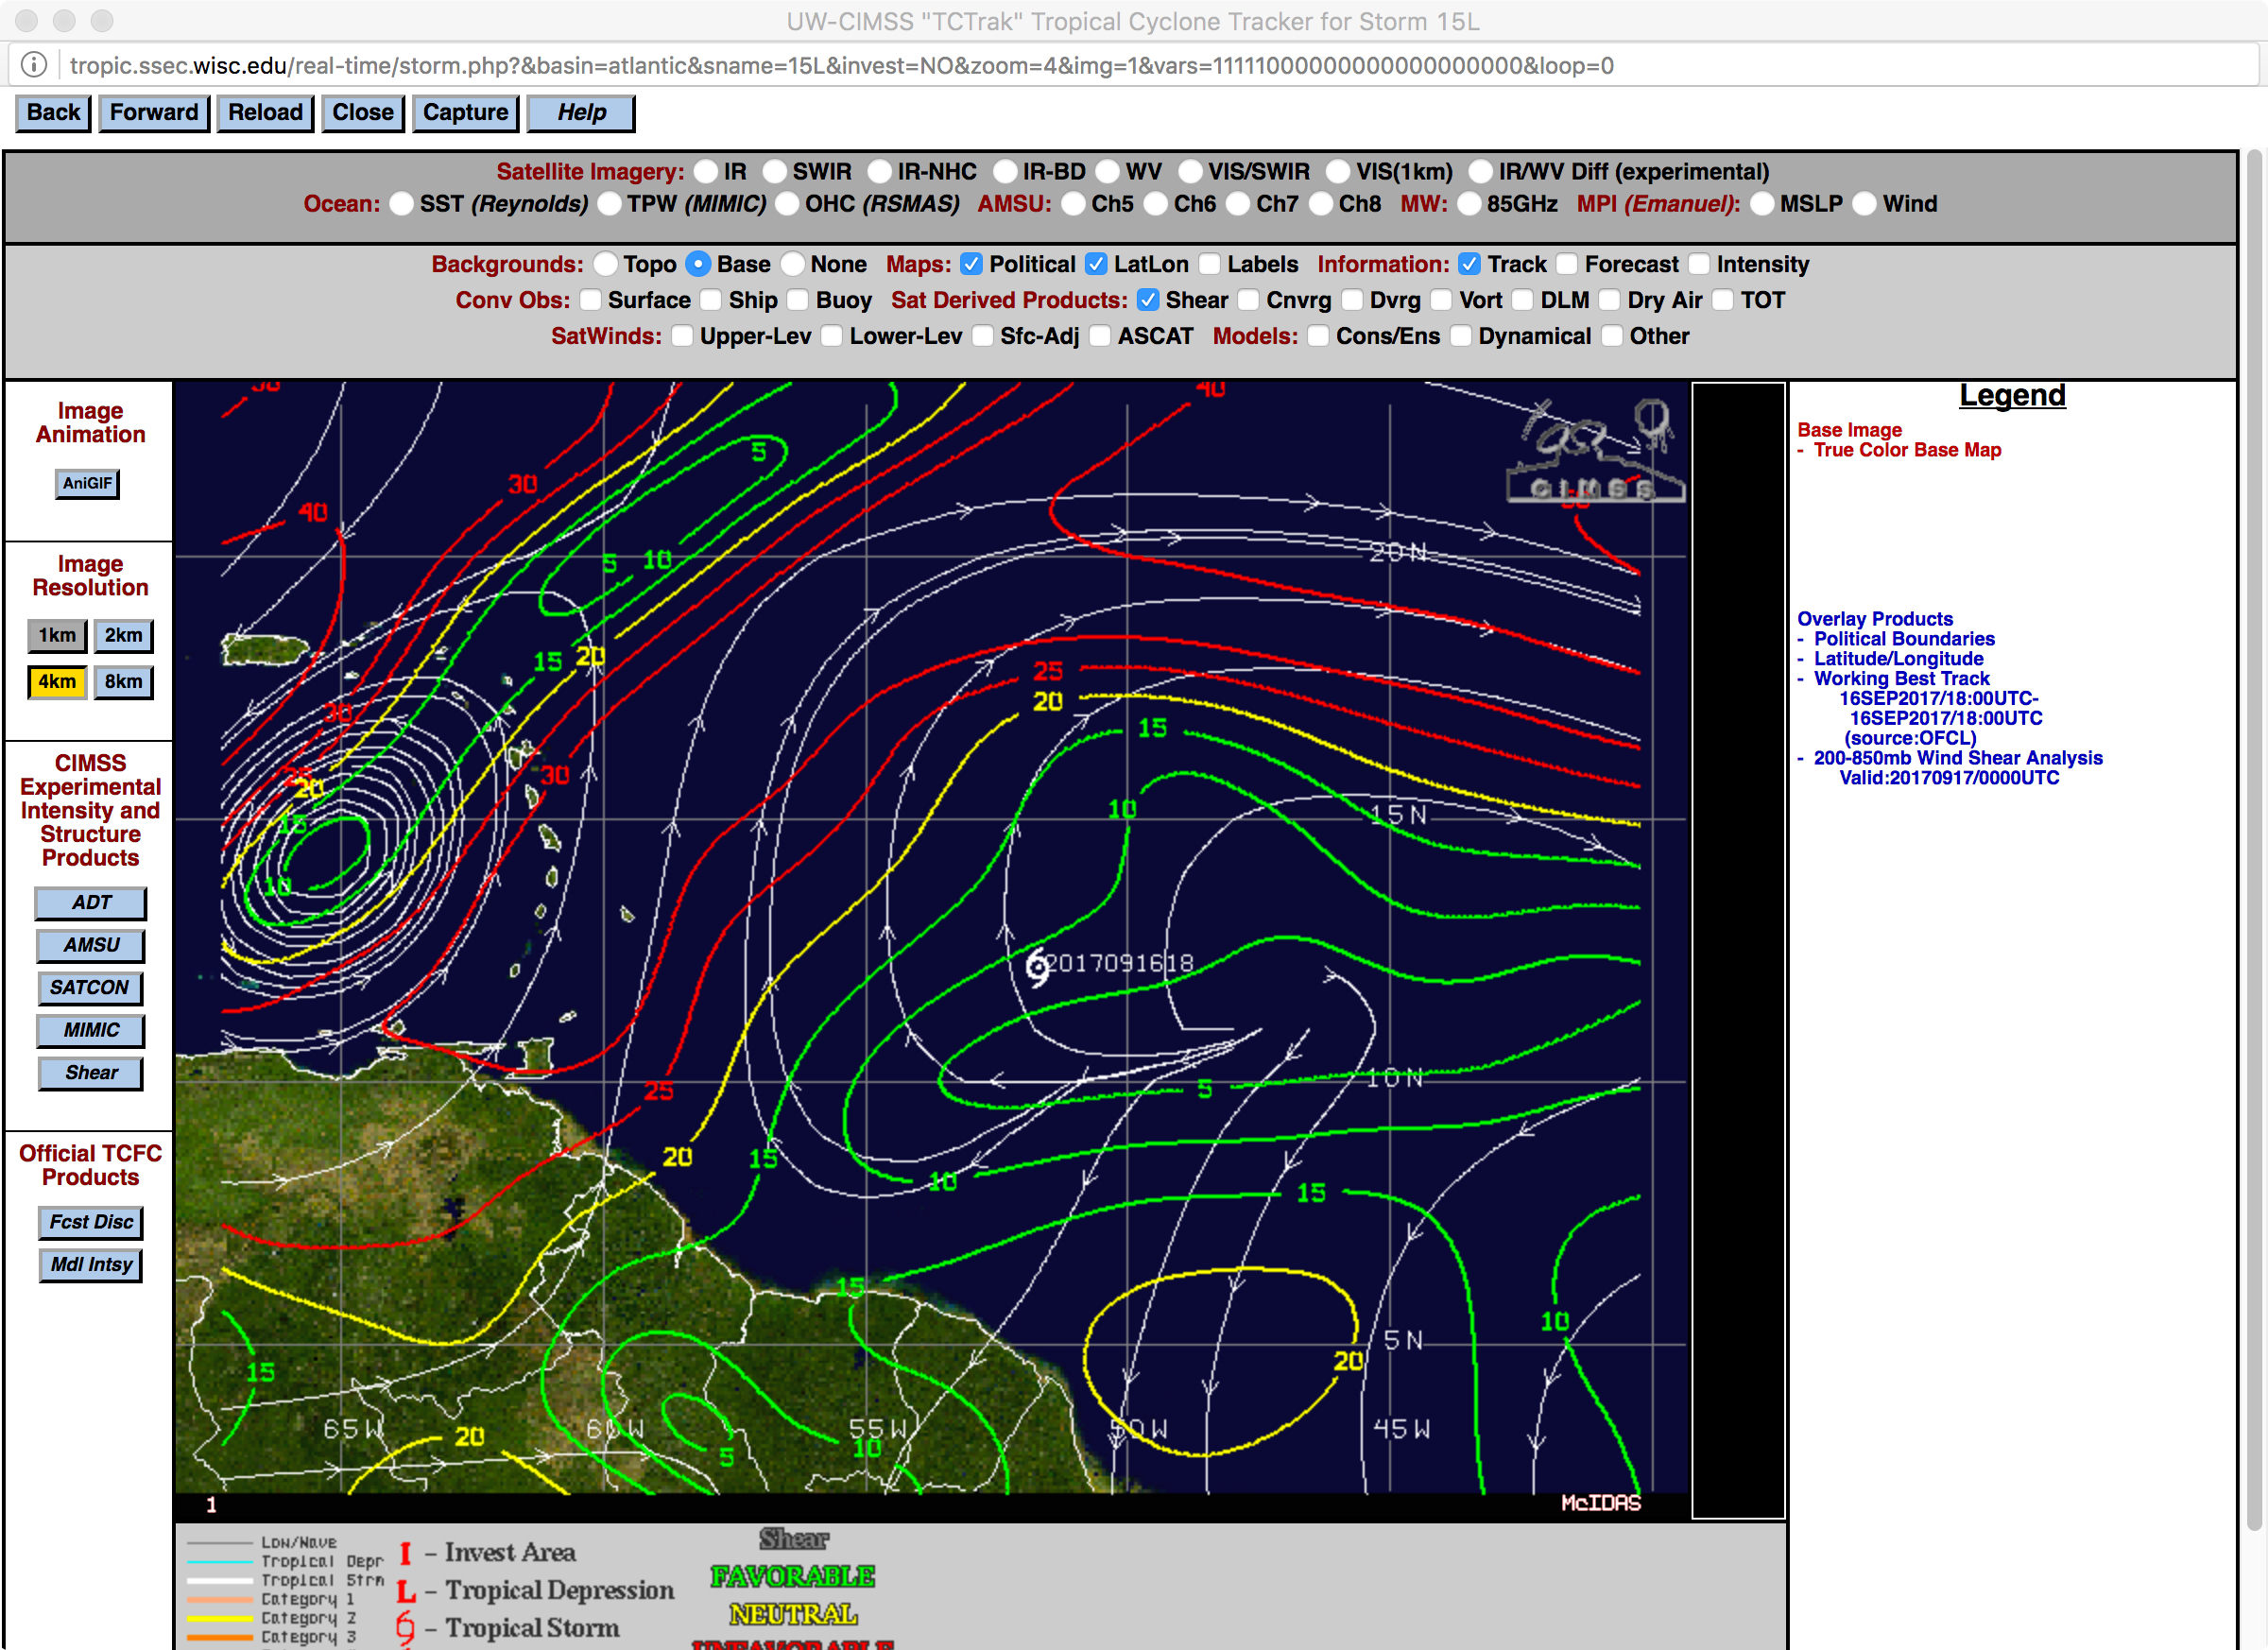
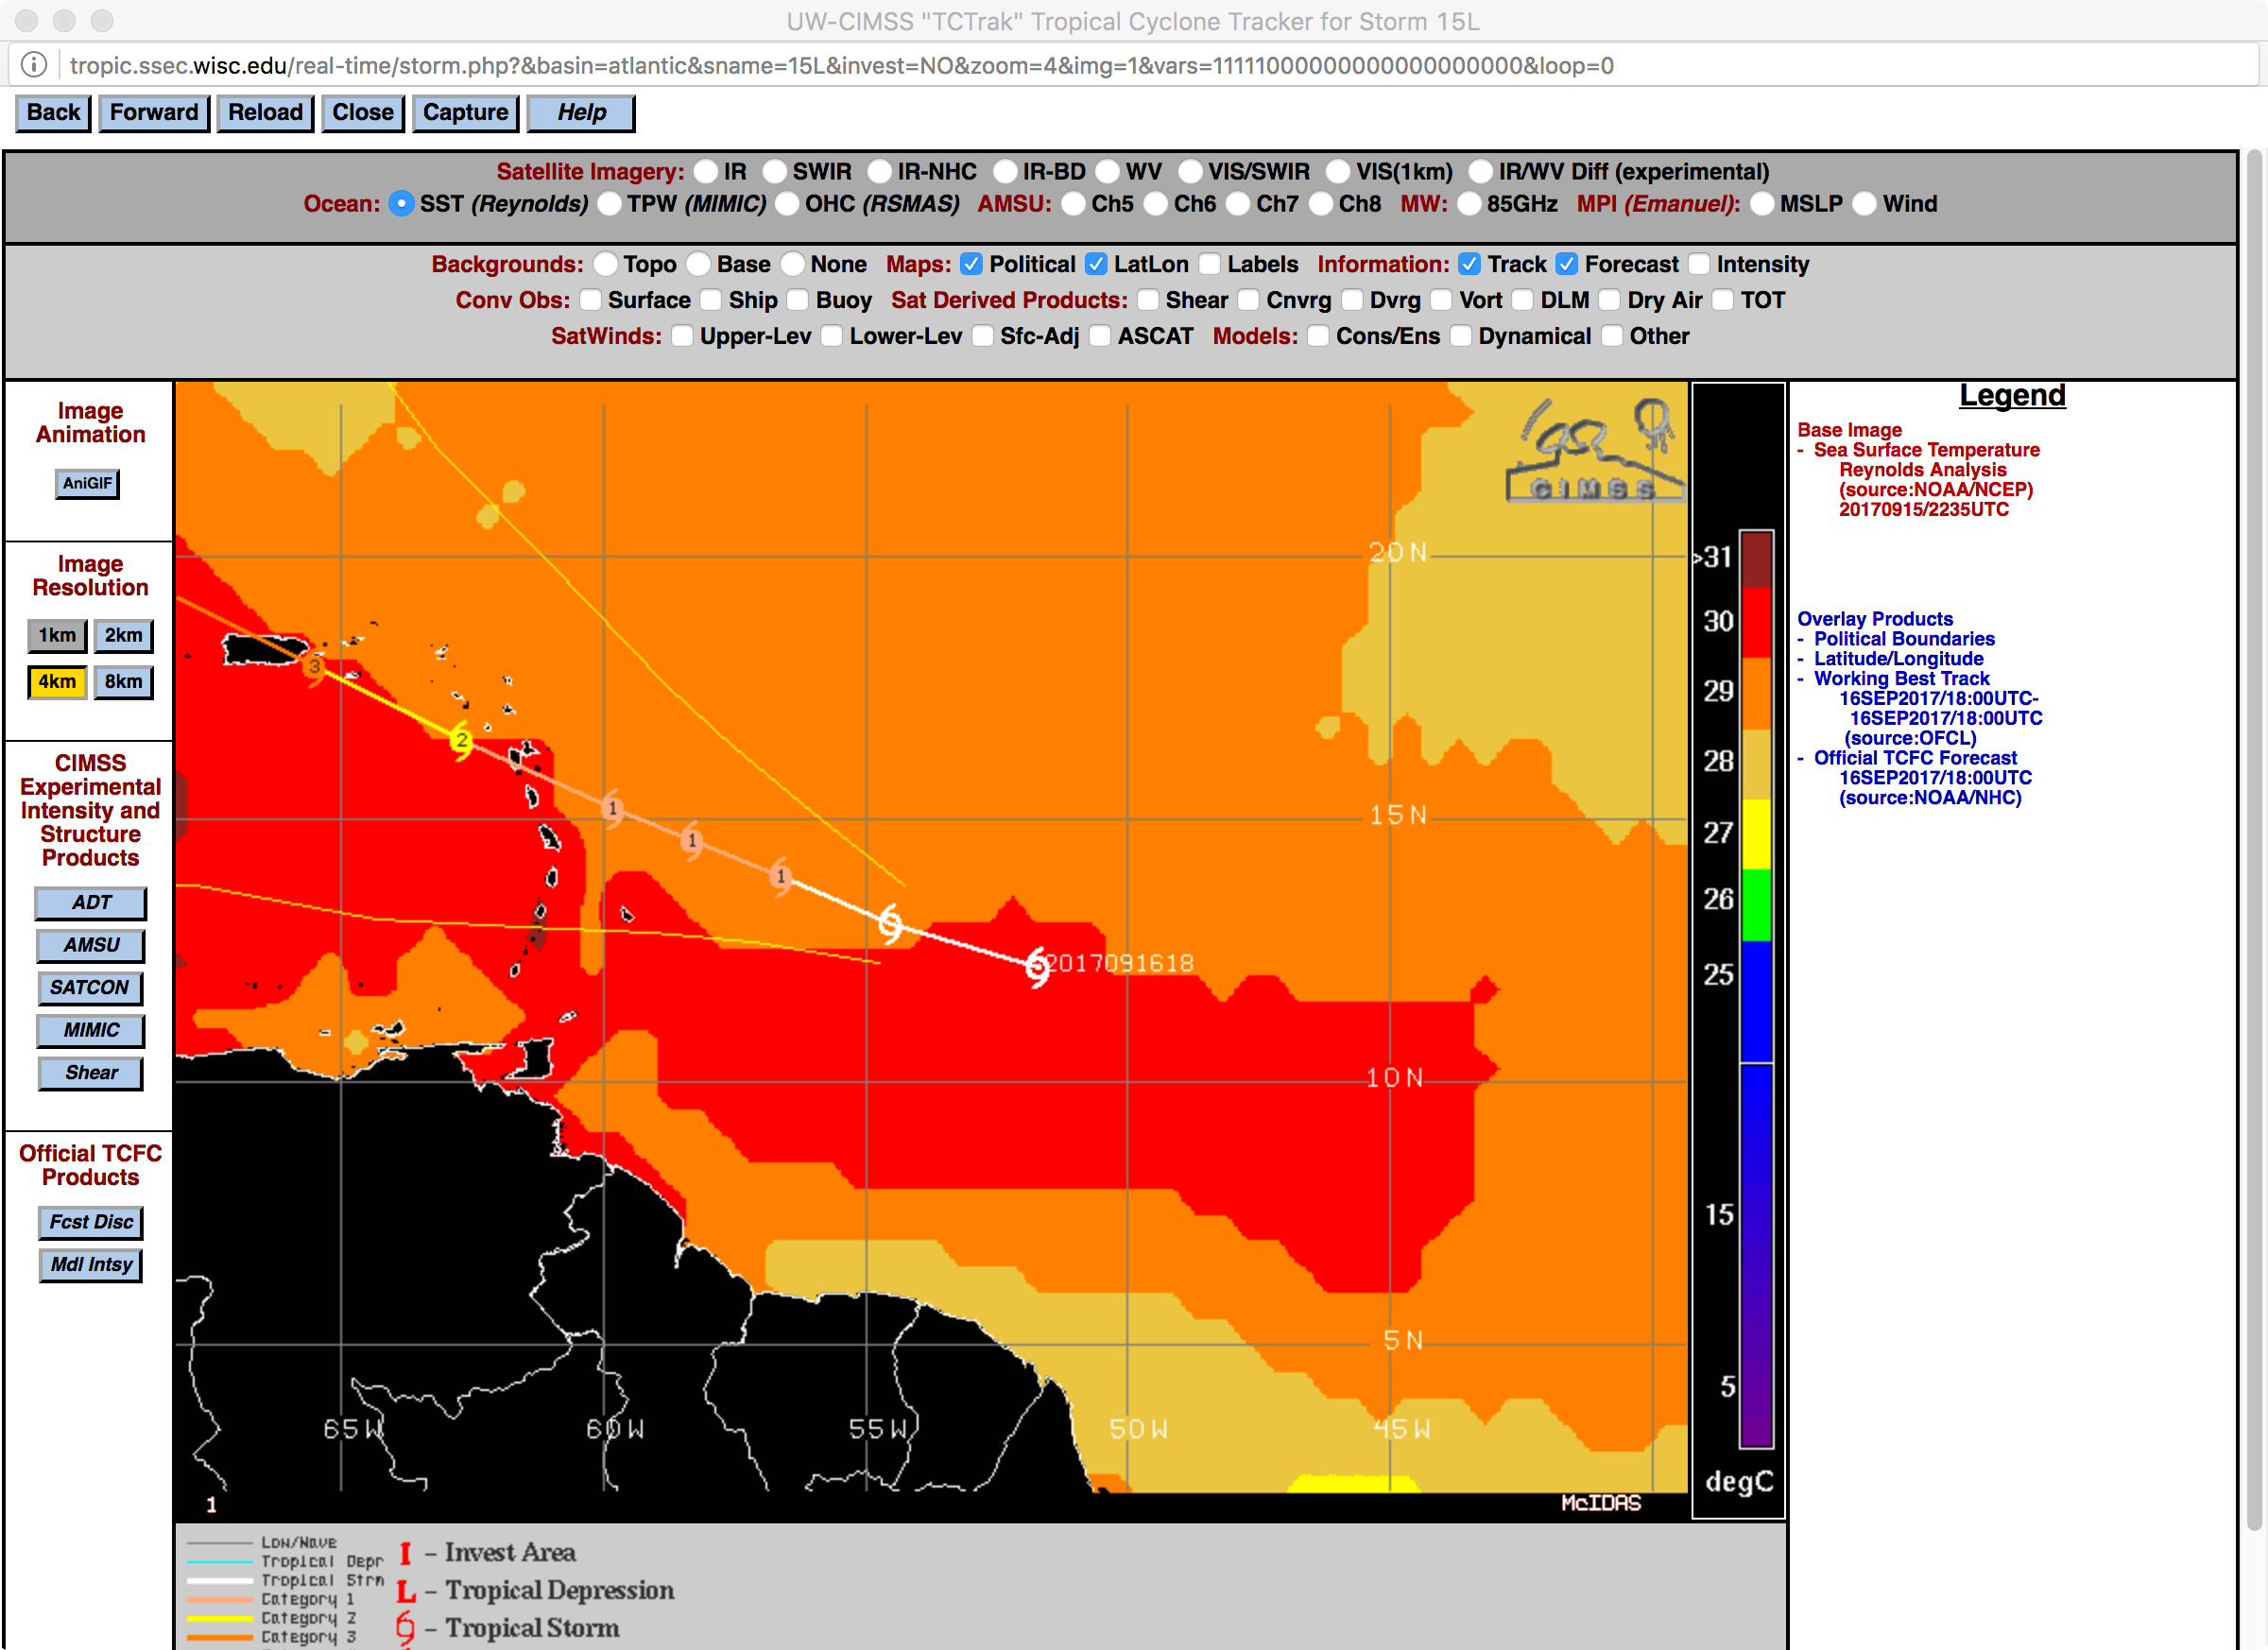
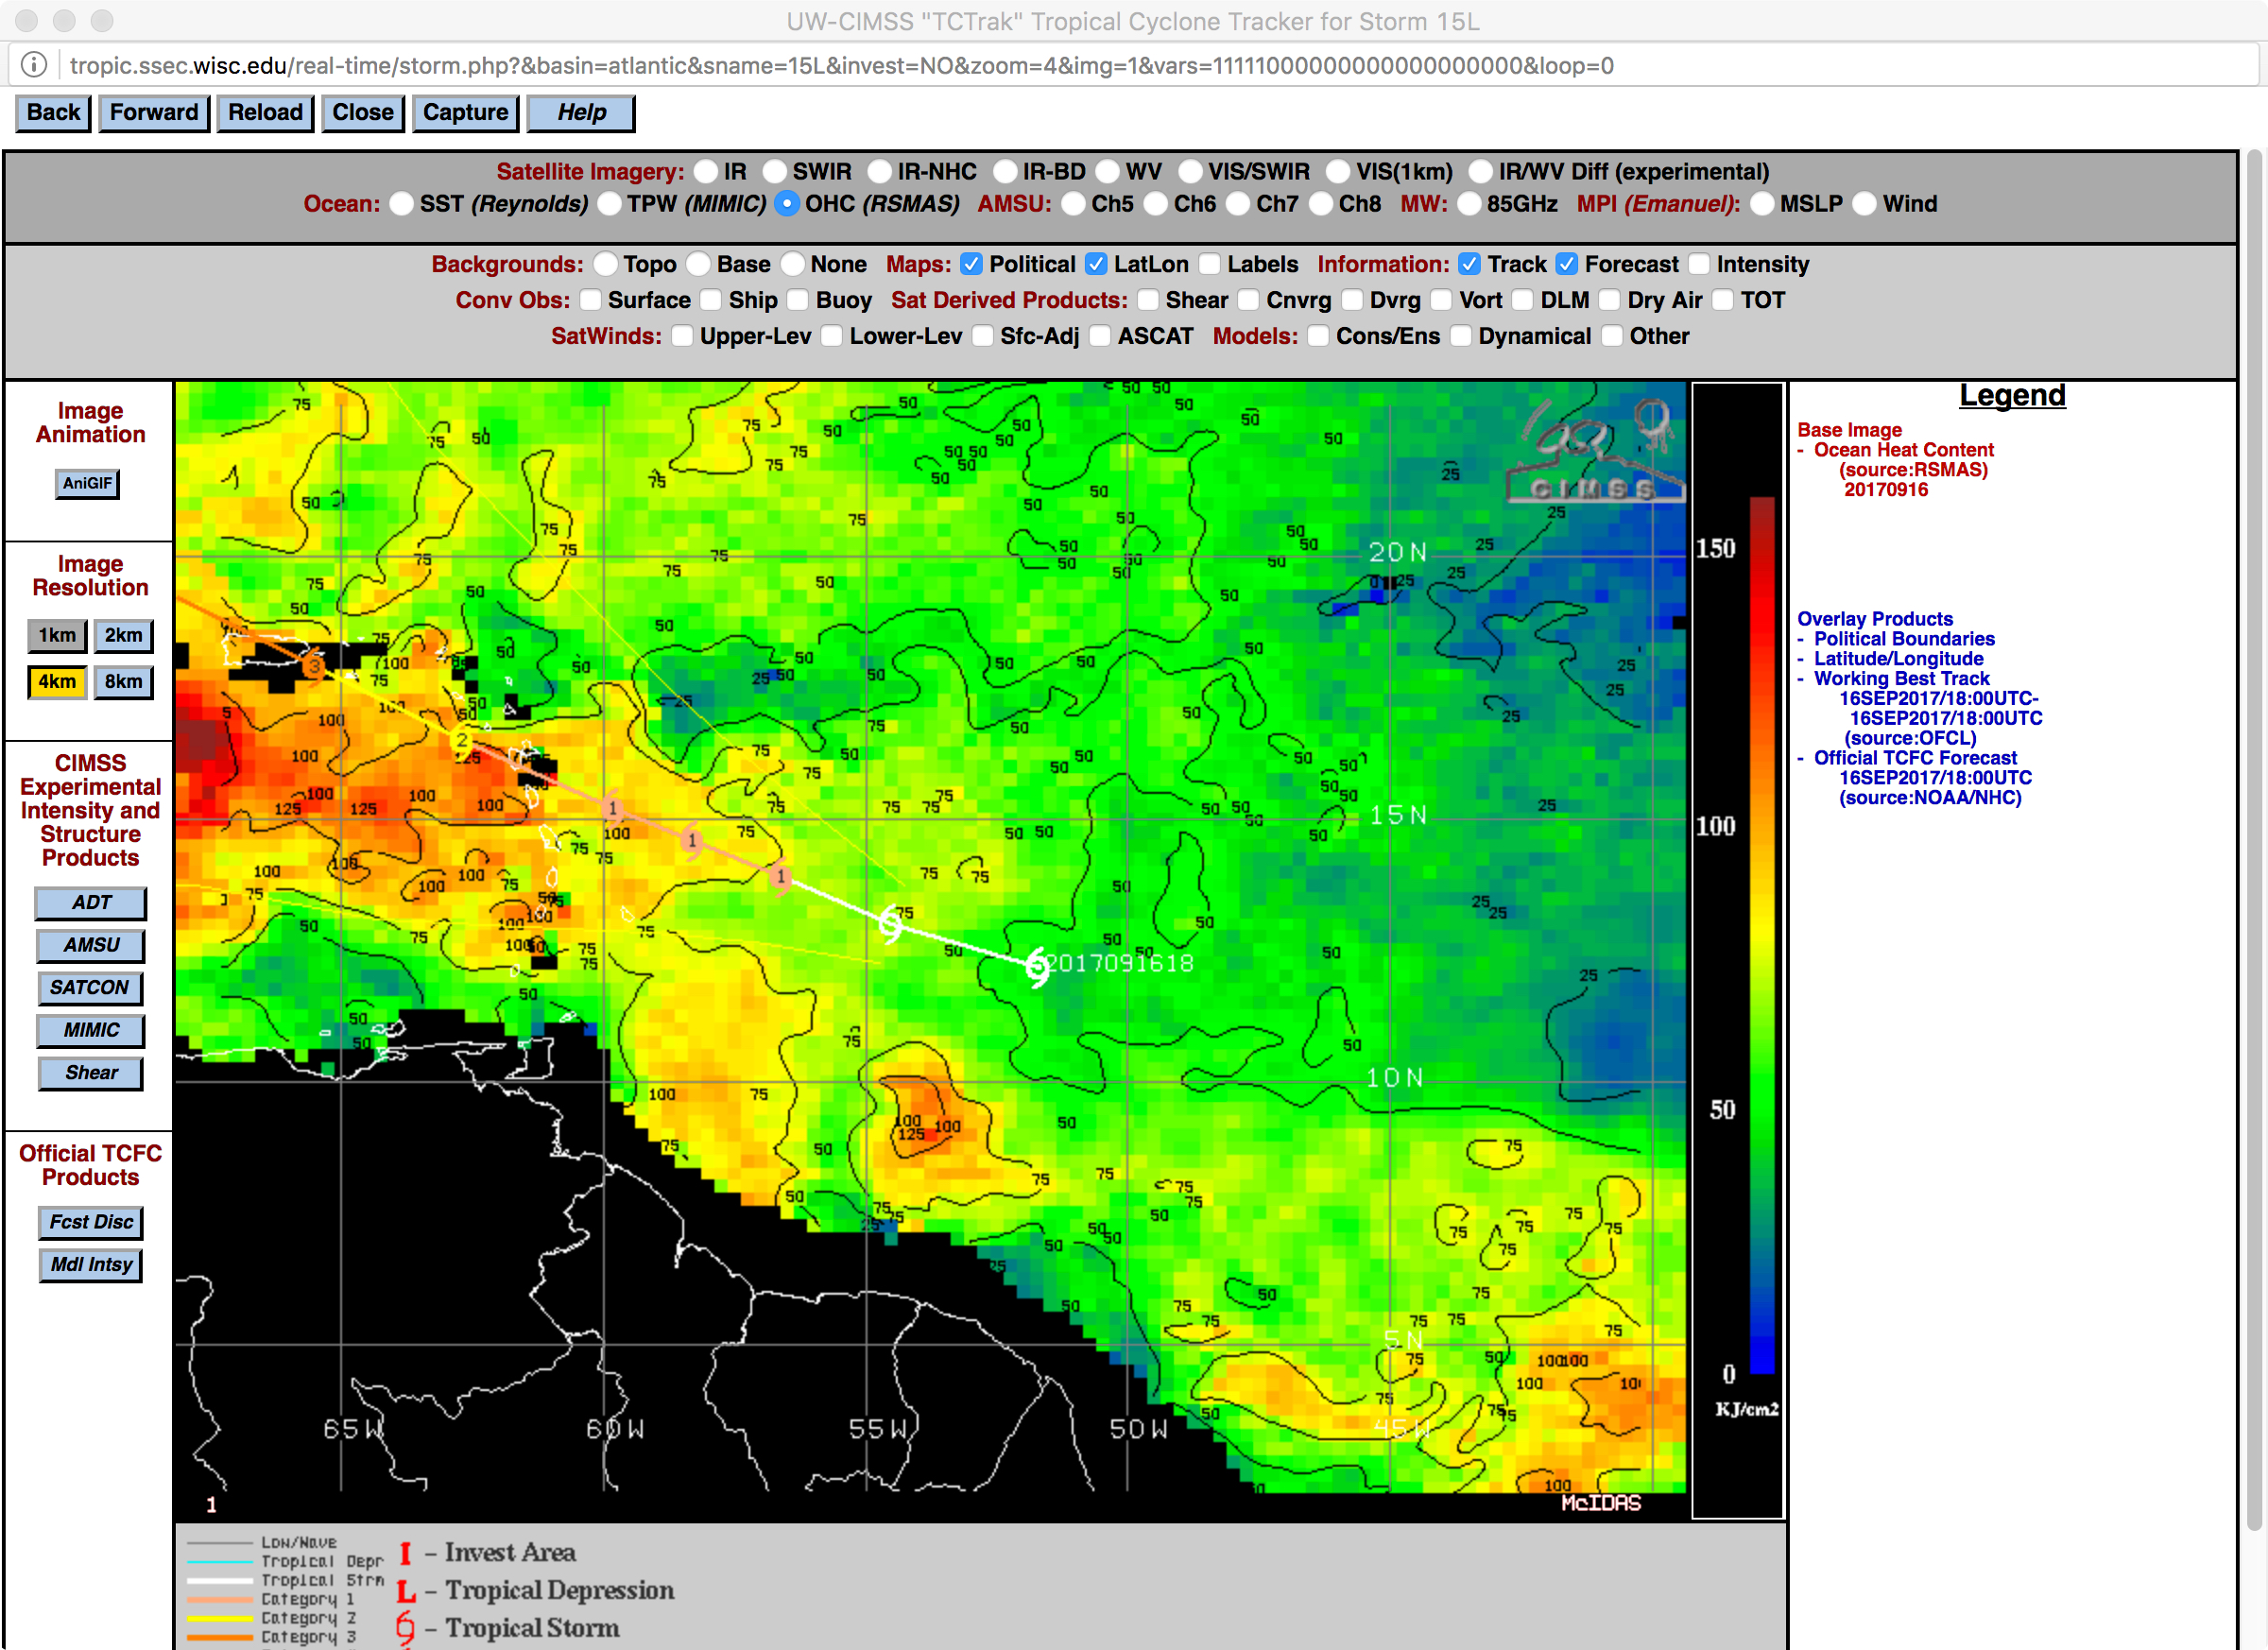
Unfortunately, the initial National Hurricane Center forecast track (below) takes Maria to Major Hurricane intensity over or near islands that were recently heavily impacted by Hurricane Irma. Maria is forecast to remain in an environment of low wind shear and move over waters characterized by warm SST and high OHC values (source), which all favor intensification.
![Initial NHC forecast track [click to enlarge]](https://cimss.ssec.wisc.edu/satellite-blog/wp-content/uploads/sites/5/2017/09/maria_track.jpg)
Initial NHC forecast track [click to enlarge]
![GOES-16 Visible (0.64 µm, left) and Infrared Window (10.3 µm, right) images [click to animate]](https://cimss.ssec.wisc.edu/satellite-blog/wp-content/uploads/sites/5/2017/09/958x638_GOES16A_B213_G16_VIS_IR_MARIA_17SEP2017_2017260_204538_0002PANELS.GIF)
GOES-16 Visible (<strong0.64 µm, left) and Infrared Window (10.3 µm, right) images [click to animate]
GOES-16 “Red” Visible (
0.64 µm) and “Clean” Infrared Widow (
10.3 µm) images
(above) revealed a steady trend of organization during the day on 17 September, which allowed Maria to intensify to Category 1 Hurricane status at 2100 UTC. Note the large convective burst which expanded just west of the center of circulation after 1700 UTC — cloud-top infrared brightness temperatures were impressively cold, in the -80ºC to -89ºC range
(violet shades of color enhancement).
===== 18 September Update =====![GOES-16 Visible (0.64 µm, left) and Infrared Window (10.3 µm, right) images [click to animate]](https://cimss.ssec.wisc.edu/satellite-blog/wp-content/uploads/sites/5/2017/09/958x638_GOES16A_B213_G16_VIS_IR_MESO_MARIA_18SEP2017_2017261_201258_0002PANELS.GIF)
GOES-16 Visible (0.64 µm, left) and Infrared Window (10.3 µm, right) images [click to animate]
A GOES-16
Mesoscale Sector was positioned over Hurricane Maria, providing imagery at 1-minute intervals — Visible (0.64 µm) and Infrared Window (10.3 µm) images
(above) captured the formation of an obvious eye feature beginning around 1615 UTC. Maria rapidly intensified (
CIMSS SATCON) from a Category 1 to a Category 4 Hurricane east of Le Lamentin, Martinique (TFFF) during this daylight sequence of 1-minite images; the eye then went on to approach the small island of Dominica (TDCF is the identifier of their Canefield Airport) — and in fact Maria was upgraded to Category 5 intensity as the eye was just east of Dominica at 00 UTC on 19 September (
NHC advisory). AWIPS imagery of the 1-minute GOES-16 Infrared data is available
here.
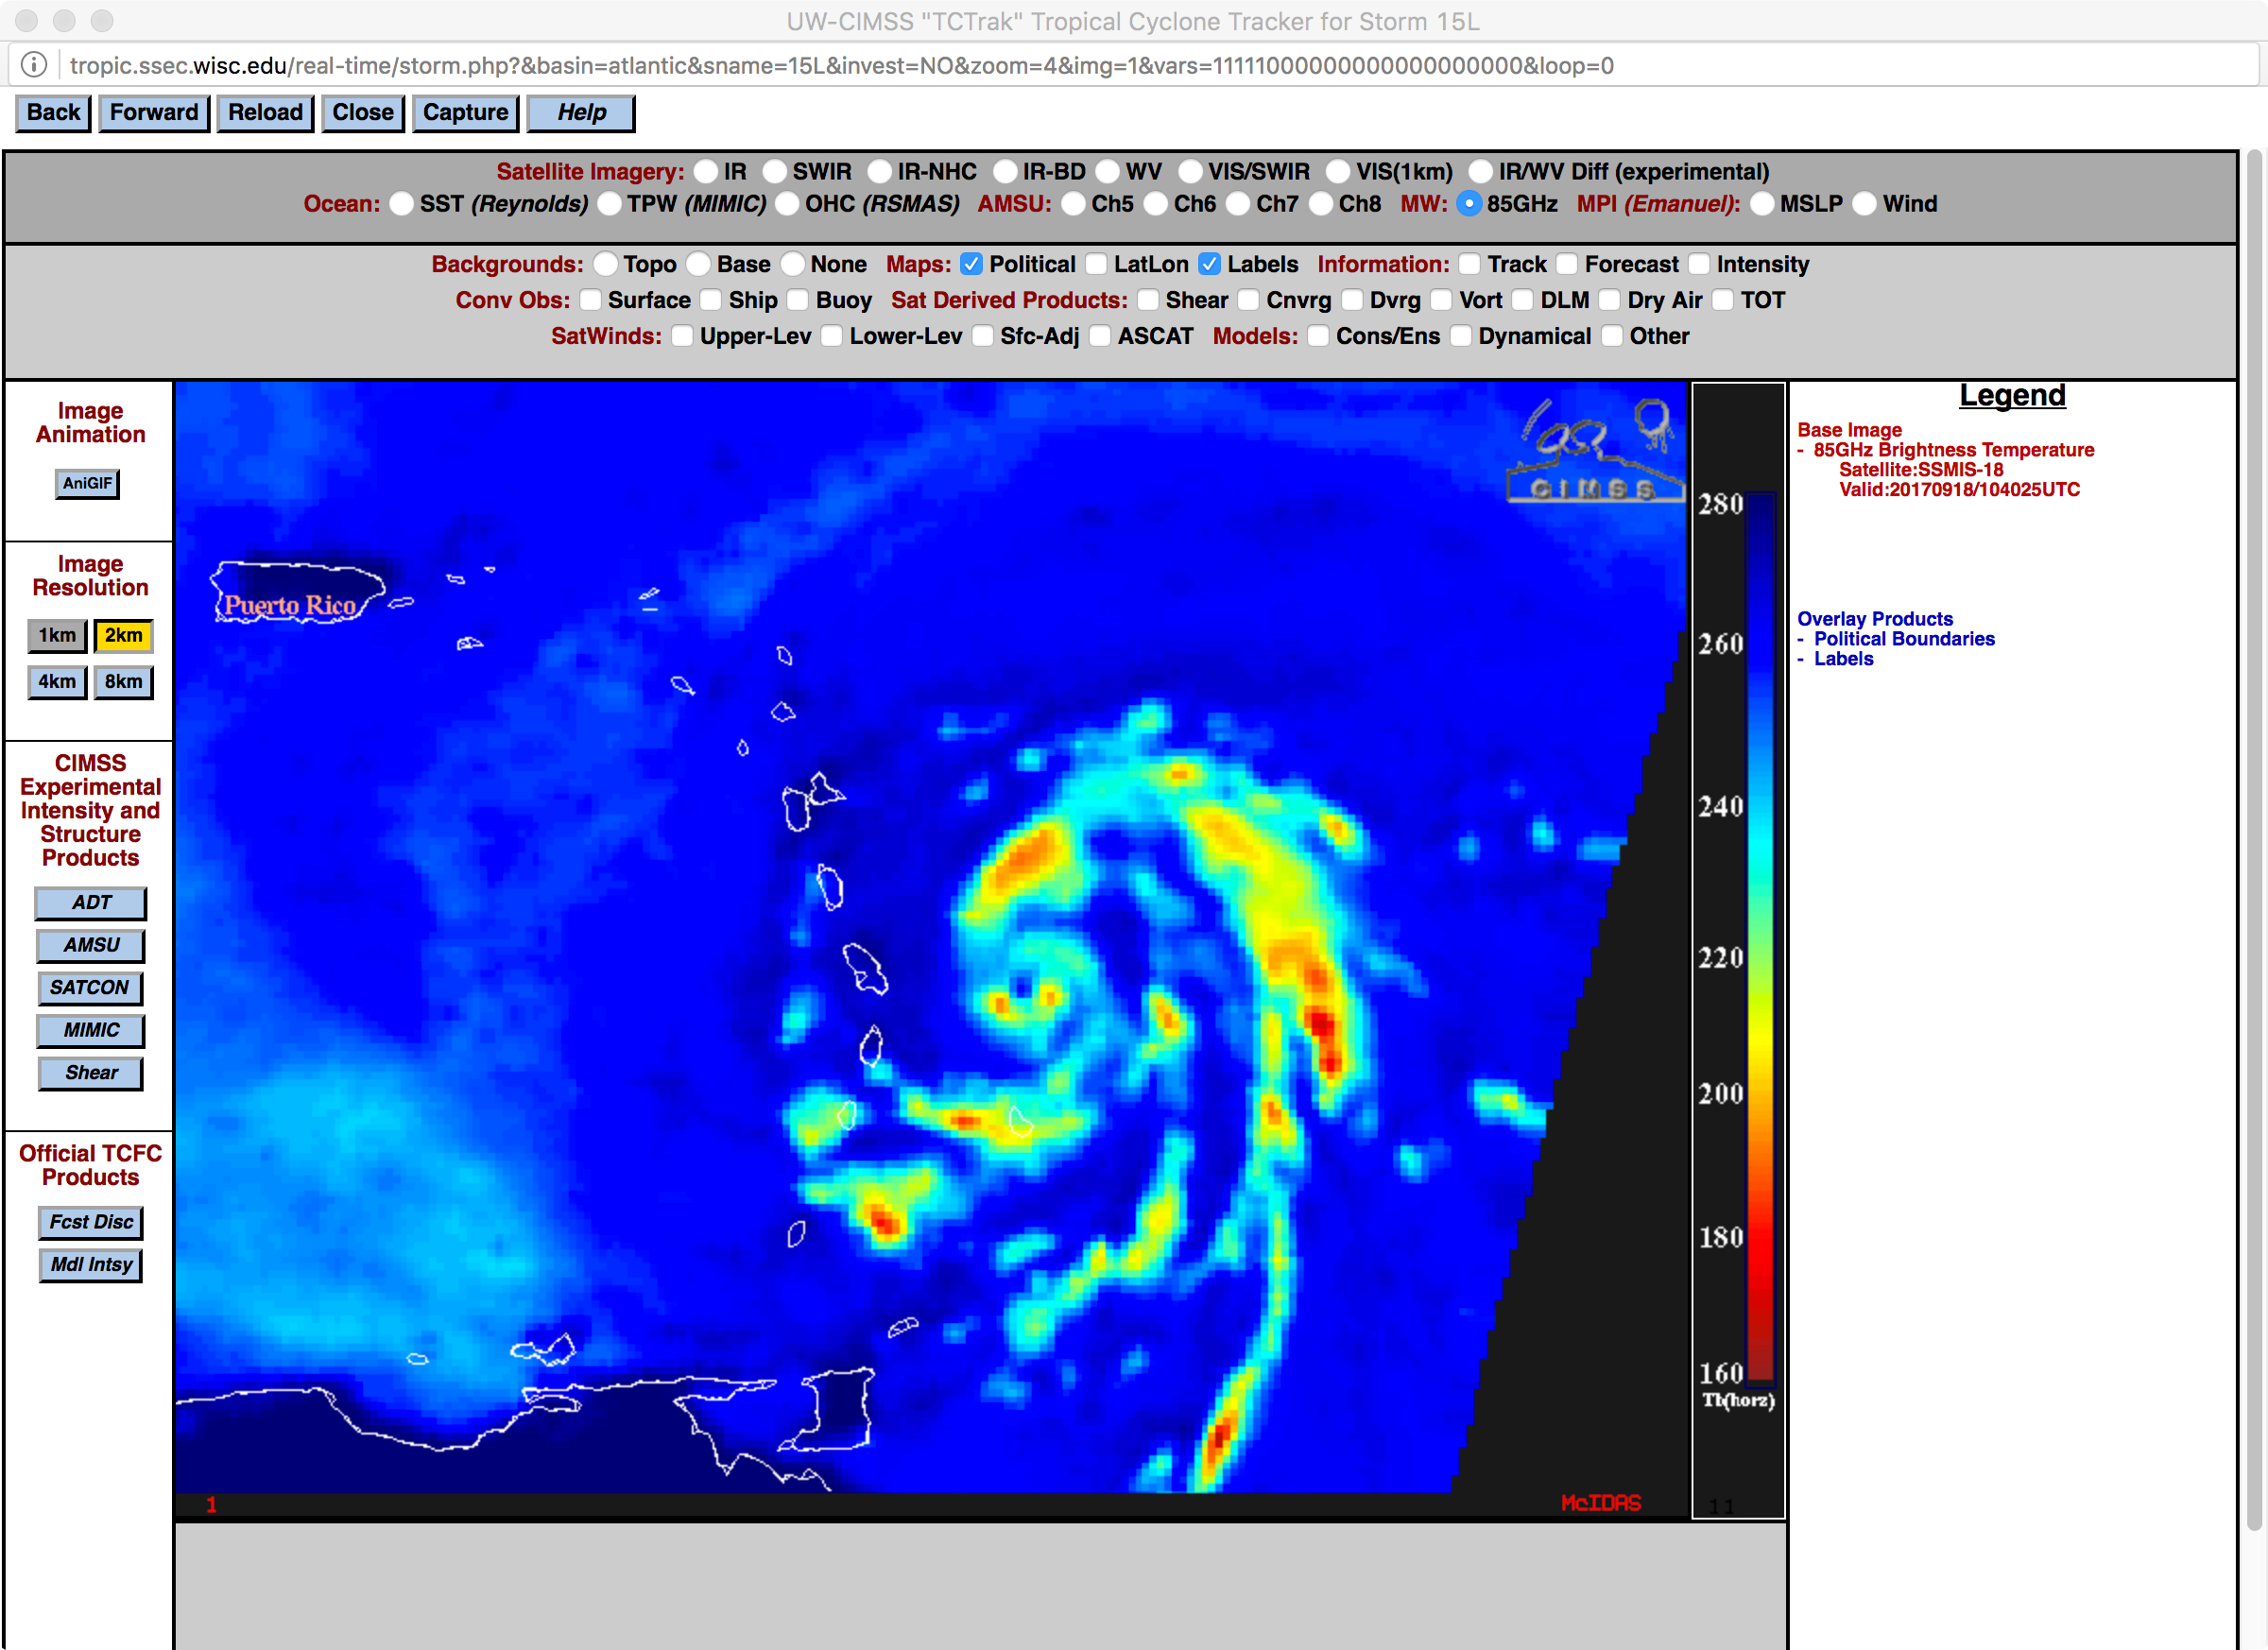
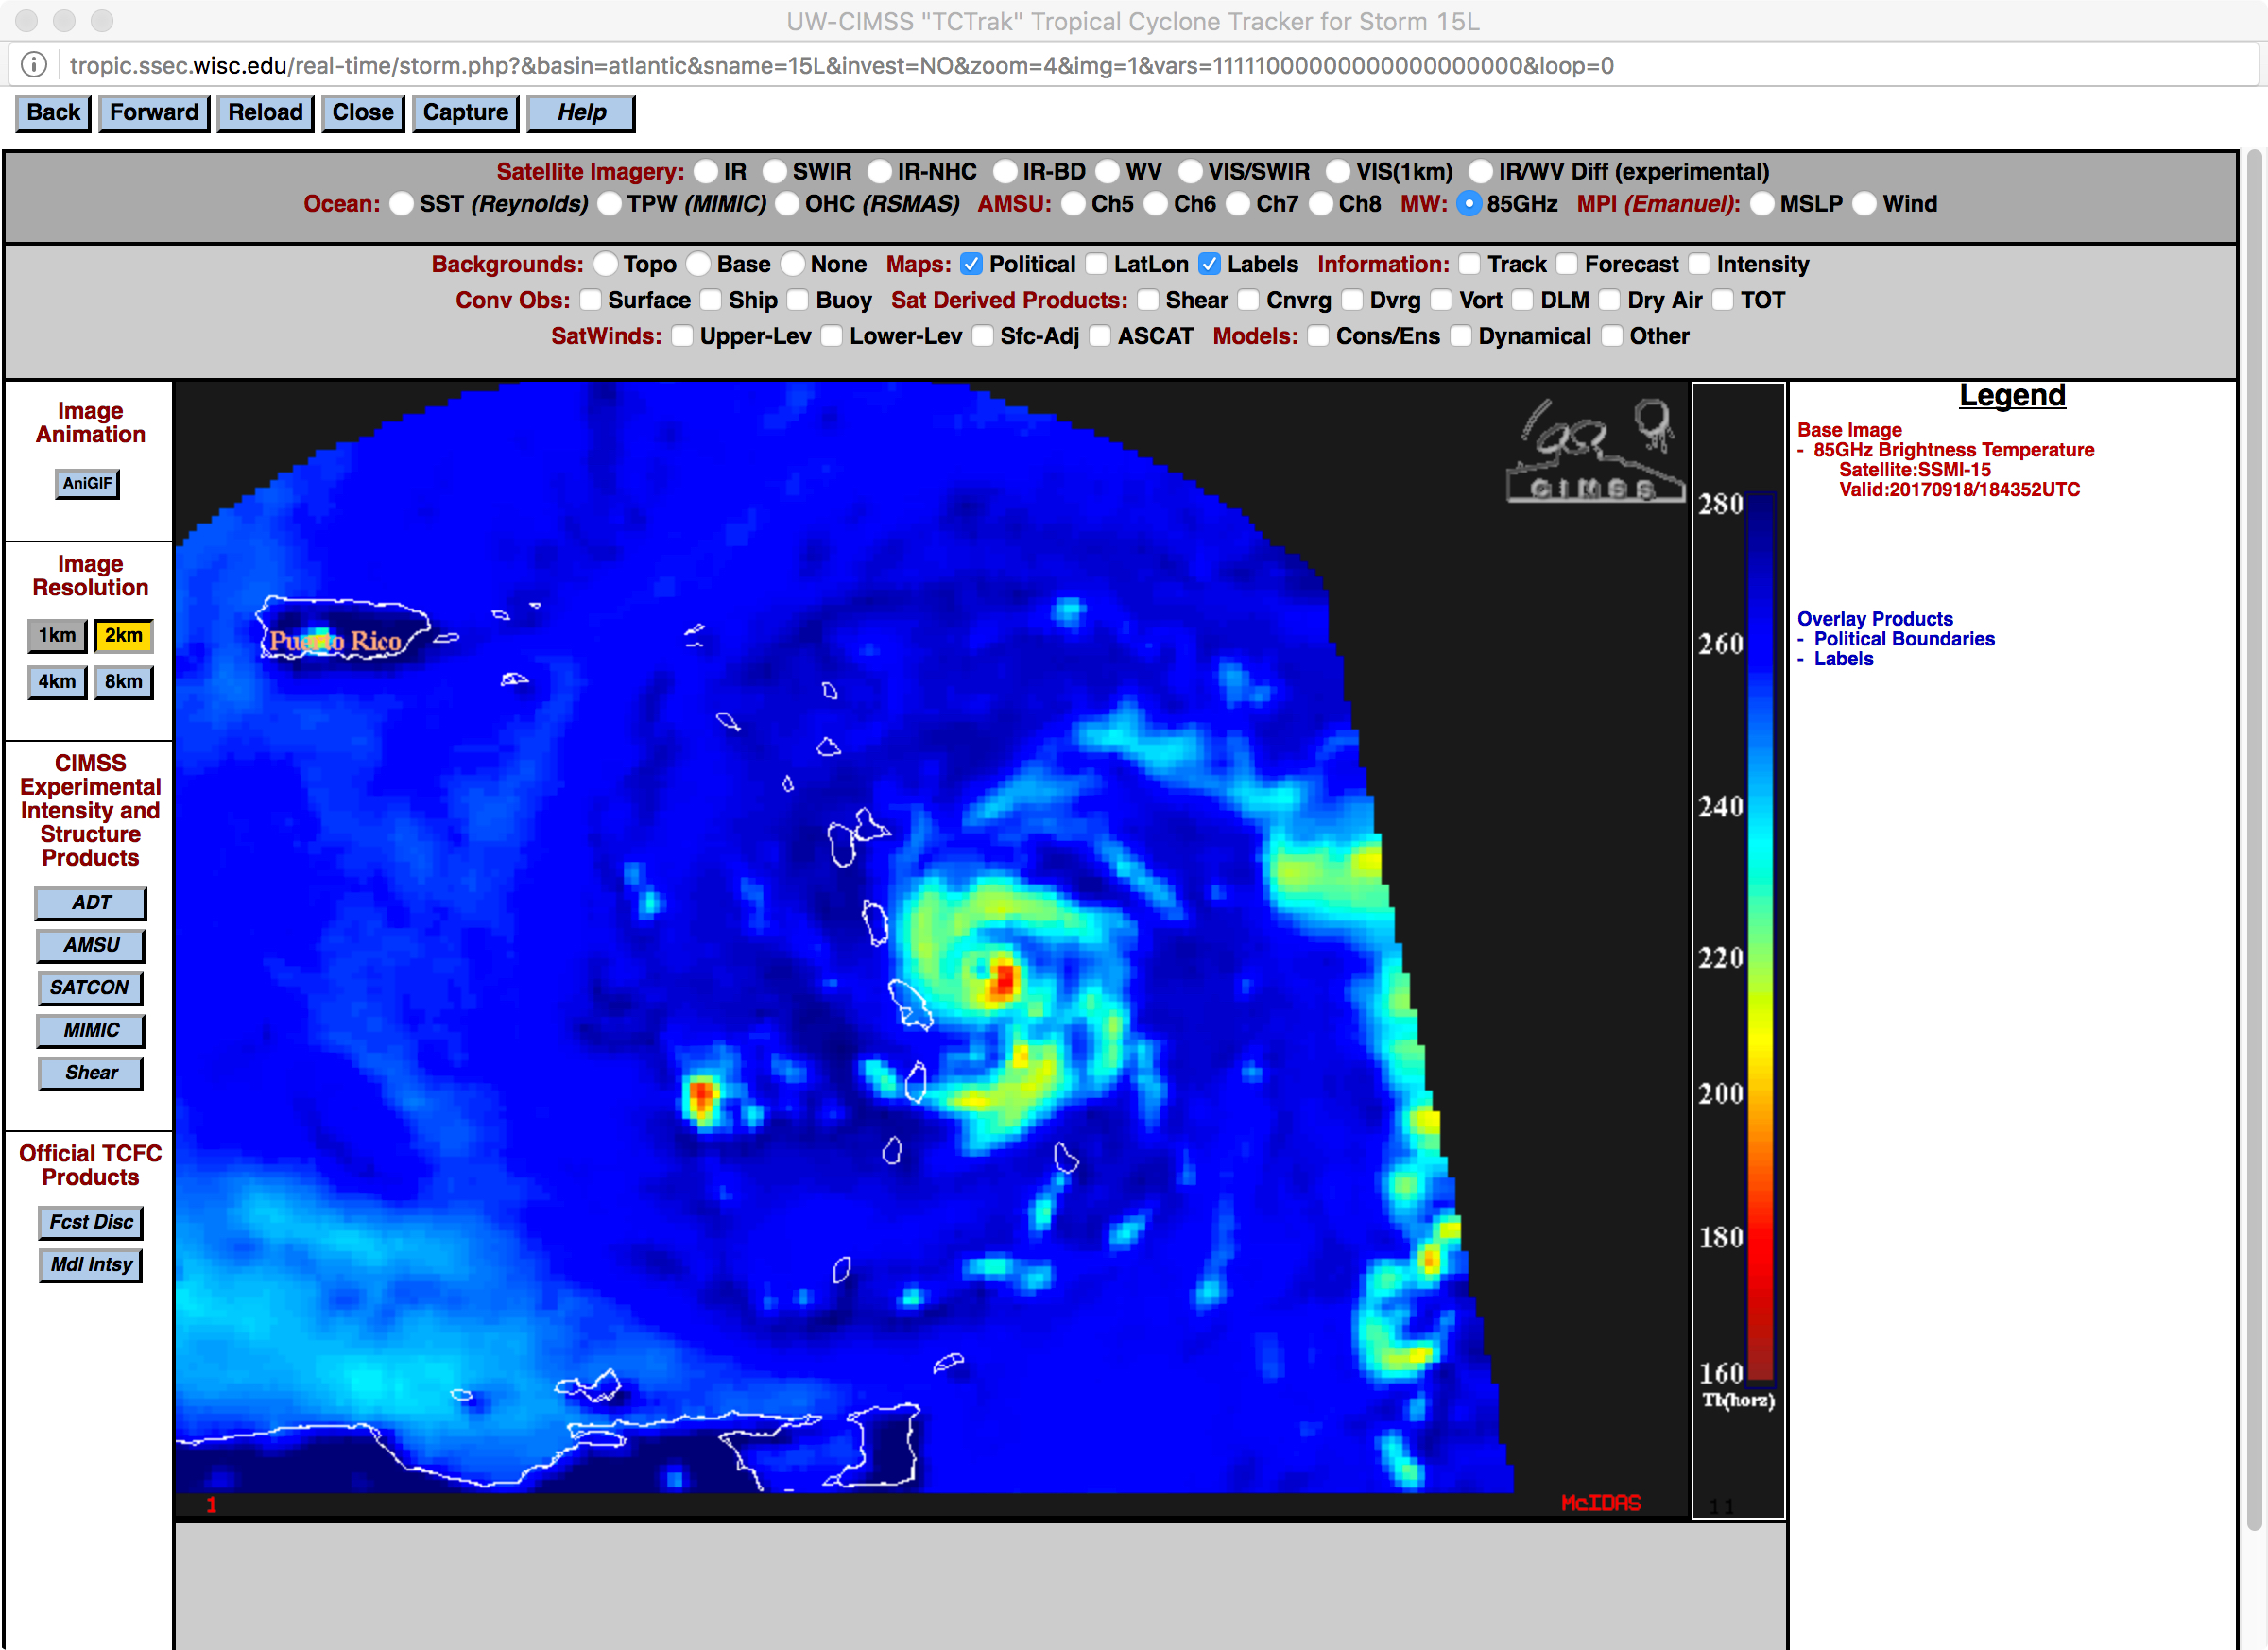
This small-diameter “pinhole eye” was also evident earlier in the day on DMSP microwave imagery at 1040 UTC, and again at 1843 UTC.
View only this post
Read Less
![GOES-16 Visible (0.64 µm, left) and Infrared Window (10.3 µm, right) images [click to animate]](https://cimss.ssec.wisc.edu/satellite-blog/wp-content/uploads/sites/5/2017/09/170917_goes16_visible_infrared_Maria_anim.gif)


