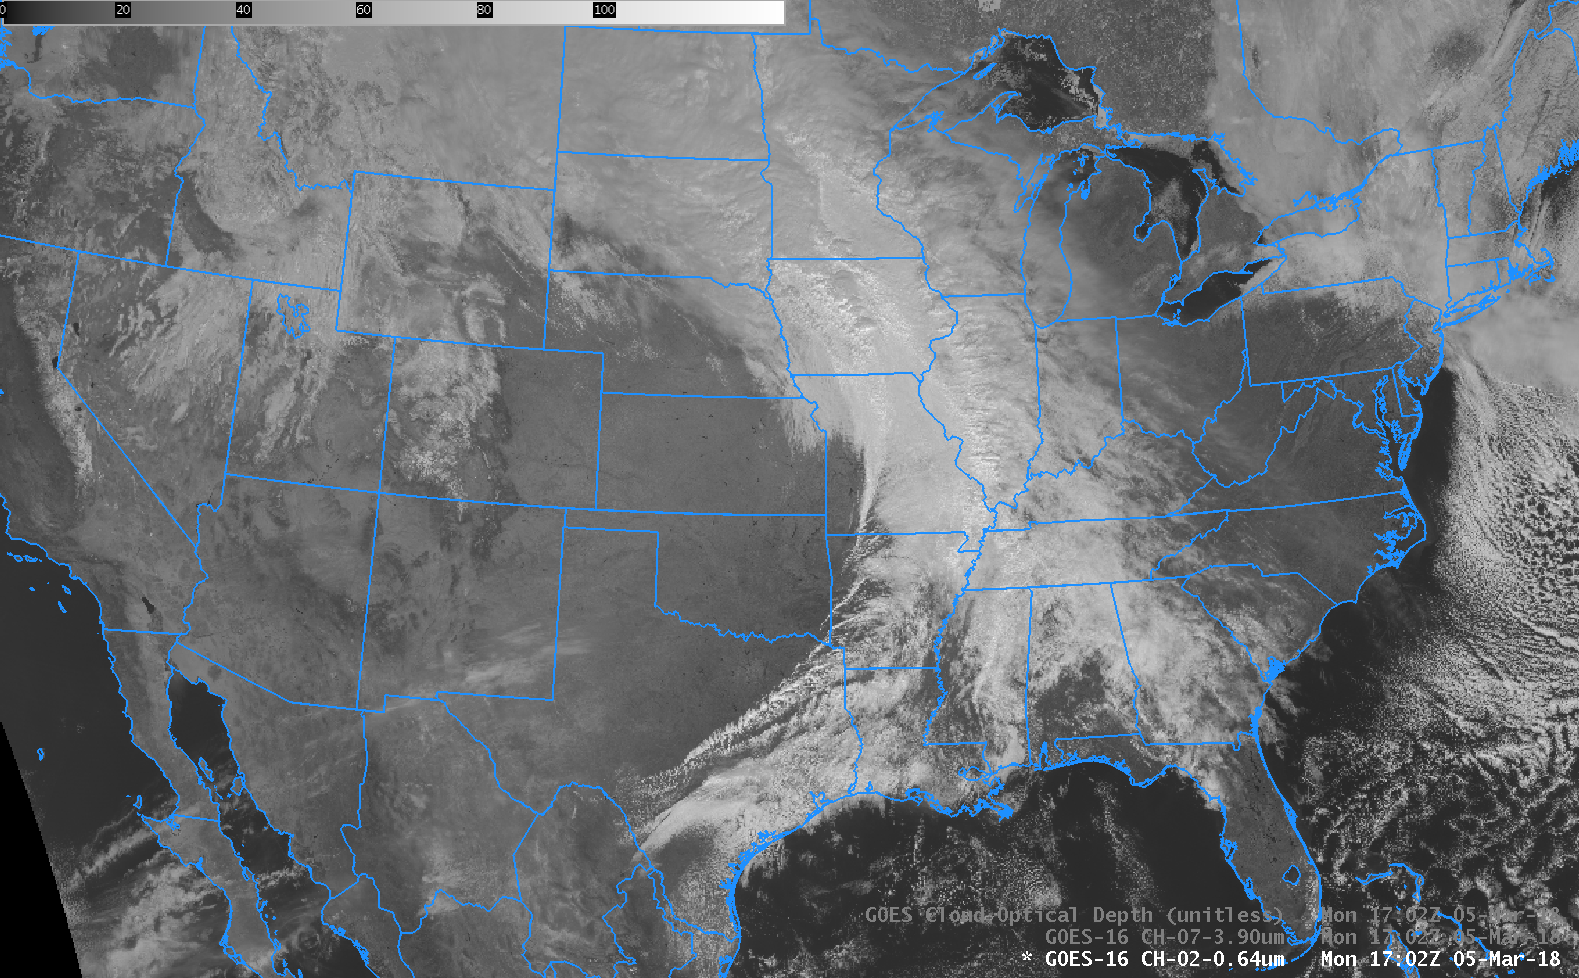
GOES-16 Visible (0.64 µm) animation, 1637-1732 UTC on 5 March 2018 (Click to enlarge)
Animations of GOES-16 Visible, near-Infrared and shortwave Infrared over North America shortly before the Vernal Equinox, and shortly after the Autumnal Equinox, (that is, when the Sun is overhead in the Southern Hemisphere) show bright spots that propagate quickly from west to east (these features were first noted by Frank Alsheimer of the National Weather Service). The animation above shows the visible imagery (0.64 µm) over the Continental United States on 5 March 2018 (Click here for a slower animation speed). Brightening over regions between 30 and 40 N between 1637 UTC and 1732 UTC is apparent. The animation below of the shortwave infrared (3.9 µm) shows slight warming (Click here for a slower animation), as might be expected with reflected solar energy. The brightening is also apparent in the Band 4 “Cirrus” (1.37 µm) — in fact, a closer look at southern Colorado reveals the bright signature of sunlight reflecting off solar panels at the Alamosa Solar Generating Facility (Google maps).
GOES-16 Shortwave Infrared (3.9 µm) animation, 1637-1732 UTC on 5 March 2018 (Click to enlarge)
The increased reflectance can cause the ABI Clear Sky Mask to mis-characterize clear regions as cloudy (See the animation below; click here for a slower animation). Thus, Cloud properties (Cloud-top Height, Temperature, Pressure, etc.) can be identified in clear regions.
GOES-16 Clear Sky Mask (White: Clouds ; Black : No Clouds) from 1637 UTC – 1732 UTC on 5 March 2018 (Click to enlarge)
The bright spots in the visible, and warms spots in the shortwave infrared, occur when the Earth’s surface, the GOES Satellite and the Sun are aligned on one line. If you were within the bright spot with a powerful telescope trained on the Sun, you would see the GOES Satellite transecting the solar disk. The location of these bright spots changes with season: they appear in the Northern Hemisphere shortly before the (Northern Hemisphere) vernal equinox and shortly after the (Northern Hemisphere) autumnal equinox. Similarly, they appear in the Southern Hemisphere shortly before the (Southern Hemisphere) vernal equinox and shortly after the (Southern Hemisphere) autumnal equinox. On the Equinox, the bright spots are centered on the Equator.
This animation (courtesy Daniel Lindsey, NOAA/CIRA and Steve Miller, CIRA) shows where the reflection disk moves during the days around the Northern Hemisphere Autumnal Equinox; a similar animation for the Northern Hemisphere vernal equinox would show a disk starting at the North Pole and moving southward with time.
The animation below (from this link that is used for calibration exercises), shows the difference in reflectance (Bands 1-6) or Brightness Temperature (Bands 7-16) between 1657 and 1652 UTC on 3 and 5 March 2018. Two things are apparent: The centroid of the largest difference in solar reflectance has moved southward in those two days, as expected; the effect of this solar backscatter is most obvious in the visible, near-infrared and shortwave infrared channels (that is, bands 1-7 on the ABI). The effect is most pronounced in clear skies.
Time Difference in each of the 16 ABI Channels (1657 – 1652 UTC) on 3 and on 5 March 2018 (Click to enlarge)
This reflectance feature is also detectable in legacy GOES Imagery. However, the great improvements in detection and calibration in the GOES-R Series ABI (and AHI on Himawari-8 and Himawari-9) and the better temporal resolution with the GOES-R Series allows for better visualization of the effect.
The feature also shows up in “True Color” Imagery, shown below (from this site). Geocolor imagery (shown here), from CIRA, also shows the brightening.

CIMSS Natural True Color Animation ending 1757 UTC on 5 March 2018 (Click to enlarge)
Thanks to Daniel Lindsey and Tim Schmit, NOAA/ASPB, Steve Miller, CIRA and Mat Gunshor/Scott Bachmeier, CIMSS, for contributions to this blog post.
View only this post Read Less
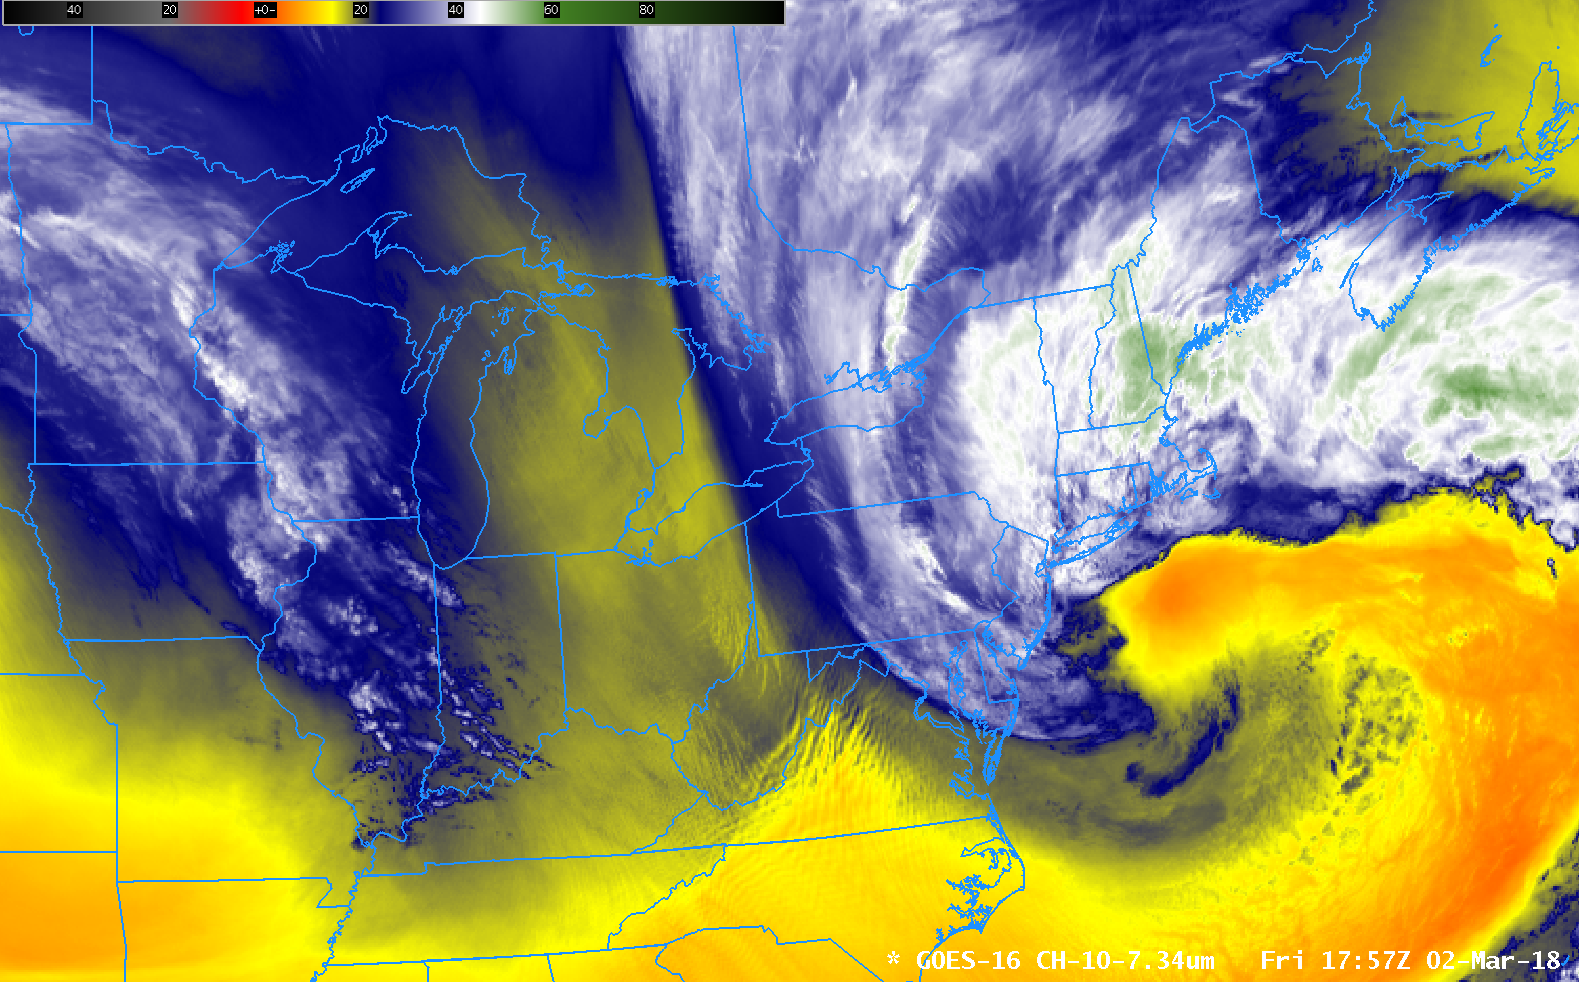
![GOES-16 Mid-level (6.9 µm) images, with plots of hourly wind gusts [click to play MP4 animation]](https://cimss.ssec.wisc.edu/satellite-blog/wp-content/uploads/sites/5/2018/03/G16_WATER_VAPOR_NOREASTER_02_03MAR2018_960x1280_B9_2018061_180223_0001PANEL_00217.GIF)

![GOES-16 Mid-level (6.9 µm) images, with surface fronts and Metop ASCAT surface scatterometer winds [click to play animation]](https://cimss.ssec.wisc.edu/satellite-blog/wp-content/uploads/sites/5/2018/03/G16_wv_noreaster-20180303_160522.png)
![NOAA-20 True-color RGB image, centered of Lake Erie [click to enlarge]](https://cimss.ssec.wisc.edu/satellite-blog/wp-content/uploads/sites/5/2018/03/180303_1839utc_noaa20_viirs_truecolor.jpeg)


![GOES-16 “Red” Visible (0.64 µm, top), “Blue” Visible (0.47 µm, middle) and Near-Infrared “Snow/Ice” (1.61 µm, bottom) images, with plots of surface reports [click to play animation]](https://cimss.ssec.wisc.edu/satellite-blog/wp-content/uploads/sites/5/2018/03/180301_goes16_visible_cirrus_GOES_S_launch_anim.gif)
![GOES-16 Upper-level (6.2 µm, top), Mid-level (6.9 µm, middle) and Low-level (7.3 µm, bottom) images [click to play animation]](https://cimss.ssec.wisc.edu/satellite-blog/wp-content/uploads/sites/5/2018/03/180301_goes16_water_vapor_GOES_S_launch_anim.gif)
![GOES-16 Upper-level (6.2 µm, top), Mid-level (6.9 µm, middle) and Shortwave Infrared (3.9 µm, bottom) image [click to enlarge]](https://cimss.ssec.wisc.edu/satellite-blog/wp-content/uploads/sites/5/2018/03/180301_goes16_water_vapor_shortwaveIR_GOES_S_launch_anim.gif)
![Multi-panel images showing all 16 spectral bands of the GOES-16 ABI [click to play animation]](https://cimss.ssec.wisc.edu/satellite-blog/wp-content/uploads/sites/5/2018/03/180301_goes16_16panel_GOES_S_launch_anim.gif)
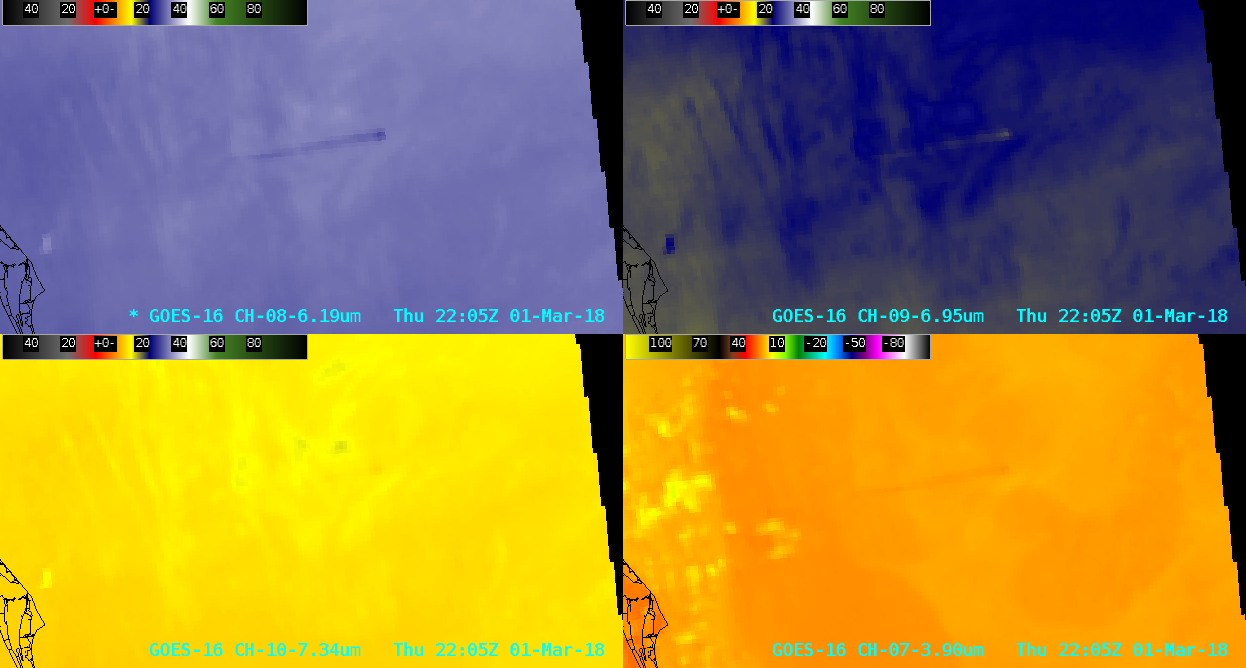
![GOES-16 Upper-level (6.2 µm, top left), Mid-level (6.9 µm, top right), Low-level (7.3 µm, bottom left) and Shortwave Infrared (3.9 µm, bottom right) images [click to enlarge]](https://cimss.ssec.wisc.edu/satellite-blog/wp-content/uploads/sites/5/2018/03/180301_goes16_WaterVapor_SgortwaveInfrared_GOES_S_awips_anim.gif)
