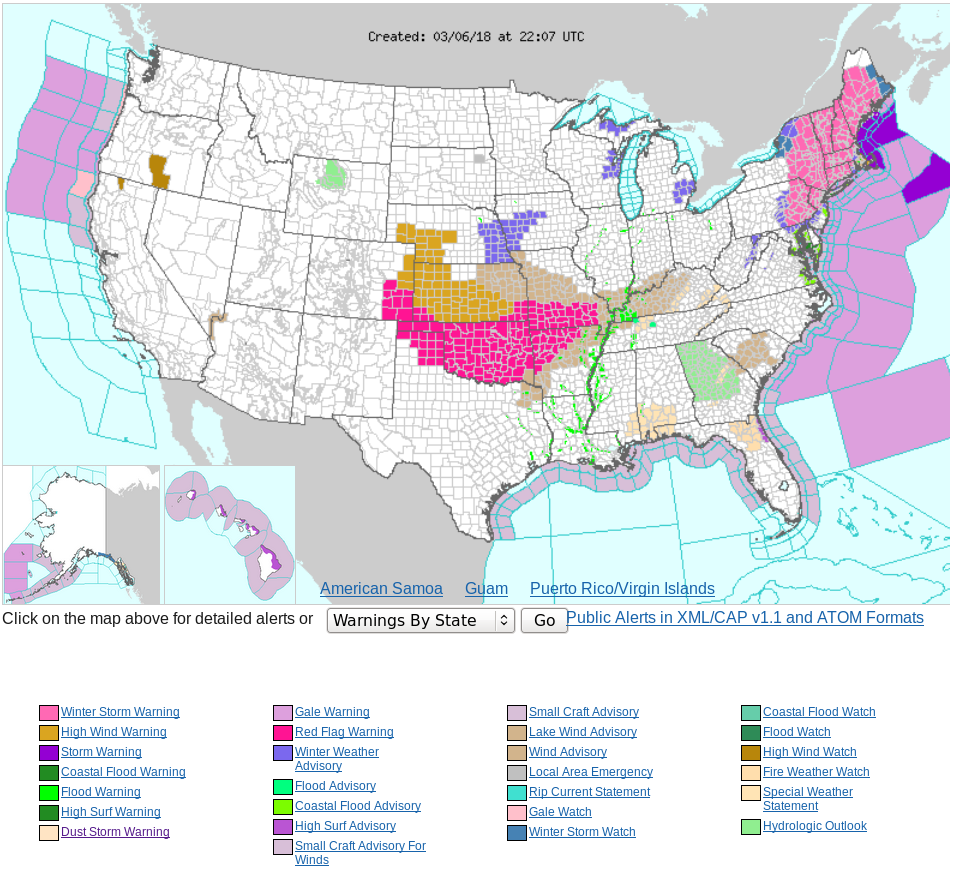
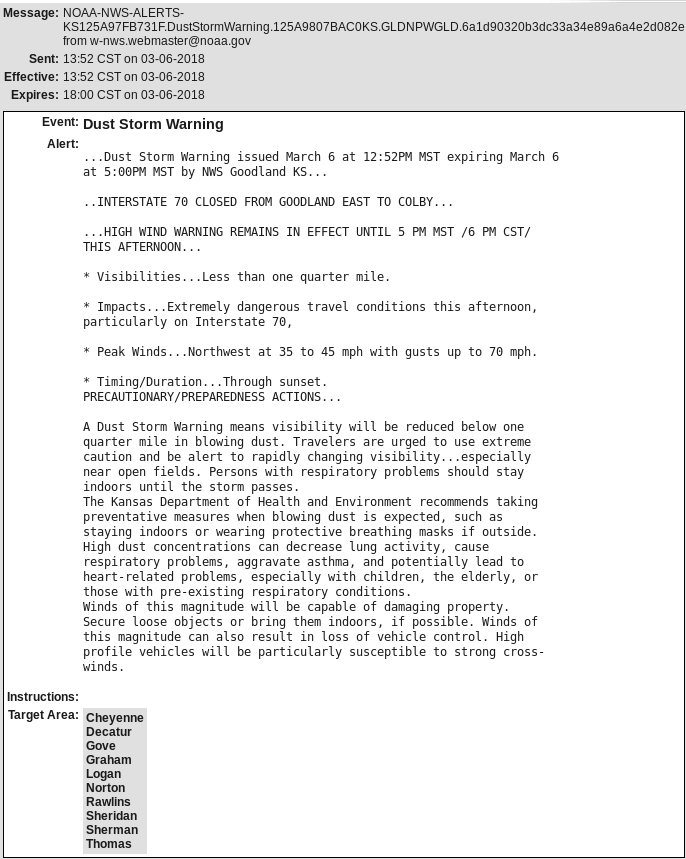
Strong northwesterly winds over the Great Plains to the west of a storm system over the mid-Mississippi River Valley have resulted in Red Flag Warnings over Oklahoma, and High Wind Warning and Dust Storm Warnings — including the closing of I-70 over Kansas. Visible Imagery in the “Blue Band”, above, shows little indication of the blowing dust (Click here for an animation without surface observations); dust is difficult to observe when sun... Read More
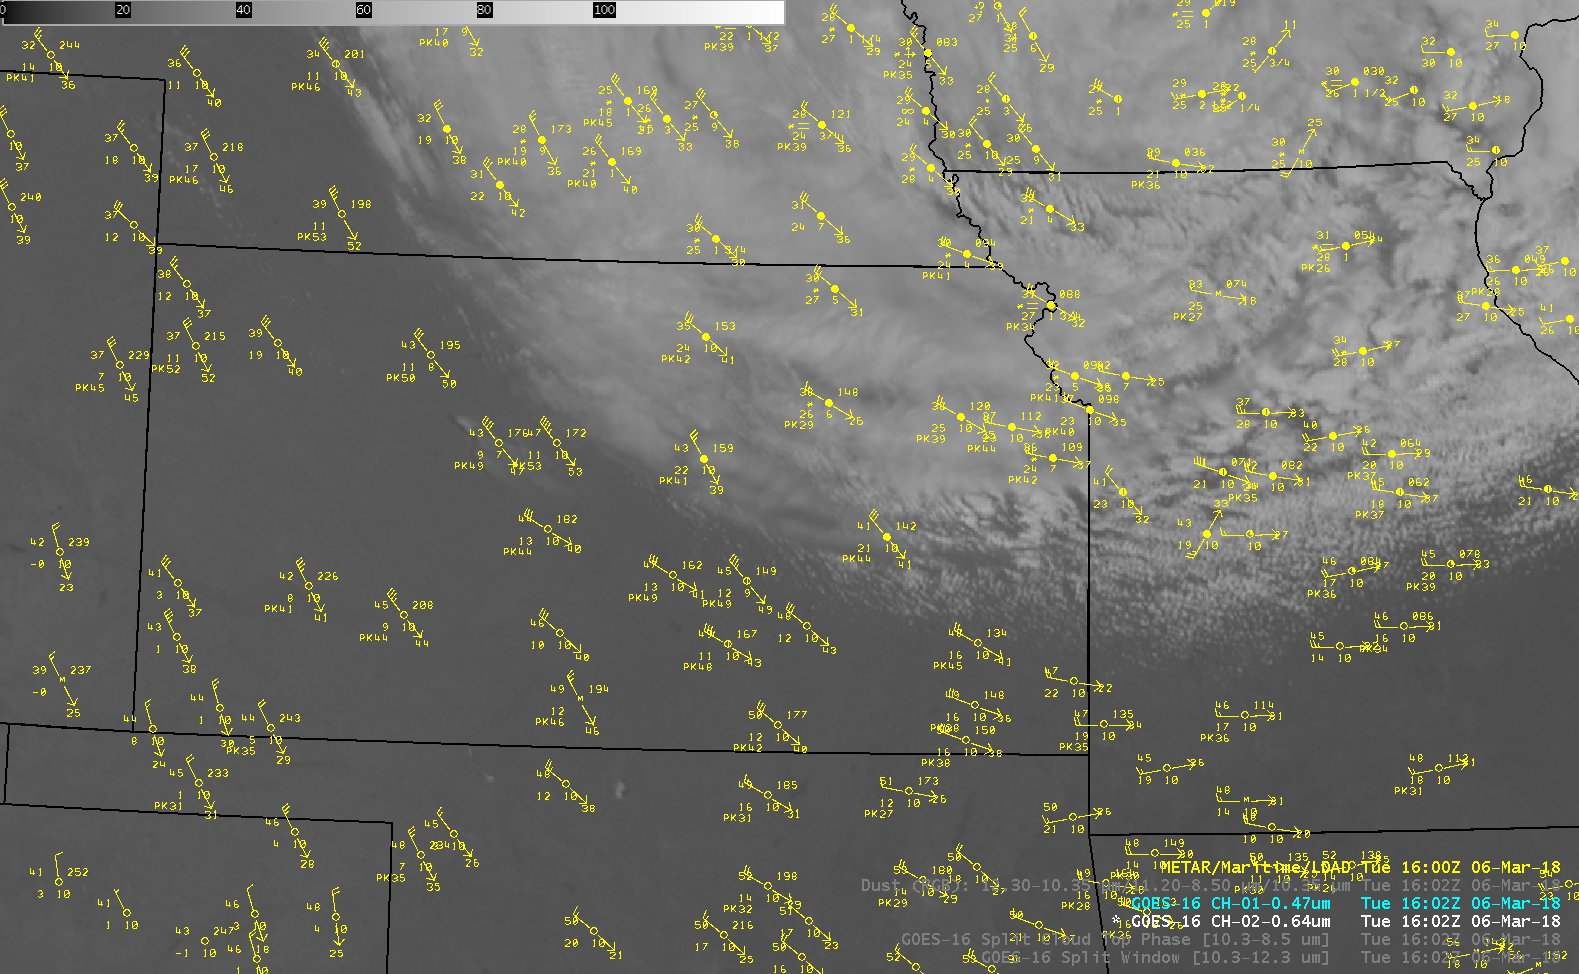
GOES-16 Band 1 (“Blue Visible”) 0.47 µm Imagery, 1502 – 2132 UTC on 6 March 2018 along with surface METAR observation plots (Click to animate)
Strong northwesterly winds over the Great Plains to the west of a storm system over the mid-Mississippi River Valley have resulted in Red Flag Warnings over Oklahoma, and High Wind Warning and Dust Storm Warnings — including the closing of I-70 over Kansas. Visible Imagery in the “Blue Band”, above, shows little indication of the blowing dust (Click here for an animation without surface observations); dust is difficult to observe when sun angle are high. The higher-(spatial) resolution “Red Visible” animation, shown below, similarly struggles to identify with clarity where the dust is occurring.
The ‘Blue Band’ does detect plumes of smoke that develop over southern Kansas during this animation, plumes that originate over ‘hot spots’ in the 3.9 µm shortwave infrared imagery (not shown).
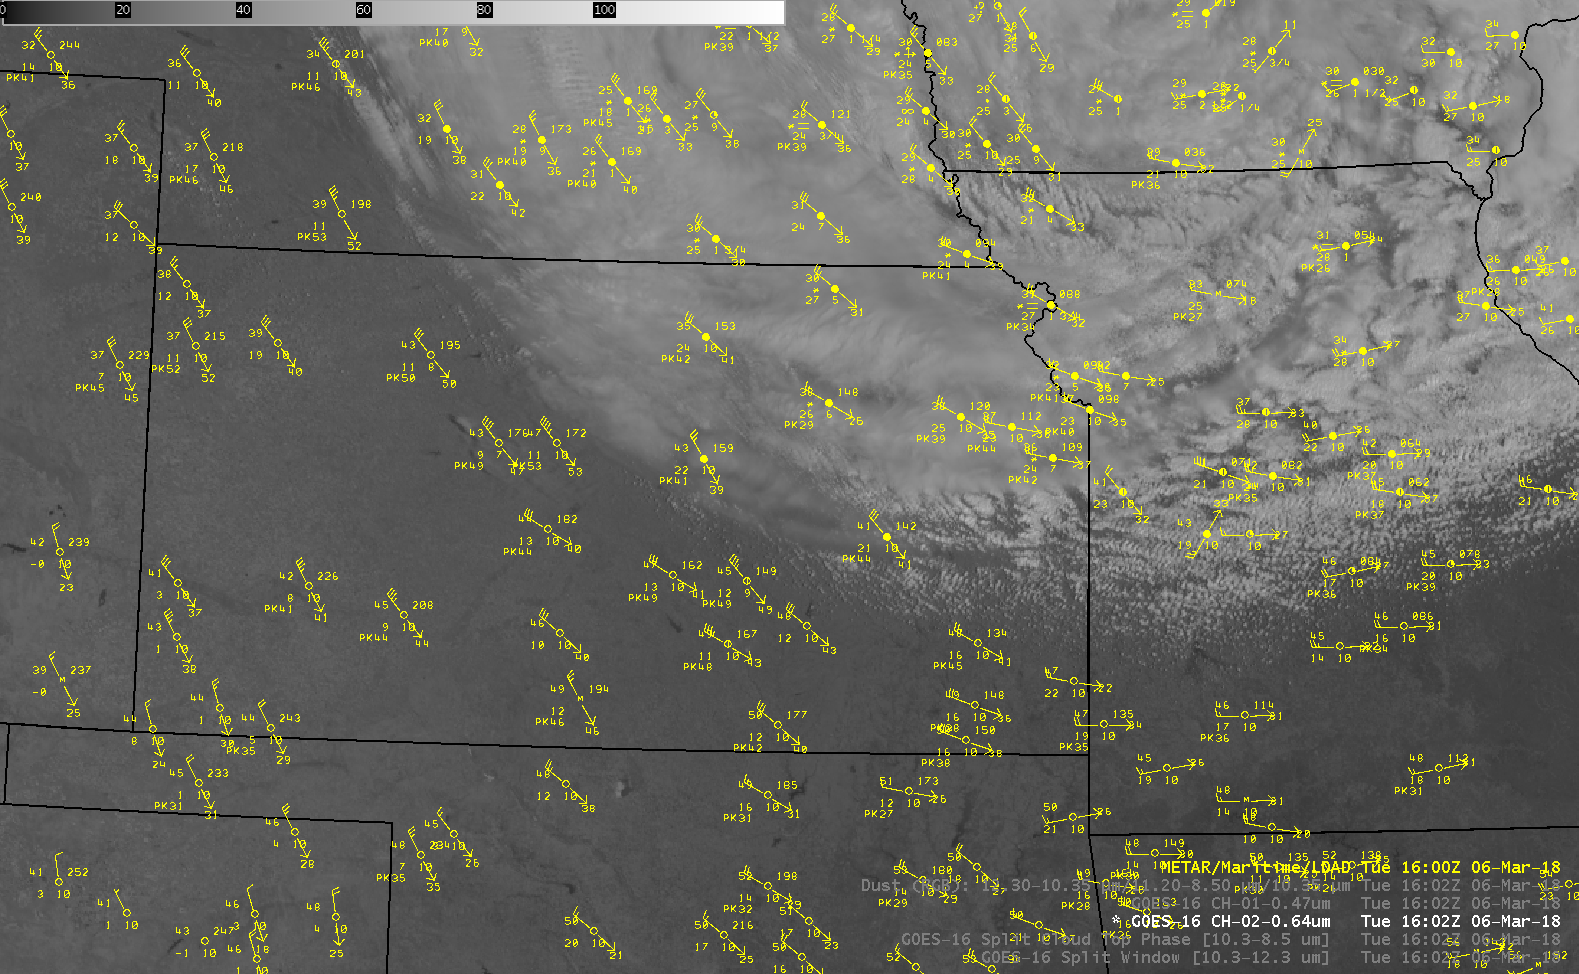
GOES-16 Band 2 (“Red Visible”) 0.64 µm Imagery, 1502 – 2132 UTC on 6 March 2018 along with surface METAR observation plots (Click to animate)
Infrared Imagery can be used to detect dust, both during the day and at night. This is because dust selectively absorbs energy. For example, energy at 10.3 µm that is emitted by the surface, and destined to be observed by the satellite, will be absorbed (and re-emitted from a higher, cooler level in the atmosphere) as it passes through the dust layer. Energy with a longer wavelength (12.3 µm), passes through dust mostly unaffected. Thus, a difference field between the two — the so-called Split Window Difference — will show negative values in regions where lofted dust is present in the atmosphere. An animation is shown below. As with imagery in this blog post, the colormap in the AWIPS display was changed to “Grid/Lowrange Enhanced”; dust regions are highlighted in yellow. Dust is first detected in central Nebraska before it shows up in central and western Kansas. A closer view of the area where Interstate 70 was closed (between Goodland and Colby in northwestern Kansas) can be seen here.
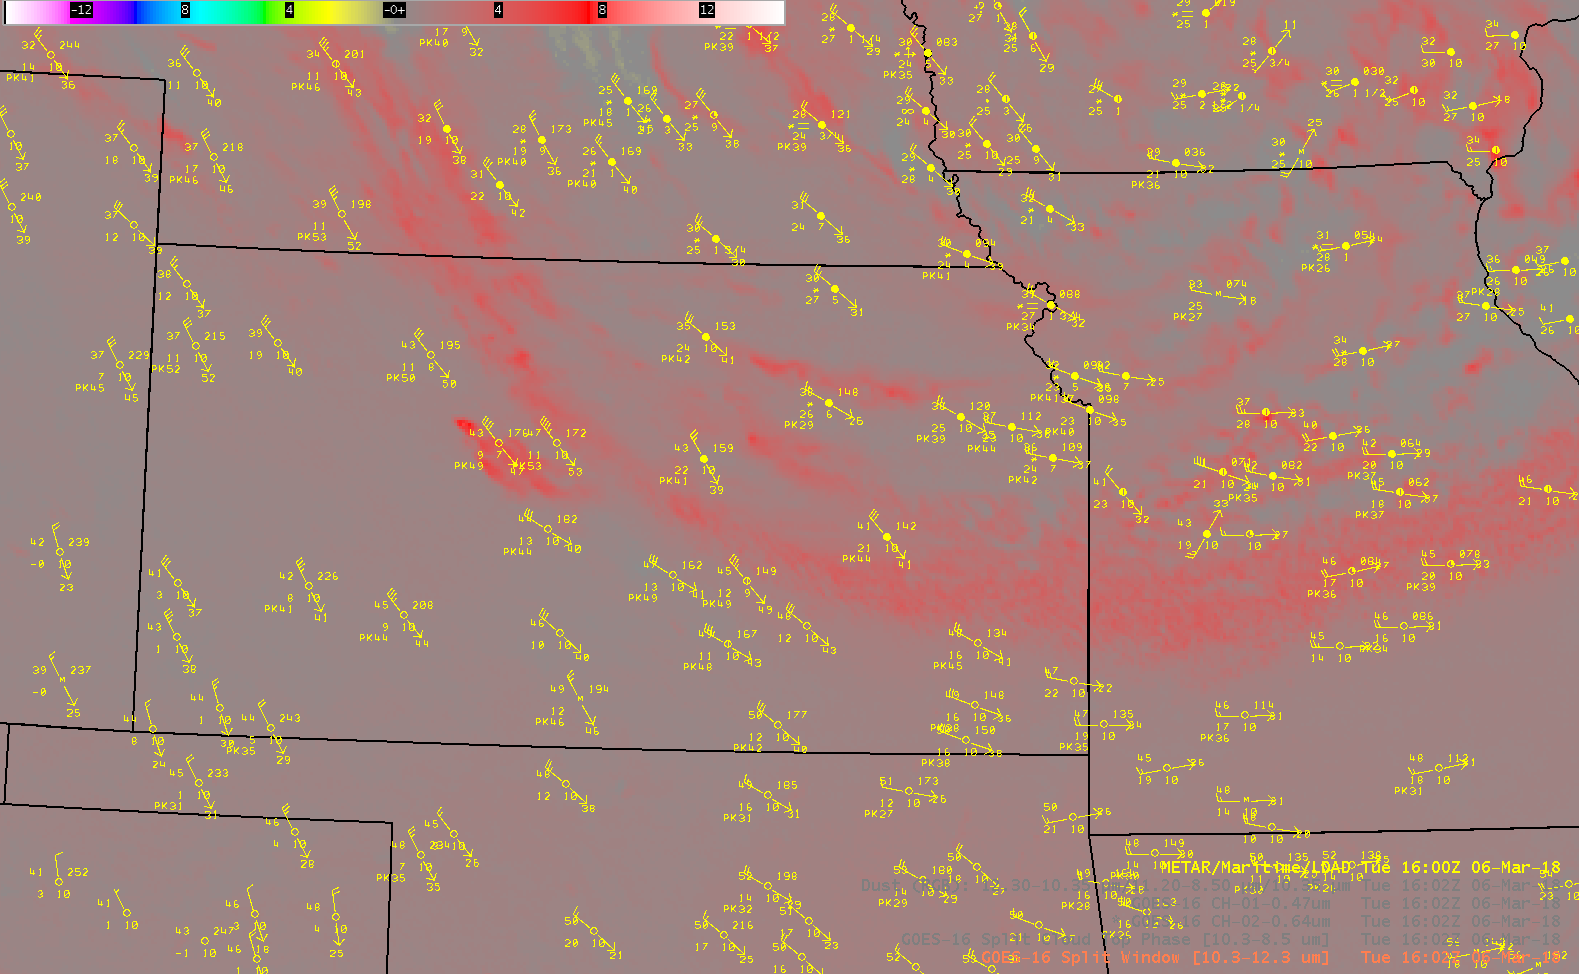
GOES-16 Split Window Difference Field (10.3 µm – 12.3 µm) Imagery, 1502 – 2132 UTC on 6 March 2018 along with surface METAR observation plots (Click to animate)
The Cloud Phase Channel Difference field in AWIPS (Currently 10.3 µm – 8.5 µm, shortly to transition in AWIPS to 11.2 µm – 8.5 µm) can also detect dust (as was shown in this blog post), and that animation is shown below. Blowing Dust in this field is a bright green — and this Difference field (compared to the Split Window Difference) better identifies sources of plumes over western Kansas.
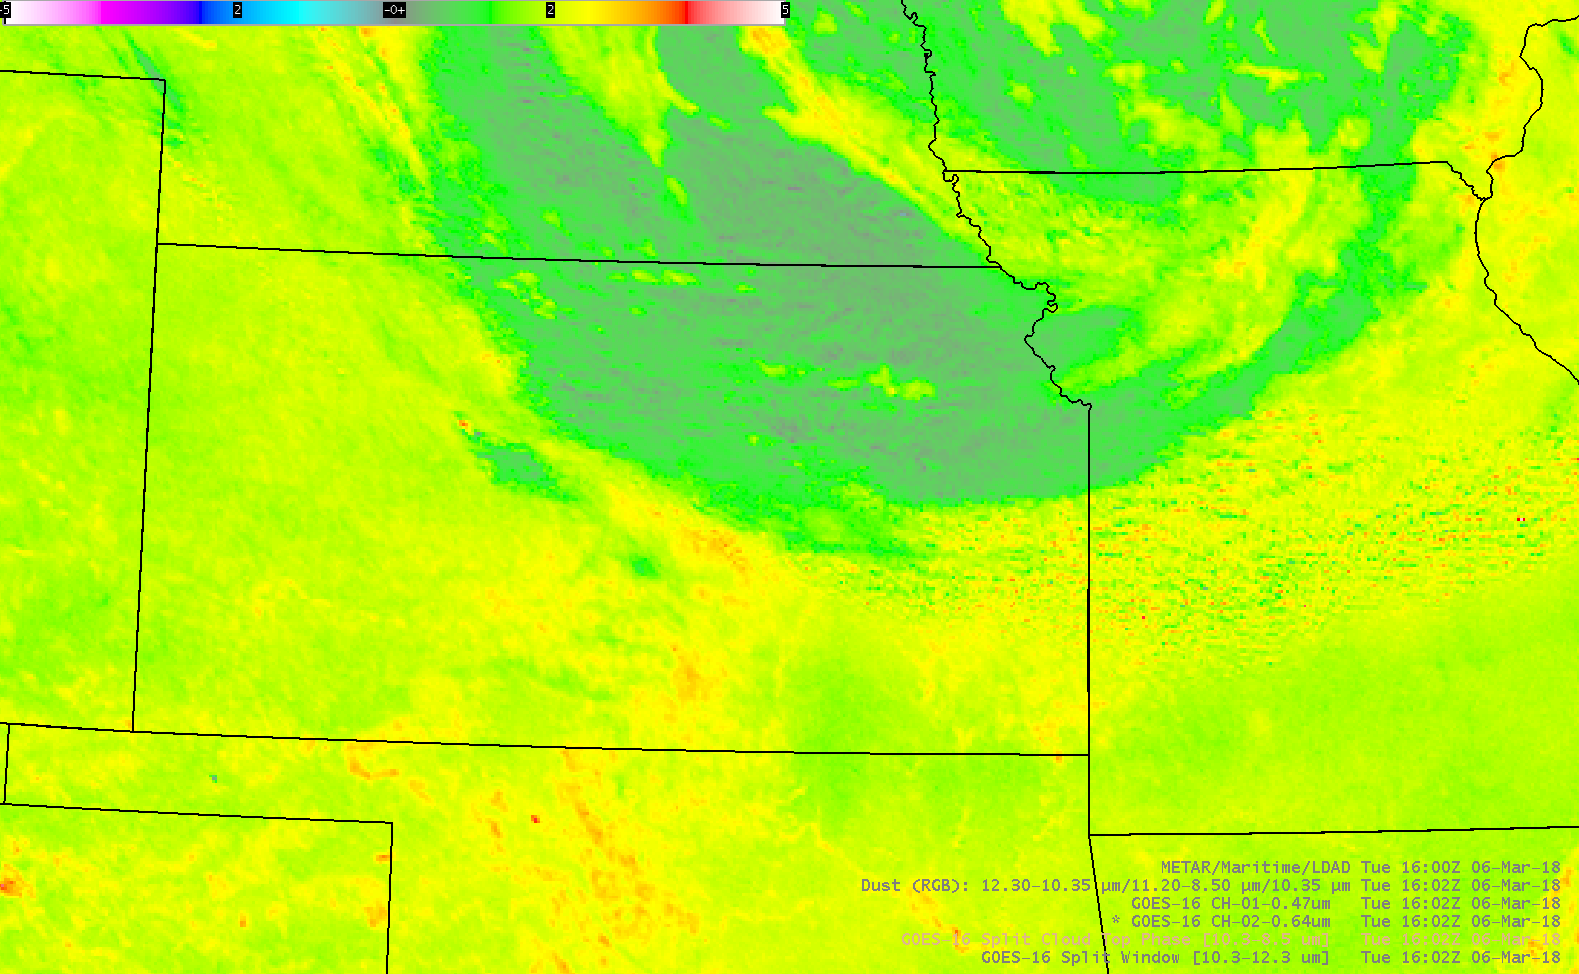
GOES-16 Cloud Phase Brightness Temperature Difference Field (10.3 µm – 8.5 µm) Imagery, 1502 – 2132 UTC on 6 March 2018 (Click to animate)
The Dust RGB, below, combines both the Split Window Differerence (the ‘Red Gun’) and the Cloud Phase Brightness Temperature Difference (the ‘Green Gun’), as well as the Clean Window (10.3 µm, ‘Blue Gun’, not shown). Dust in this RGB is typically bright pink, and its presence is notable over western Kansas.
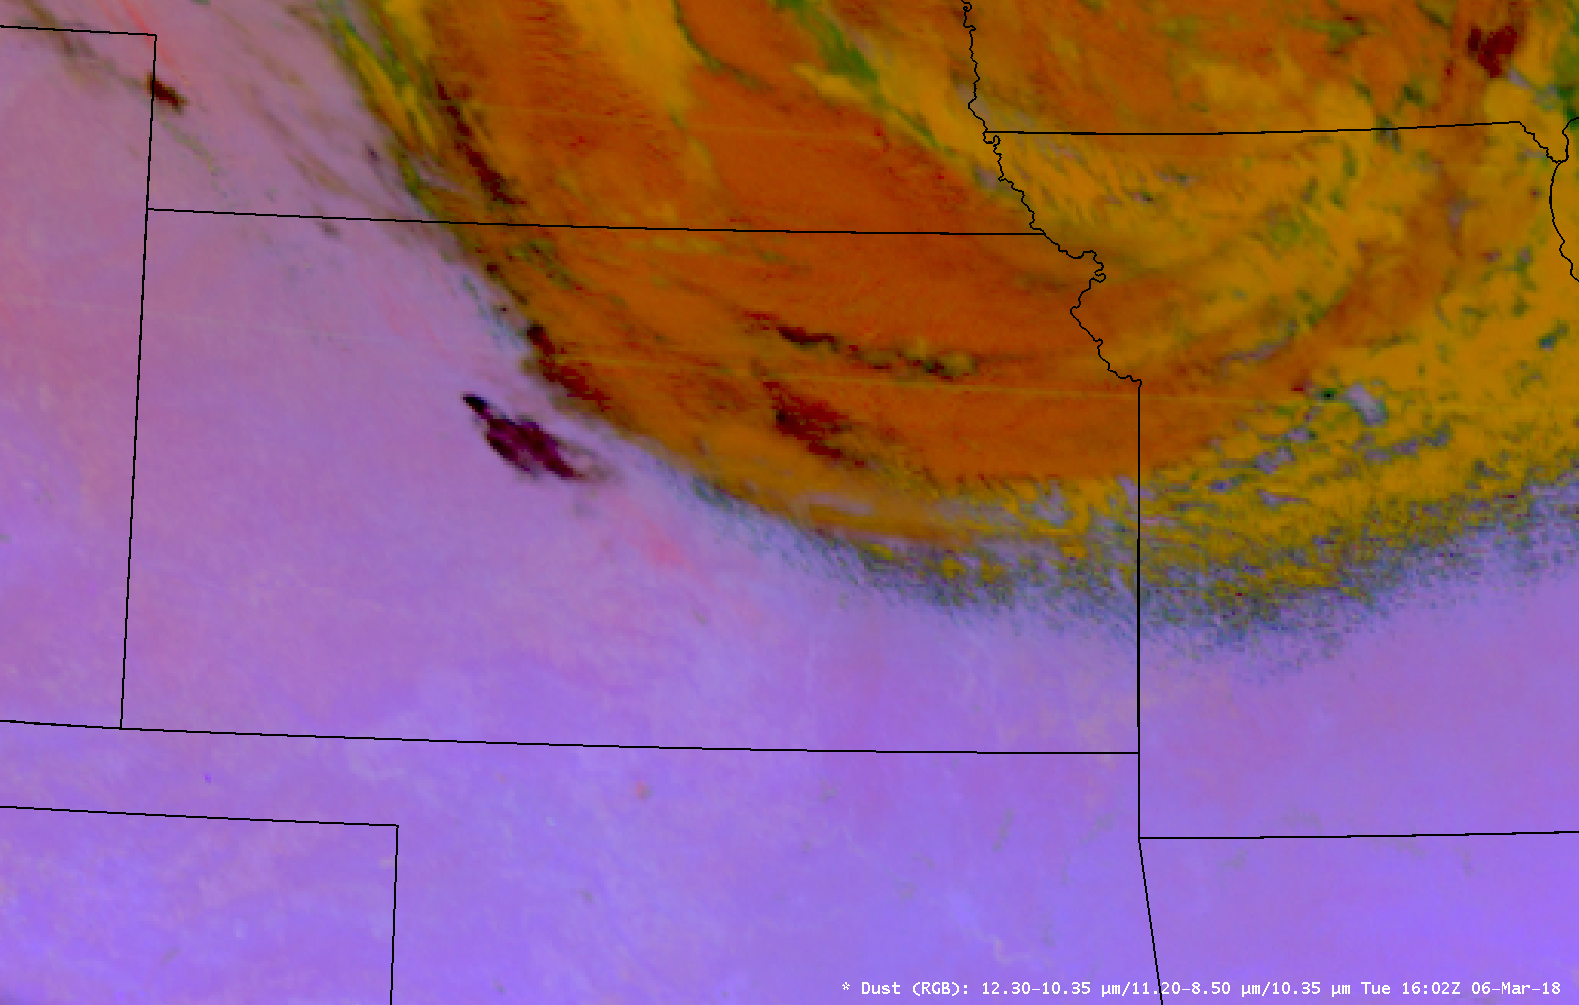
GOES-16 Dust Red-Green-Blue (RGB) Composite Imagery, 1502 – 2132 UTC on 6 March 2018 (Click to animate)
Closer to sunset, at 2252 UTC on 6 March, the Dust Plume is readily apparent in the Band 1 and Band 2 imagery, shown below in a toggle with infrared channel differences and the Dust RGB.
GOES-16 Band 1 (“Blue Visible”) 0.47 µm Imagery, Band 2 (“Red Visible”) 0.64 µm Imagery, Split Window Difference (10.3 µm – 12.3 µm), Cloud Phase (10.3 µm – 8.5 µm) Brightness Temperature Difference and Dust RGB, all at 2252 UTC on 6 March 2018 (Click to enlarge)
Hat tip to Jeremy Martin, the SOO in the Goodland KS National Weather Service Office, for alerting us to this case!
View only this post
Read Less

![GOES-16 Mid-level (6.9 µm) Water Vapor images, with plots of hourly surface weather symbols [click to play MP4 animation]](https://cimss.ssec.wisc.edu/satellite-blog/wp-content/uploads/sites/5/2018/03/G16_WV9_EASTERN_US_12MAR2018_960x1280_B9_2018071_180222_0001PANEL_00217.GIF)


