GOES-16 (GOES-East) Low-level (7.3 µm), Mid-level (6.9 µm) and Upper-level (6.2 µm) Water Vapor images (above) revealed an interesting packet of gravity waves in the vicinity of Guadalupe Island (west of Baja California) on 15 March 2018. The mechanism forcing these waves was not entirely clear, making it a suitable candidate for the “What... Read More
![GOES-16 Low-level (7.3 µm, left), Mid-level (6.9 µm, center) and Upper-level (6.2 µm, right) Water Vapor images [click to play animation]](https://cimss.ssec.wisc.edu/satellite-blog/wp-content/uploads/sites/5/2018/03/G16_WATER_VAPOR_GUADALUPE_15MAR2018_960x427_B1098_2018074_170224_0003PANELS_00061.GIF)
GOES-16 Low-level (7.3 µm, left), Mid-level (6.9 µm, center) and Upper-level (6.2 µm, right) Water Vapor images [click to play animation]
GOES-16
(GOES-East) Low-level (
7.3 µm), Mid-level (
6.9 µm) and Upper-level (
6.2 µm) Water Vapor images
(above) revealed an interesting packet of gravity waves in the vicinity of
Guadalupe Island (west of Baja California) on 15 March 2018. The mechanism forcing these waves was not entirely clear, making it a suitable candidate for the “What the heck is this?” blog category.
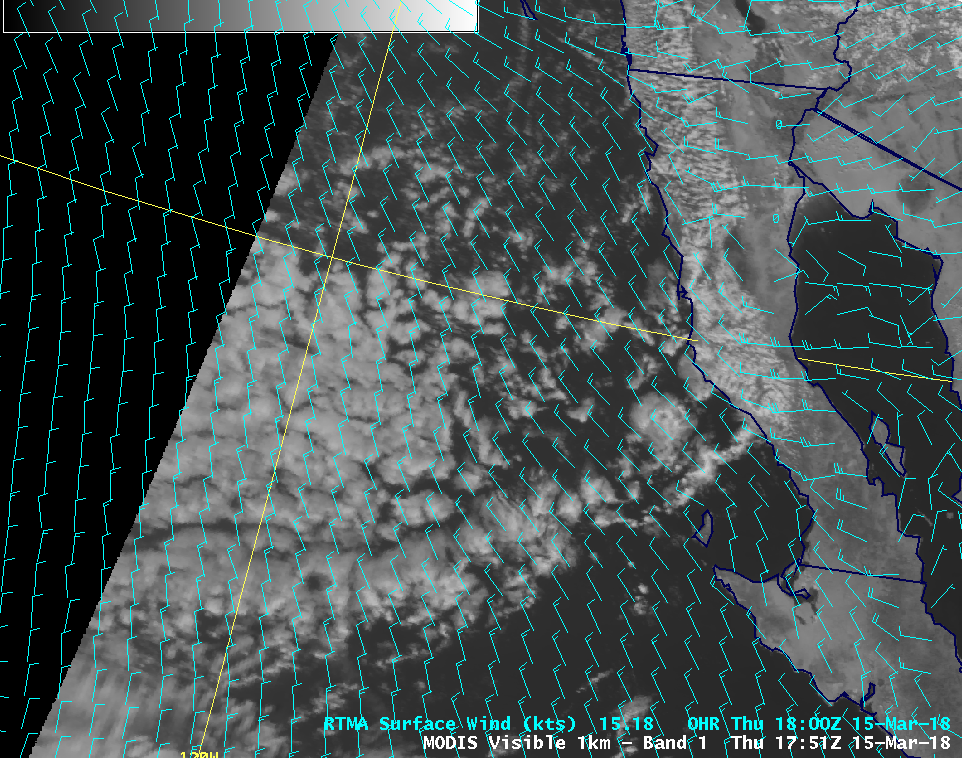
A similar animation of GOES-16 “Red” Visible (0.64 µm), Mid-level Water Vapor (6.9 µm) and Upper-level Water Vapor (6.2 µm) images (below) did show some smaller-scale waves on Visible imagery within the marine boundary layer stratocumulus cloud field, but they did not appear to exhibit a direct correlation with the higher-altitude waves seen in the Water Vapor imagery. Surface winds were from the northwest at 10-15 knots, as a dissipating cold front was stalled over the region.
GOES-16 “Red” Visible (0.64 µm, left), Mid-level Water Vapor (6.9 µm, center) and Upper-level Water Vapor (6.2 µm, right) images [click to play animation]
A larger-scale view of Mid-level Water Vapor (6.9 µm) images
(below) showed that these waves were located to the north of a jet streak axis — denoted by the sharp dry-to-moist gradient
(yellow to blue enhancement) stretching from southwest to northeast as it moved over Baja California.
![GOES-16 Mid-level (6.9 µm) Water Vapor images [click to play animation]](https://cimss.ssec.wisc.edu/satellite-blog/wp-content/uploads/sites/5/2018/03/G16_WV9_FD_GUADALUPE_ISLAND_12MAR2018_960x1280_B9_2018074_170043_0001PANEL_00021.GIF)
GOES-16 Mid-level (6.9 µm) Water Vapor images [click to play animation]
GOES-15
(GOES-West) Water Vapor (6.5 µm) images with overlays of
upper-tropospheric atmospheric motion vectors and contours of
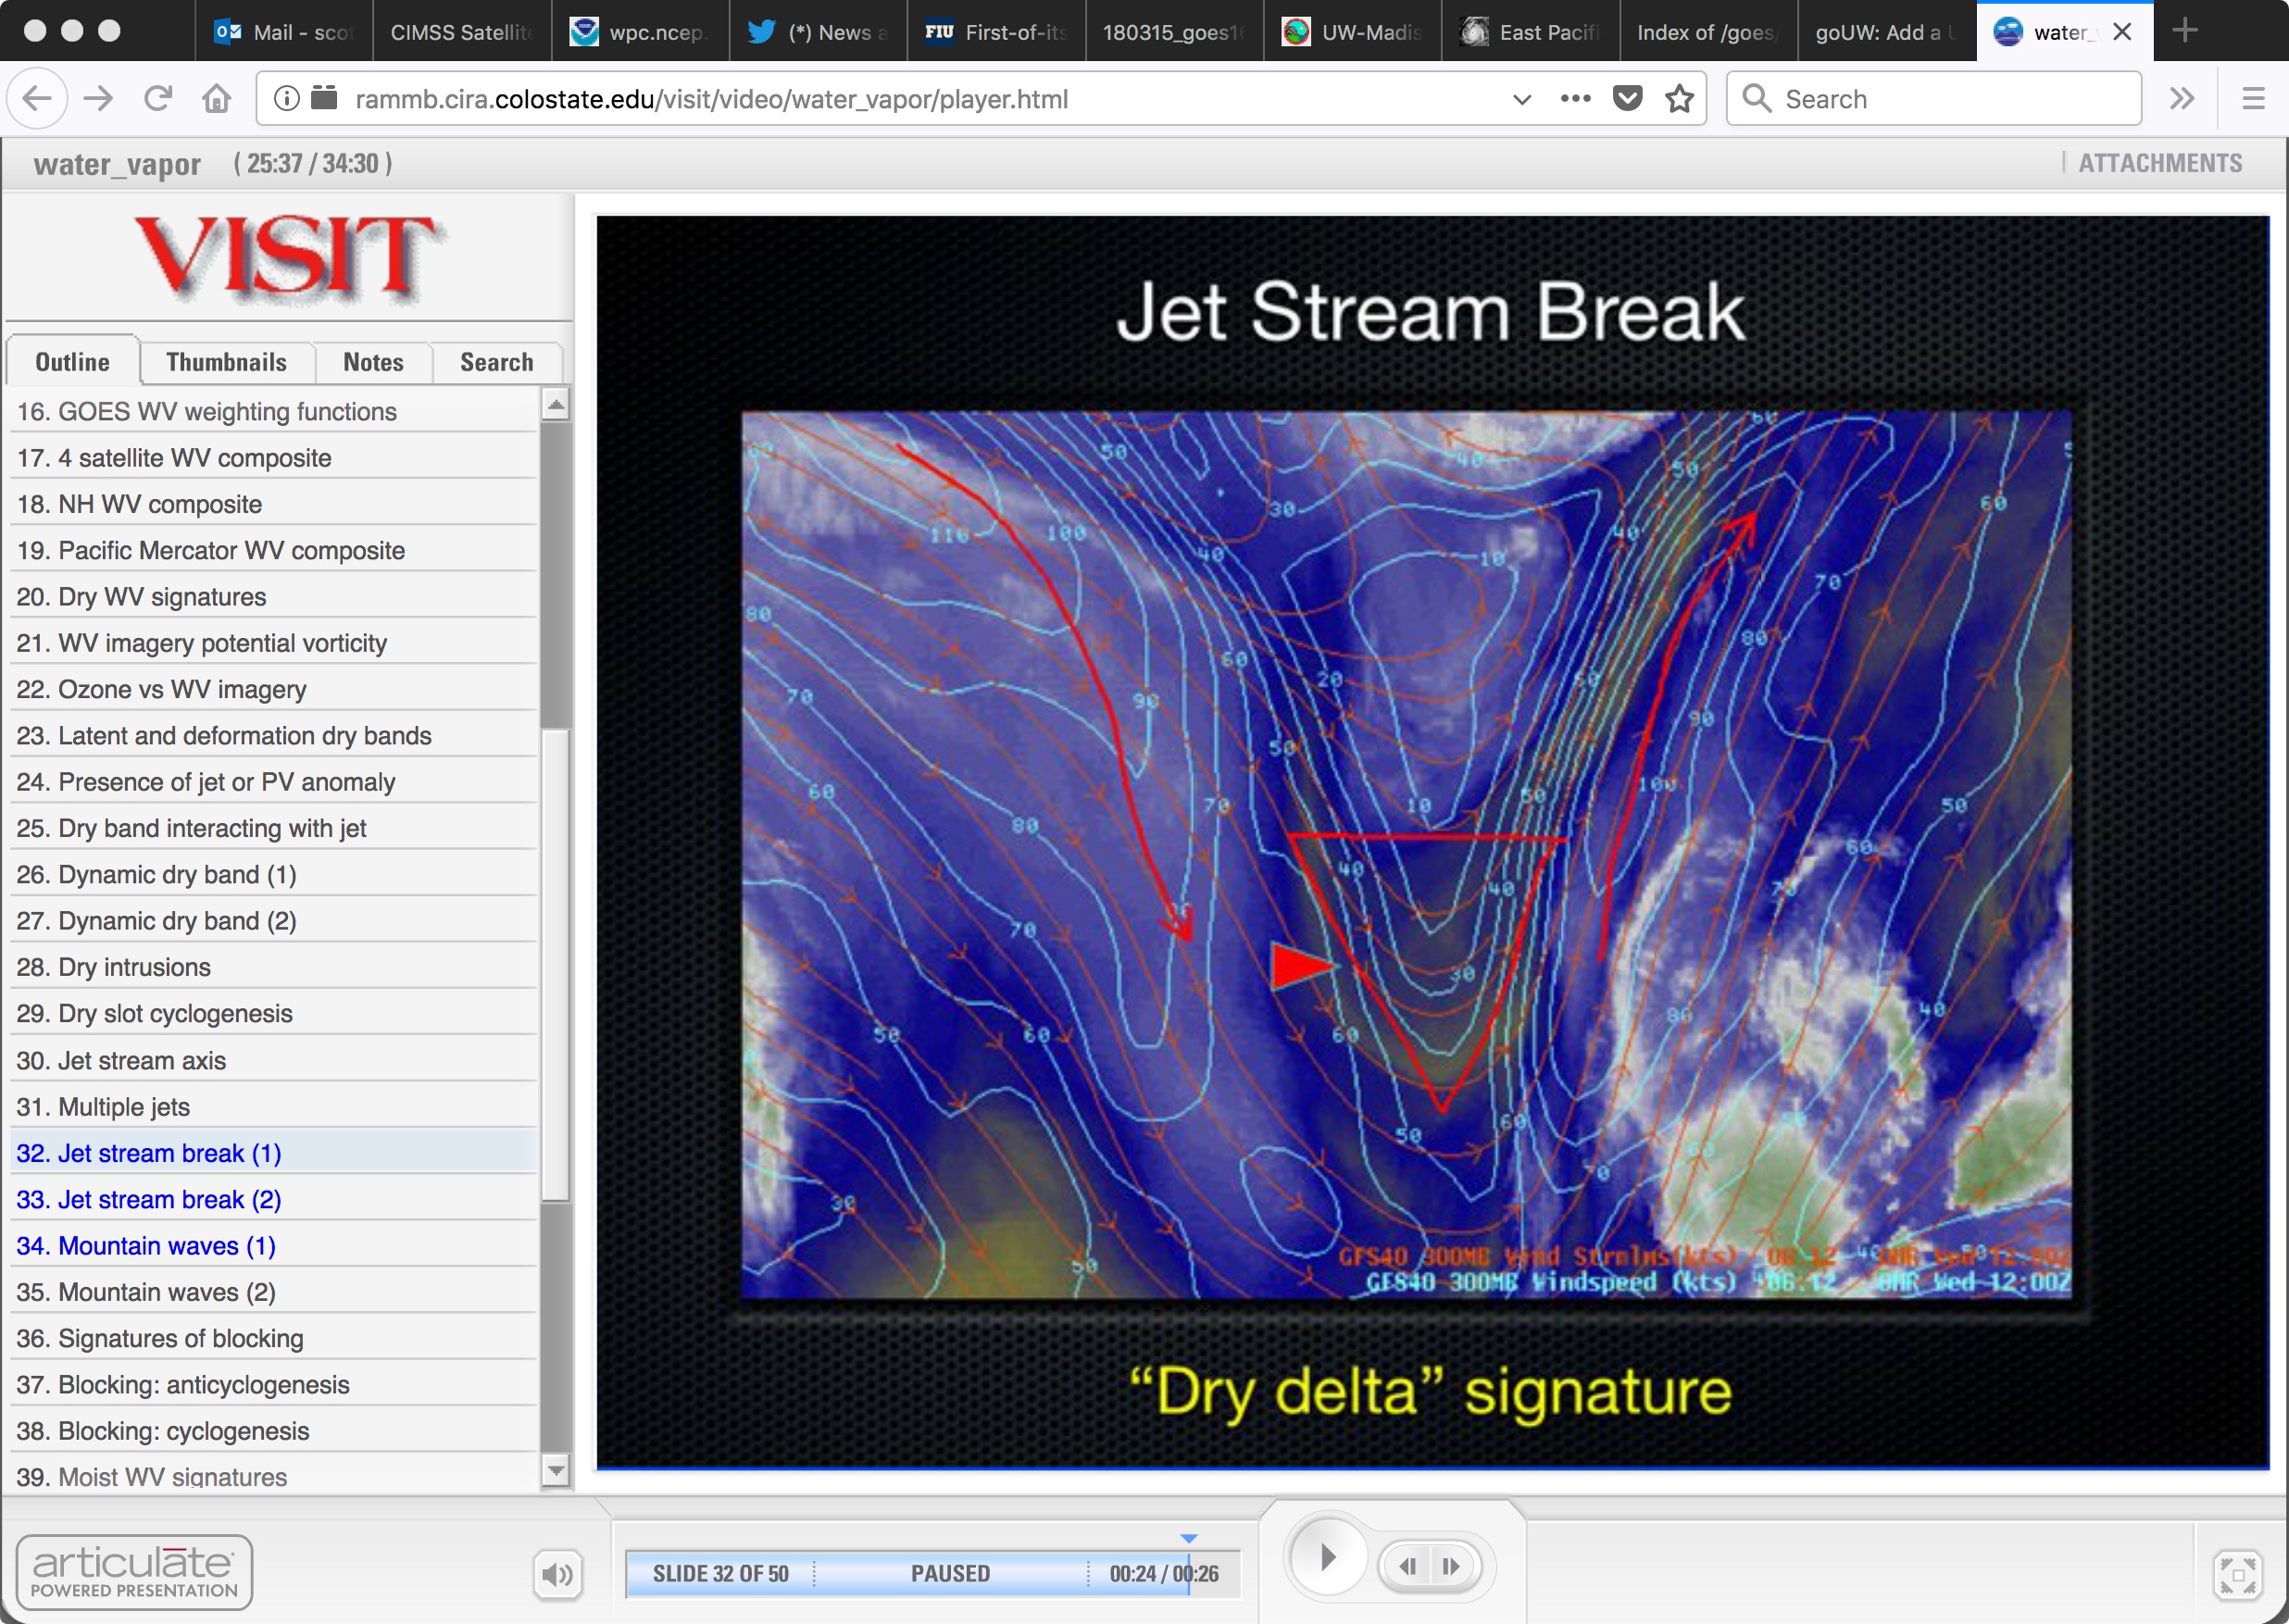
upper-tropospheric divergence (below) indicated that Guadalupe Island was located within the “dry delta” signature often associated with a
jet stream break — the inflection point between 2 strong jet streaks within a sharply-curved jet stream. Upper-tropospheric winds were from the west/northwest, with upper-tropospheric convergence seen over the region of the gravity waves.
![GOES-15 Water Vapor (6.5 µm) images, with water vapor wind vectors [click to enlarge]](https://cimss.ssec.wisc.edu/satellite-blog/wp-content/uploads/sites/5/2018/03/180315_goes15_water_vapor_winds_anim.gif)
GOES-15 Water Vapor (6.5 µm) images, with atmospheric motion vectors [click to enlarge]
![GOES-15 Water Vapor (6.5 µm) images, with contours of upper-tropospheric convergence [click to enlarge]](https://cimss.ssec.wisc.edu/satellite-blog/wp-content/uploads/sites/5/2018/03/180315_goes15_water_vapor_divergence_anim.gif)
GOES-15 Water Vapor (6.5 µm) images, with contours of upper-tropospheric convergence [click to enlarge]
An early morning Aqua MODIS Water Vapor (6.7 µm) image with NAM80 contours of 250 hPa wind speed
(below) showed the two 90-knot jet streaks on either side of the jet stream break — it could be that speed convergence due to rapidly decelerating air within the exit region of the western jet streak was a possible forcing mechanism of the gravity waves seen on the GOES-16 Water Vapor imagery.
![Aqua MODIS Water Vapor (6.7 µm) image, with NAM80 contours of 250 hPa wind speed [click to enlarge]](https://cimss.ssec.wisc.edu/satellite-blog/wp-content/uploads/sites/5/2018/03/NAM80_250MB_Windspeed_20180315_1200F000.png)
Aqua MODIS Water Vapor (6.7 µm) image, with NAM80 contours of 250 hPa wind speed [click to enlarge]
View only this post
Read Less
![GOES-16 Low-level (7.3 µm, left), Mid-level (6.9 µm, center) and Upper-level (6.2 µm, right) Water Vapor images [click to play animation]](https://cimss.ssec.wisc.edu/satellite-blog/wp-content/uploads/sites/5/2018/03/180315_goes16_water_vapor_Guadalupe_Island_waves_anim.gif)

![GOES-16 Mid-level (6.9 µm) Water Vapor images [click to play animation]](https://cimss.ssec.wisc.edu/satellite-blog/wp-content/uploads/sites/5/2018/03/180315_goes16_fd_water_vapor_Guadalupe_Island_waves_anim.gif)


![GOES-16 Mid-level (6.9 µm) Water Vapor images, with plots of hourly surface weather symbols [click to play MP4 animation]](https://cimss.ssec.wisc.edu/satellite-blog/wp-content/uploads/sites/5/2018/03/G16_WV9_EASTERN_US_12MAR2018_960x1280_B9_2018071_180222_0001PANEL_00217.GIF)
