The map above shows a band of heavy snow that fell across southern Minnesota (as much as 11.0 inches), northern Iowa (as much as 12.0 inches) and southern Wisconsin (as much as 9.4 inches) on 18 April 2018.Animations of 1-minute Mesoscale Sector GOES-16 (GOES-East) “Red” Visible (0.64 µm), “Clean” Infrared Window (10.3 µm) and “Low-level” Water Vapor (7.3 µm)... Read More
![24-hour snowfall ending at 12 UTC on 19 April [click to enlarge]](https://cimss.ssec.wisc.edu/satellite-blog/wp-content/uploads/sites/5/2018/04/180419_snowfall.png)
24-hour snowfall ending at 12 UTC on 19 April [click to enlarge]
The map above shows a band of heavy snow that fell across southern Minnesota
(as much as 11.0 inches), northern Iowa
(as much as 12.0 inches) and southern Wisconsin
(as much as 9.4 inches) on
18 April 2018.
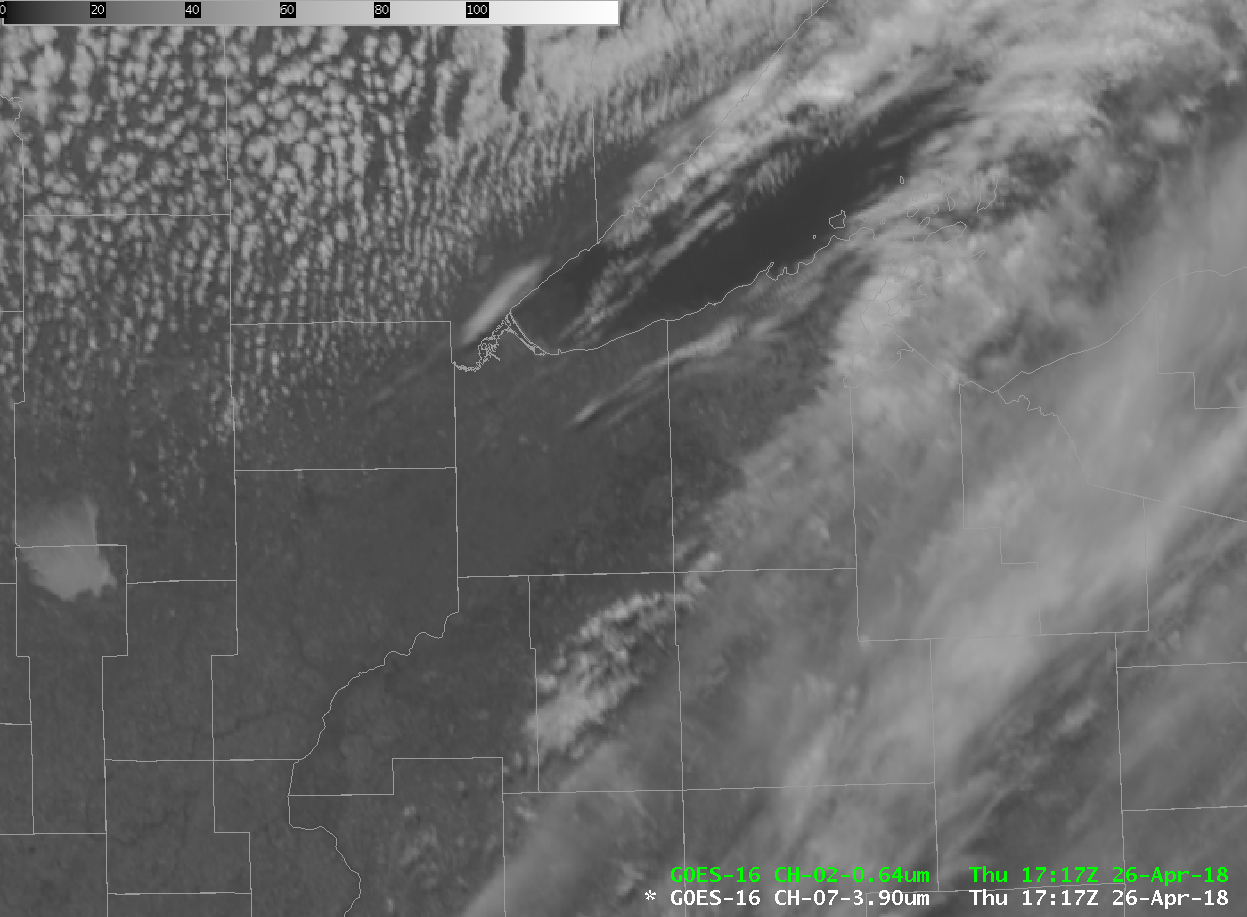
Animations of 1-minute Mesoscale Sector GOES-16 (GOES-East) “Red” Visible (0.64 µm), “Clean” Infrared Window (10.3 µm) and “Low-level” Water Vapor (7.3 µm) images (below) showed the formation of convective elements and banding along the southern edge of the colder cloud shield — snowfall rates were enhanced when these convective features moved overhead, and thundersnow was noted at some locations in northern Iowa and southern Wisconsin.
GOES-16 “Red” Visible (0.64 µm) images, with hourly surface weather type plotted in cyan [click to play MP4 animation]
GOES-16 “Clean” Infrared Window (10.3 µm) images, with hourly surface weather type plotted in yellow [click to play MP4 animation]
GOES-16 “Low=level” Water Vapor (7.3 µm) images, with hourly surface weather type plotted in cyan [click to play MP4 animation]
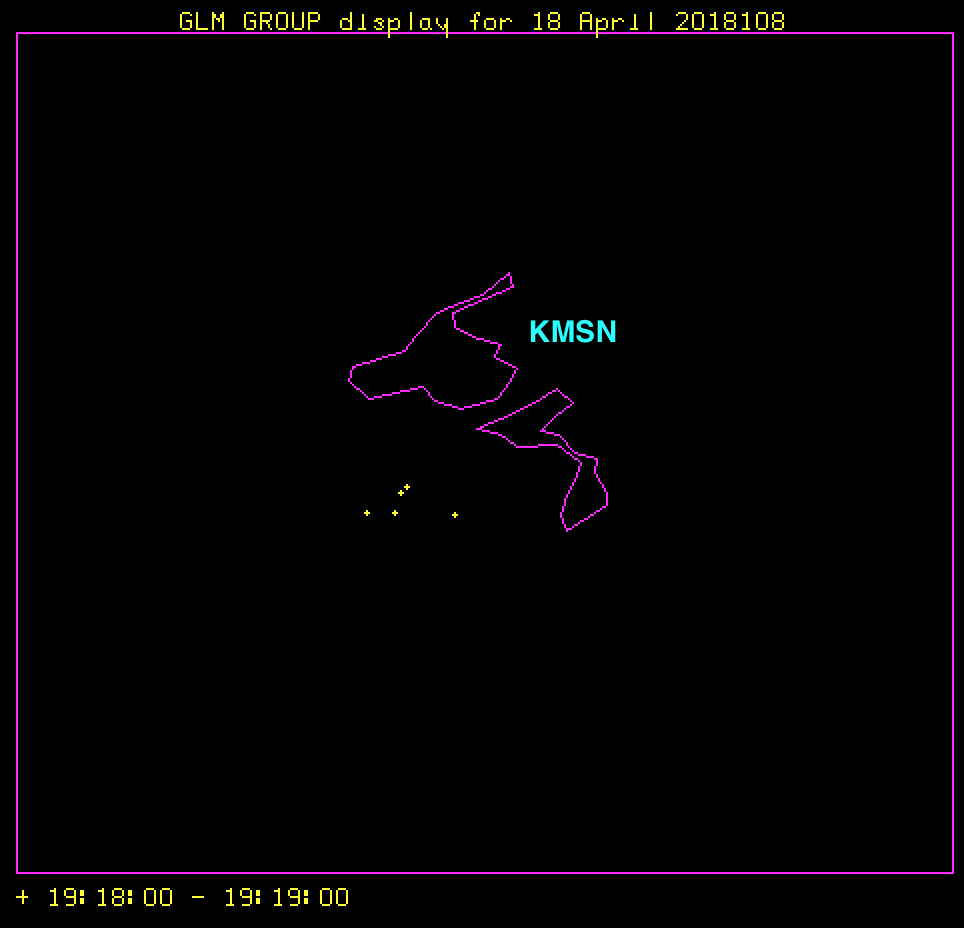
In south-central Wisconsin, Madison (KMSN) received 7.2 inches of snowfall, which set a new
record for daily snowfall (and helped to make April the snowiest month of the 2017/2018 winter seeason). In addition, the daily maximum temperature was only 33 ºF, which was a
record low maximum for the date. Over the southwestern part of the city, a cluster of GOES-16 Geostationary Lightning Mapper (
GLM) Groups was detected from 1918 to 1919 UTC
(below; courtesy of Dave Santek, SSEC) — the GOES-16
Visible image at that time did display a textured cloud top appearance characteristic of embedded convection across southern Wisconsin.
![GOES-16 GLM Groups [click to enlarge]](https://cimss.ssec.wisc.edu/satellite-blog/wp-content/uploads/sites/5/2018/04/180418_1919utc_goes16_glm_group_KMSN_thundersnow.png)
GOES-16 GLM Groups [click to enlarge]
===== 20 April Update =====
![GOES-16 true-color (daytime) and Infrared Window (10.3 µm, nighttime) images [click to play MP4 animation]](https://cimss.ssec.wisc.edu/satellite-blog/wp-content/uploads/sites/5/2018/04/180419_g16_snowmelt.jpeg)
GOES-16 natural-color RGB (daytime) and Infrared Window (10.3 µm, nighttime) images [click to play MP4 animation]
A fast animation of GOES-16 natural-color Red-Green-Blue (RGB) images
(above) revealed the rapid rate of snow melt — especially on 19 April — along the southern edge of the snow cover (where lighter amounts of snow fell). The effect of the high late-April sun angle also played a role in the rapid snow melt.
View only this post
Read Less
![GOES-16 Natural Color images [click to animate]](https://cimss.ssec.wisc.edu/satellite-blog/wp-content/uploads/sites/5/2018/04/900x900_AGOES16_B1_SHCS_V2_OIL_2018116_175719.GIF)
![Aqua MODIS True Color and False Color RGB images [click to enlarge]](https://cimss.ssec.wisc.edu/satellite-blog/wp-content/uploads/sites/5/2018/04/180426_1842utc_aqua_modis_truecolor_falsecolor_WI_refinery_explosion_anim.gif)
![GOES-16 Low-level (7.3 µm, left), Mid-level (6.9 µm, center) and Upper-level (6.2 µm, right) Water Vapor images [click to play animation | MP4]](https://cimss.ssec.wisc.edu/satellite-blog/wp-content/uploads/sites/5/2018/04/180423_goes16_water_vapor_SoCal_contrails_anim.gif)
![GOES-16 Water Vapor weighting functions, calculated using rawinsonde data from San Diego CA [click to enlarge]](https://cimss.ssec.wisc.edu/satellite-blog/wp-content/uploads/sites/5/2018/04/180424_00utc_knkx_wv_wf.jpeg)
