This website works best with a newer web browser such as Chrome, Firefox, Safari or Microsoft
Edge. Internet Explorer is not supported by this website.
1-minute Mesoscale Domain Sector GOES-19 (GOES-East) Visible and Infrared images (above) showed Hurricane Imelda as it intensified from a Category 1 to a Category 2 storm (at 1800 UTC) while approaching Bermuda on 01 October 2025. GLM Flash Points revealed very little satellite-detected lightning activity within the eyewall of Imelda.About an hour prior... Read More
1-minute GOES-19 Visible and Infrared images with plots of 1-minute GOES-19 GLM Flash Points, from 1200-2100 UTC on 01 October; hourly METAR surface reports from Bermuda are plotted in cyan [click to play MP4 animation]
1-minute Mesoscale Domain Sector GOES-19 (GOES-East) Visible and Infrared images (above) showed Hurricane Imelda as it intensified from a Category 1 to a Category 2 storm (at 1800 UTC) while approaching Bermuda on 01 October 2025. GLM Flash Points revealed very little satellite-detected lightning activity within the eyewall of Imelda.
About an hour prior to the beginning of the GOES-19 Visible/Infrared image animation above, a DMSP-17 SSMIS Microwave image at 1057 UTC (below) depicted the eye and eyewall of Imelda.
DMSP-17 SSMIS Microwave image at 1057 UTC on 01 October
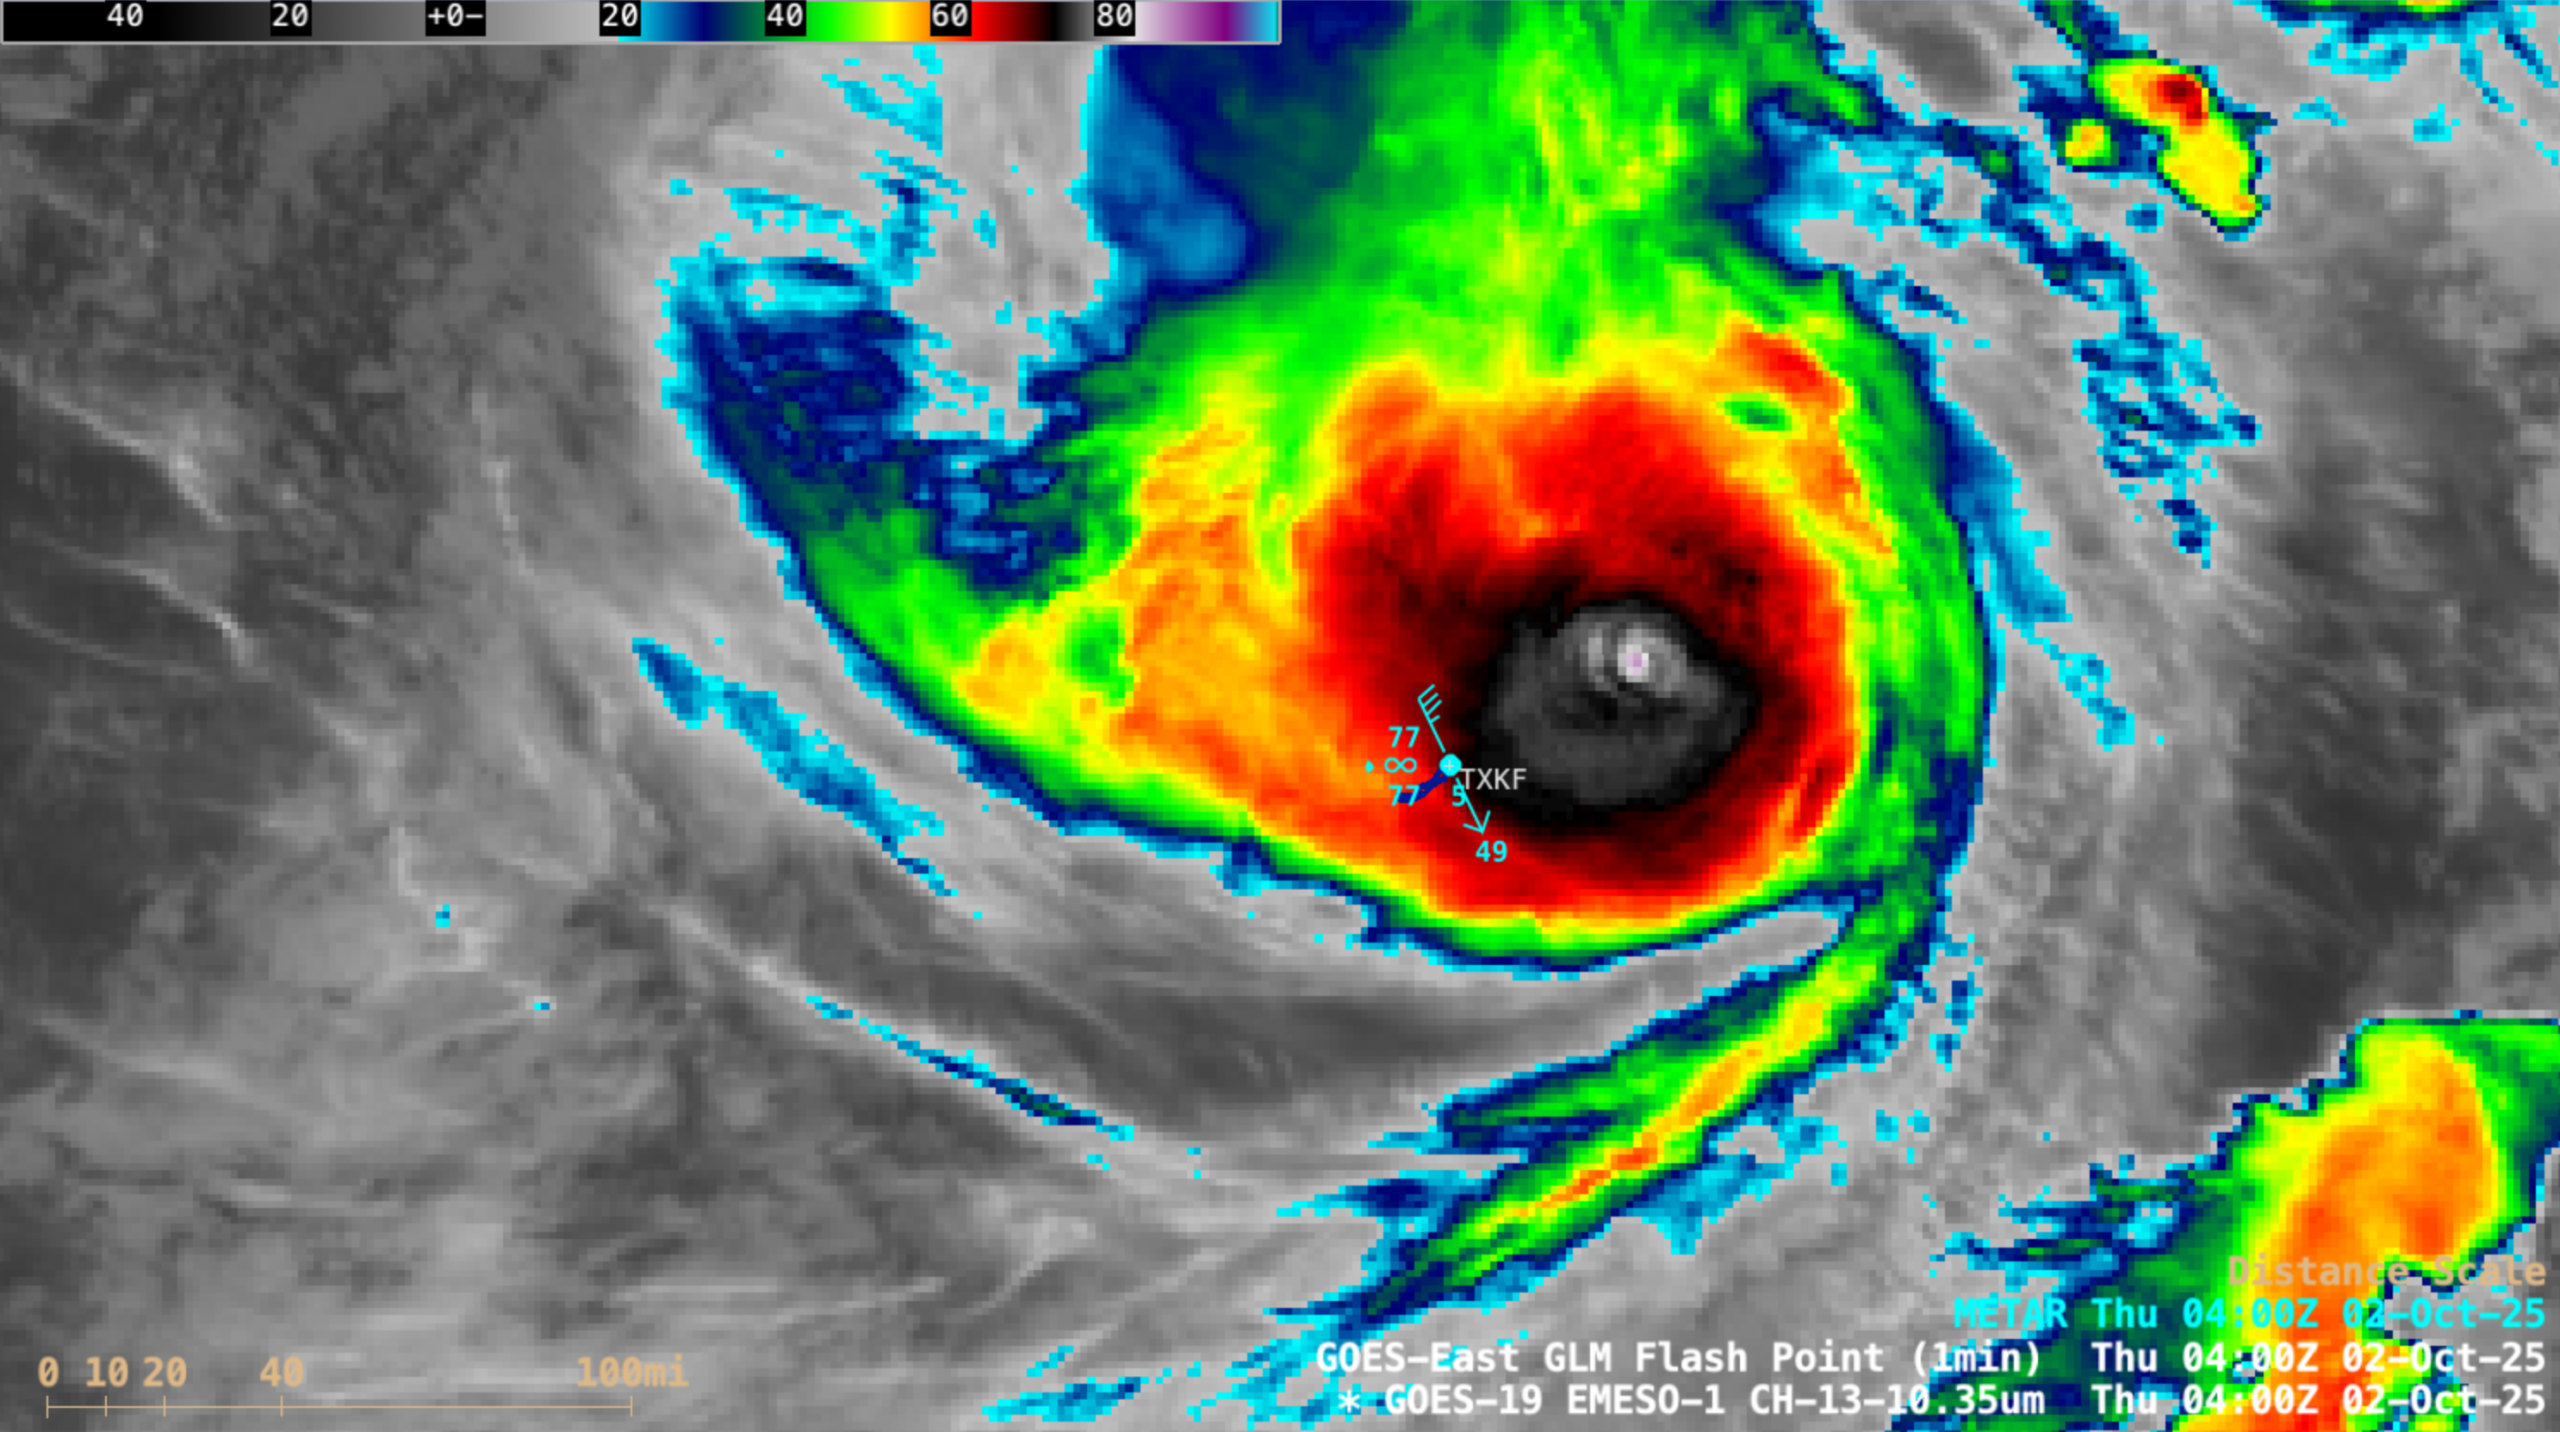
After sunset, 1-minute GOES-19 Infrared images (below) showed Imelda as it moved across the island of Bermuda. The strongest wind gust at Bermuda/Wade International Airport (TXKF) was on the back side of Imelda, with 49 kts occurring at 0400 UTC. Soon after the core of Imelda passed over Bermuda, a series of convective bursts exhibited cloud-top infrared brightness temperatures as cold as -87ºC. Interestingly, brief clusters of GLM Flash Points were associated with some of these convective bursts northeast of Bermuda — until that point, there was a general void of lighting activity with Imelda after sunset.
1-minute GOES-19 Infrared images, from 2200 UTC on 01 October to 0500 UTC on 02 October [click to play MP4 animation]
According to a plot of rawinsonde data from Bermuda International Airport (below), the coldest cloud-top infrared brightness temperature of -87ºC corresponded to an overshoot of the Most Unstable (MU) air parcel’s Equilibrium Level (EL) of at least 1 km.
Plot of rawinsonde data from Bermuda International Airport at 0000 UTC on 02 October [click to enlarge]
Category 2 Imelda moved across a patch of warmer Sea Surface Temperature and higher Ocean Heat Content as it approached Bermuda (below) — that warmer water could have played a role in fueling the development of the aforementioned convective bursts (with lighting activity) seen in GOES-19 Infrared imagery.
Sea Surface Temperature and Ocean Heat Content along the track of Hurricane Imelda
1-minute Mesoscale Domain Sector GOES-19 (GOES-East) Visible images (above) showed Hurricane Humberto as it intensified from a Category 4 to a Category 5 storm on 27 September 2025 (Humberto became the second Category 5 storm in the Atlantic Basin this season — with Erin being the first). Low-altitude mesovortices were evident within... Read More
1-minute GOES-19 Visible images, from 1410-2121 UTC on 27 September [click to play animated GIF]
1-minute Mesoscale Domain Sector GOES-19 (GOES-East) Visible images (above) showed Hurricane Humberto as it intensified from a Category 4 to a Category 5 storm on 27 September 2025 (Humberto became the second Category 5 storm in the Atlantic Basin this season — with Erin being the first). Low-altitude mesovortices were evident within the eye, along with cloud-top gravity waves in the surrounding eyewall region.
In an animation of 1-minute GOES-19 Infrared images (below), the eye began to exhibit a slight amount of trochoidal motion as Humberto intensified later in the day.
1-minute GOES-19 Infrared images, from 1410-2300 UTC on 27 September [click to play animated GIF]
A DMSP-18 SSMIS Microwave image at 2013 UTC — shortly before Humberto was upgraded to Category 5 at 2100 UTC (below) displayed a fully-closed inner eyewall.
DMSP-18 SSMIS Microwave image at 2013 UTC on 27 September
Humberto’s intensification to Category 5 occurred as the hurricane was moving through an environment of weak deep-layer wind shear(below) and traversing warm water.
GOES-19 Infrared images with an overlay of contours and streamlines of deep-layer wind shear at 2300 UTC on 27 September
Microwave, wind shear and sea surface temperature imagery was sourced from the CIMSS Tropical Cyclones site.
A RCM-2 Synthetic Aperture Radar (SAR) image (source) at 2214 UTC (below) sensed wind speeds as high as 126.94 kt in the NW quadrant of Humberto.
RCM-2 SAR wind speed image at 2214 UTC on 27 September [click to enlarge]
10-minute Full Disk scan GOES-18 (GOES-West) daytime True Color RGB + nighttime Dust RGB images created using Geo2Grid (above) showed a plume of resuspended volcanic ash (hazy shades of tan in True Color RGB, and shades of violet in Dust RGB) from the 1912 Novarupta-Katmai eruption in Alaska — which was being... Read More
GOES-18 daytime True Color RGB + nighttime Dust RGB images, from 1650 UTC on 22 September to 1000 UTC on 23 September [click to play animated GIF | MP4]
10-minute Full Disk scan GOES-18 (GOES-West) daytime True Color RGB + nighttime Dust RGB images created using Geo2Grid(above) showed a plume of resuspended volcanic ash (hazy shades of tan in True Color RGB, and shades of violet in Dust RGB) from the 1912 Novarupta-Katmai eruption in Alaska — which was being transported offshore across the Shelikof Strait and over parts of Kodiak Island during 22-23 September 2025. Surface volcanic ash within the Valley Of Ten Thousand Smokes was being lofted by strong northwesterly winds that were being channeled through the valley.
According to this USGS Volcano Notice, the National Weather Service issued a SIGMET advising aviation interests that the maximum height of this resuspended ash was 6000 ft.
This blog author loves posting about the seasons! They provide the opportunity to post some awesome full disk GOES images, but there’s more than that. The passing of the seasons has always been marked by humans, sometimes because of agricultural significance, spiritual significance, community bonding, or simply to mark time.... Read More
This blog author loves posting about the seasons! They provide the opportunity to post some awesome full disk GOES images, but there’s more than that. The passing of the seasons has always been marked by humans, sometimes because of agricultural significance, spiritual significance, community bonding, or simply to mark time. The fall (or autumnal) equinox marks the time when the sun is directly above the equator, as we transition seasons from summer to fall in the northern hemisphere (and it’s going from spring to summer in the southern hemisphere). This year the fall equinox is September 22, 2025. It can be seen in GOES visible band imagery at satellite sunrise or sunset where the terminator (the dividing line between night and day) is aligned perfectly north & south in the middle of a full disk visible band image. For the people in the northern hemisphere, the autumnal equinox marks the end of summer and the beginning of autumn, which lasts until the winter solstice (around December 21 or 22). This is the astronomical definition of the changing of seasons as the tilt of the earth on its axis will lead to summer in the southern hemisphere as we head into winter up here in the northern hemisphere.
GOES-19 (GOES-East) CIMSS Natural Color image at satellite sunrise (11:00 UTC) showing the N/S aligned terminator on the fall equinox. Hurricane Gabrielle is apparent just east of the terminator. The hurricane is expected to intensify to a Category 4 as it turns away from the United States.
Sunset and sunrise time-lapse animations from space (below) show the progression of the terminator from spring equinox, through summer solstice, to fall equinox from the satellite’s point of view. For these times of day the disk is “half” illuminated so the terminator formed by the shadow of the night-side of earth is easy to track. GOES-East sits over the equator above 75 West (which is in Columbia, near where the borders of Peru, Ecuador, and Columbia meet) and GOES-West sits over the equator above 137 West (which is out in the Pacific Ocean away from any major land masses – maybe the closest thing is French Polynesia, 680 miles to the southwest; and for reference, Hawaii is over 1700 miles to the northwest of the GOES-West subpoint). These two views provide coverage of nearly two thirds of the earth and so in addition to the terminator you can see some of the things that affected life across our hemisphere from major storm systems to smoke and dust. Technically sunrise, sunset, and local noon vary from day to day, but these animations use a consistent time every day that is close to sunrise, sunset, or noon.
GOES-19 ABI animation of satellite sunrise (11:00 UTC) daily from spring equinox (Mar 20, 2025) to fall equinox (Sep 22, 2025). These are composite images using the “CIMSS Natural Color” enhancement. (Click to animate)
In this GOES-19 (GOES-East) animation in addition to seeing the terminator progress from equinox to summer solstice and back to equinox, there are multiple tropical storms visible, including Hurricane Erin in mid-August and Hurricane Gabrielle in the last few frames. One can also observe dust blowing off the African continent and the reflection of the sun migrating north from the equator and then back south to the equator.
GOES-18 ABI animation of satellite sunrise (15:00 UTC) daily from spring equinox (Mar 20, 2025) to fall equinox (Sep 22, 2025). These are composite images using the “CIMSS Natural Color” enhancement. (Click to animate)
In this GOES-18 (GOES-West) animation there are also multiple tropical storms visible. There have been 8 tropical storms and 8 hurricanes this year so far in the east Pacific, some of which caused major flooding in parts of Mexico. There was also plenty of wildfire smoke mixed in with the clouds over Canada and the northern half of the US during summer 2025, affecting air quality across wide areas of both countries.
GOES-18 ABI animation of satellite noon (21:00 UTC) daily from spring equinox (Mar 20, 2025) to fall equinox (Sep 22, 2025). These are composite images using the “CIMSS Natural Color” enhancement. (Click to animate)
In this GOES-18 (GOES-West) animation of local noon the seasonal transitions may be more difficult to spot. As the northern hemisphere transitions from spring equinox, through summer, to fall equinox, the earth’s tilt puts the southern hemisphere away from the sun. This can be seen at the bottom of these images at the south pole as it gradually gets darker and darker until the solstice (June 21) and then starts to get light again. That’s winter in Antarctica and there are days where it just stays dark all day for those scientists and support staff that work down there through their winter. Some of the tropical storms and hurricanes may be easier to watch in this animation as the whole disk is as well-illuminated as it gets at satellite noon.
GOES-19 ABI animation of satellite sunset (23:00 UTC) daily from spring equinox (Mar 20, 2025) to fall equinox (Sep 22, 2025). These are composite images using the “CIMSS Natural Color” enhancement. (Click to animate)
This GOES-19 (GOES-East) animation is similar to the previous one, but now at sunset for the satellite (23:00 UTC).


