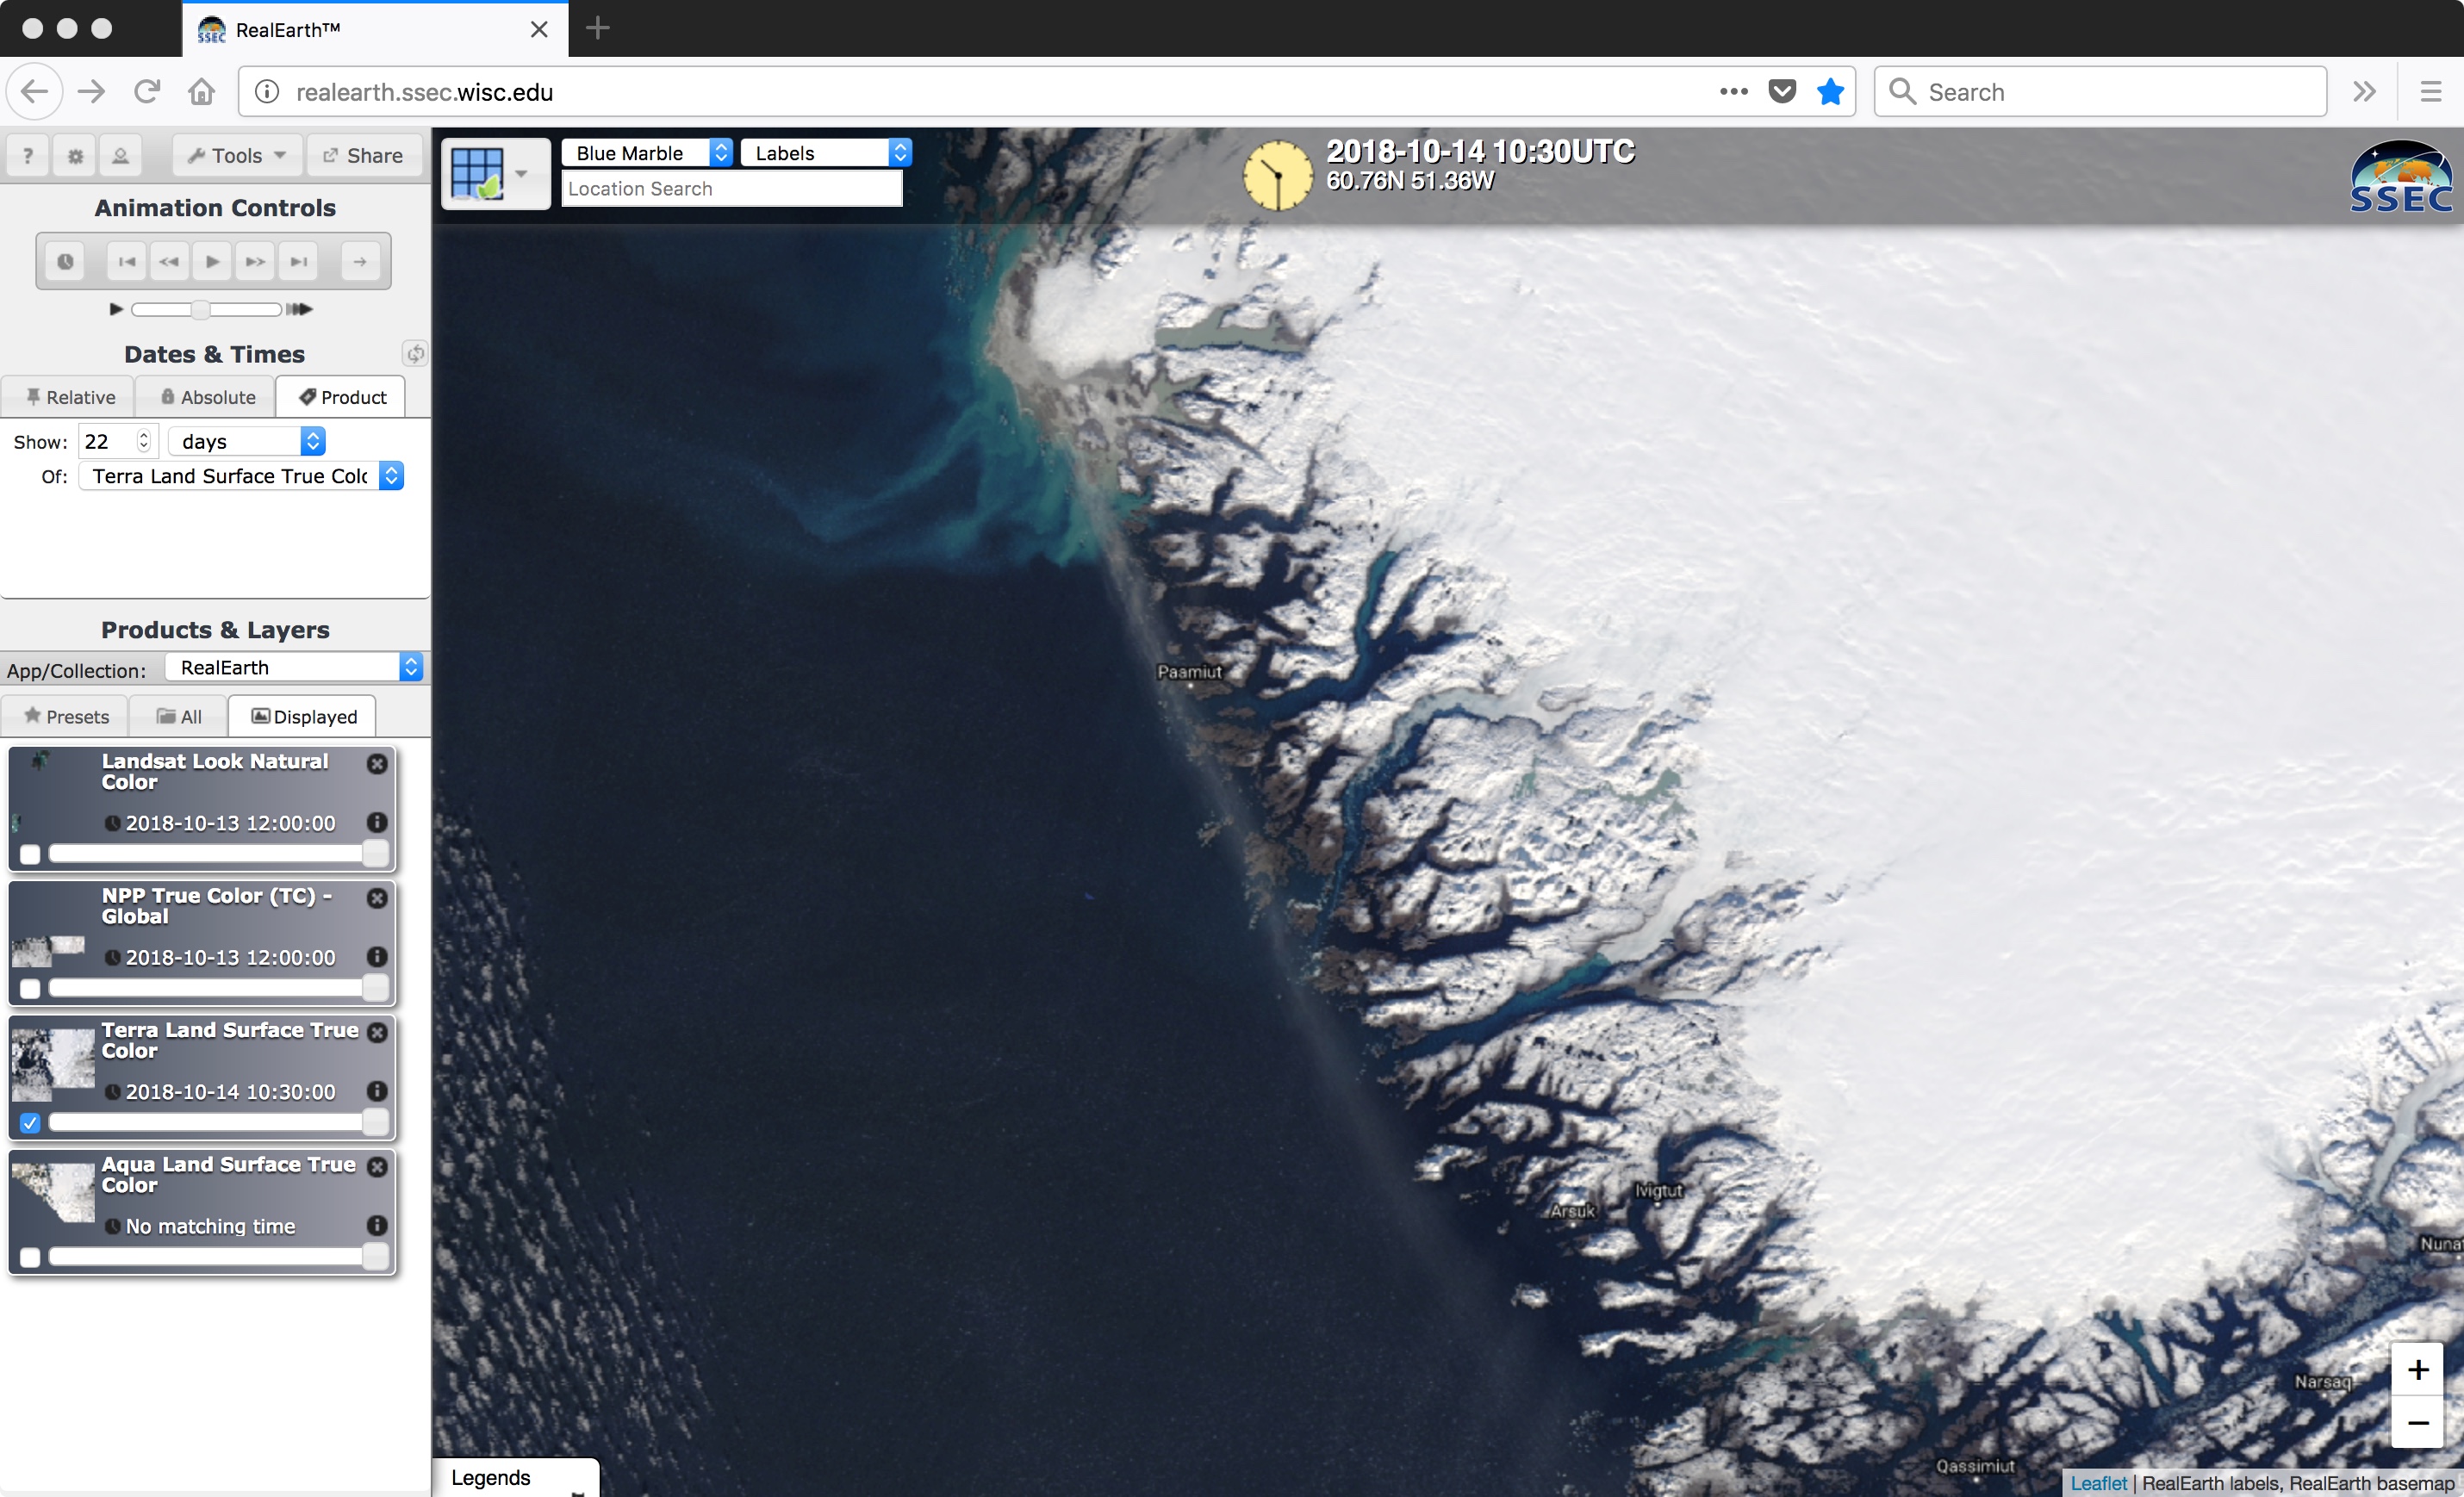
20 days after Leslie initially formed (and 17 days after it underwent extratropical transition), an Aqua MODIS True Color Red-Green-Blue (RGB) image viewed using RealEarth (above) showed the storm at 1419 UTC on 13 October 2018, when it was still classified as a Category 1 Hurricane off the coast of Portugal.... Read More
![Aqua MODIS True Color RGB image [click to enlarge]](https://cimss.ssec.wisc.edu/satellite-blog/wp-content/uploads/sites/5/2018/10/181013_1419utc_aqua_modis_truecolor_Leslie_anim.gif)
Aqua MODIS True Color RGB image, with and without surface reports [click to enlarge]
20 days after
Leslie initially formed (and 17 days after it underwent
extratropical transition), an Aqua MODIS True Color Red-Green-Blue (RGB) image viewed using
RealEarth (above) showed the storm at 1419 UTC on 13 October 2018, when it was still classified as a Category 1 Hurricane off the coast of Portugal. The southwest-to-northeast oriented cloud band just west of Leslie was associated with an advancing cold front (
surface analyses), which soon began to absorb the tropical cyclone and aid in its extra-tropical transition a few hours prior to landfall.
EUMETSAT Meteosat-11 middle/upper-tropospheric Water Vapor (6.25 µm) images (below) exhibited a warm/drying trend (brighter shades of yellow) along the western and southern edges of Leslie as it moved inland across Portugal. Hourly Meteosat-11 Water Vapor images visualized using RealEarth are available here.
![EUMETSAT Meteosat-11 Water Vapor (6.25 µm) images, with hourly plots of surface winds and gusts in knots [click to play animation | MP4]](https://cimss.ssec.wisc.edu/satellite-blog/wp-content/uploads/sites/5/2018/10/MET11_WATER_VAPOR_B5_LESLIE_LANDFALL_13OCT2018_2018286_210000_0001PANEL.GIF)
EUMETSAT Meteosat-11 Water Vapor (6.25 µm) images, with hourly plots of surface winds and gusts in knots [click to play animation | MP4]
Along the coast of Portugal a thunderstorm was reported at Porto (
LPPR) from 1930-2000 UTC (about an hour before landfall). Farther to the south, shortly after landfall the surface winds gusted to 55 knots
(63 mph or 28.3 m/s) at Monte Real Air Base (
LPMR) at 21 UTC and 42 knots
(48 mph or 21.6 m/s) at Ovar Military Base (
LPOV) at 23 UTC. The highest wind gust was 95 knots
(110 mph or 49 m/s) at Figueira da Foz, located along the coast
between LPMR and LPOV:
Meteosat-11 lower/middle-tropospheric Water Vapor (7.35 µm) images
(below) revealed the characteristic “scorpion tail” signature of a Sting Jet (
Monthly Weather Review |
Wikipedia), along with a mesoscale region of warming/drying
(darker shades of orange) driven by strong subsidence — this subsidence feature corresponded well with the report of strong winds at Figueira da Foz. Further discussion of this sting jet event is available
here.
![Meteosat-11 Water Vapor (7.35 µm) images, with hourly splots of surface winds and gusts in knots [click to play animation | MP4]](https://cimss.ssec.wisc.edu/satellite-blog/wp-content/uploads/sites/5/2018/10/MET11_WATER_VAPOR_B6_LESLIE_LANDFALL_13OCT2018_2018286_170000_0001PANEL_A.gif)
EUMETSAT Meteosat-11 Water Vapor (7.35 µm) images, with hourly plots of surface winds and gusts in knots [click to play animation | MP4]
Radar composites from the Portuguese Institute for Sea and Atmosphere (IPMA) confirmed that post-tropical cyclone Leslie made landfall around 2100 UTC (below).
![Radar reflectivity composites [click to play animation]](https://cimss.ssec.wisc.edu/satellite-blog/wp-content/uploads/sites/5/2018/10/181013_2100utc_radar_Leslie.jpg)
Radar reflectivity composites [click to play animation]
Although the view from GOES-16 (GOES-East) was very oblique, the warm/dry signature around the western and southern edges of the storm was still evident on Mid-level Water Vapor (6.9 µm) imagery (below).
![GOES-16 Mid-level Water Vapor (6.9 µm) images, with hourly plots of surface winds and gusts in knots [click to play animation | MP4]](https://cimss.ssec.wisc.edu/satellite-blog/wp-content/uploads/sites/5/2018/10/G16_WATER_VAPOR_LESLIE_LANDFALL_13OCT2018_2018286_210038_GOES-16_0001PANEL.GIF)
GOES-16 Mid-level Water Vapor (6.9 µm) images, with hourly plots of surface winds and gusts in knots [click to play animation | MP4]
The entire life cycle of Leslie — from becoming a named Subtropical Storm at 15 UTC on 23 September to making landfall as a post-tropical cyclone in Portugal at 21 UTC on 13 October — is shown with 15-minute GOES-16 “Clean” Infrared Window (10.3 µm) and Mid-level Water Vapor (6.9 µm) images (below). Note that 5-minute imagery was available on 01 October, when GOES-16 was performing a test of the Mode 4 scan strategy.
GOES-16 “Clean” Infrared Window (10.3 µm) images [click to play MP4 animation]
![GOES-16 Mid-level Water Vapor (6.9 µm) images [click to play MP4 animation]](https://cimss.ssec.wisc.edu/satellite-blog/wp-content/uploads/sites/5/2018/10/G16_WV_LESLIE_LIFECYCLE_22SEP_13OCT2018_2018266_150034_GOES-16_0001PANEL.GIF)
GOES-16 Mid-level Water Vapor (6.9 µm) images [click to play MP4 animation]
View only this post
Read Less
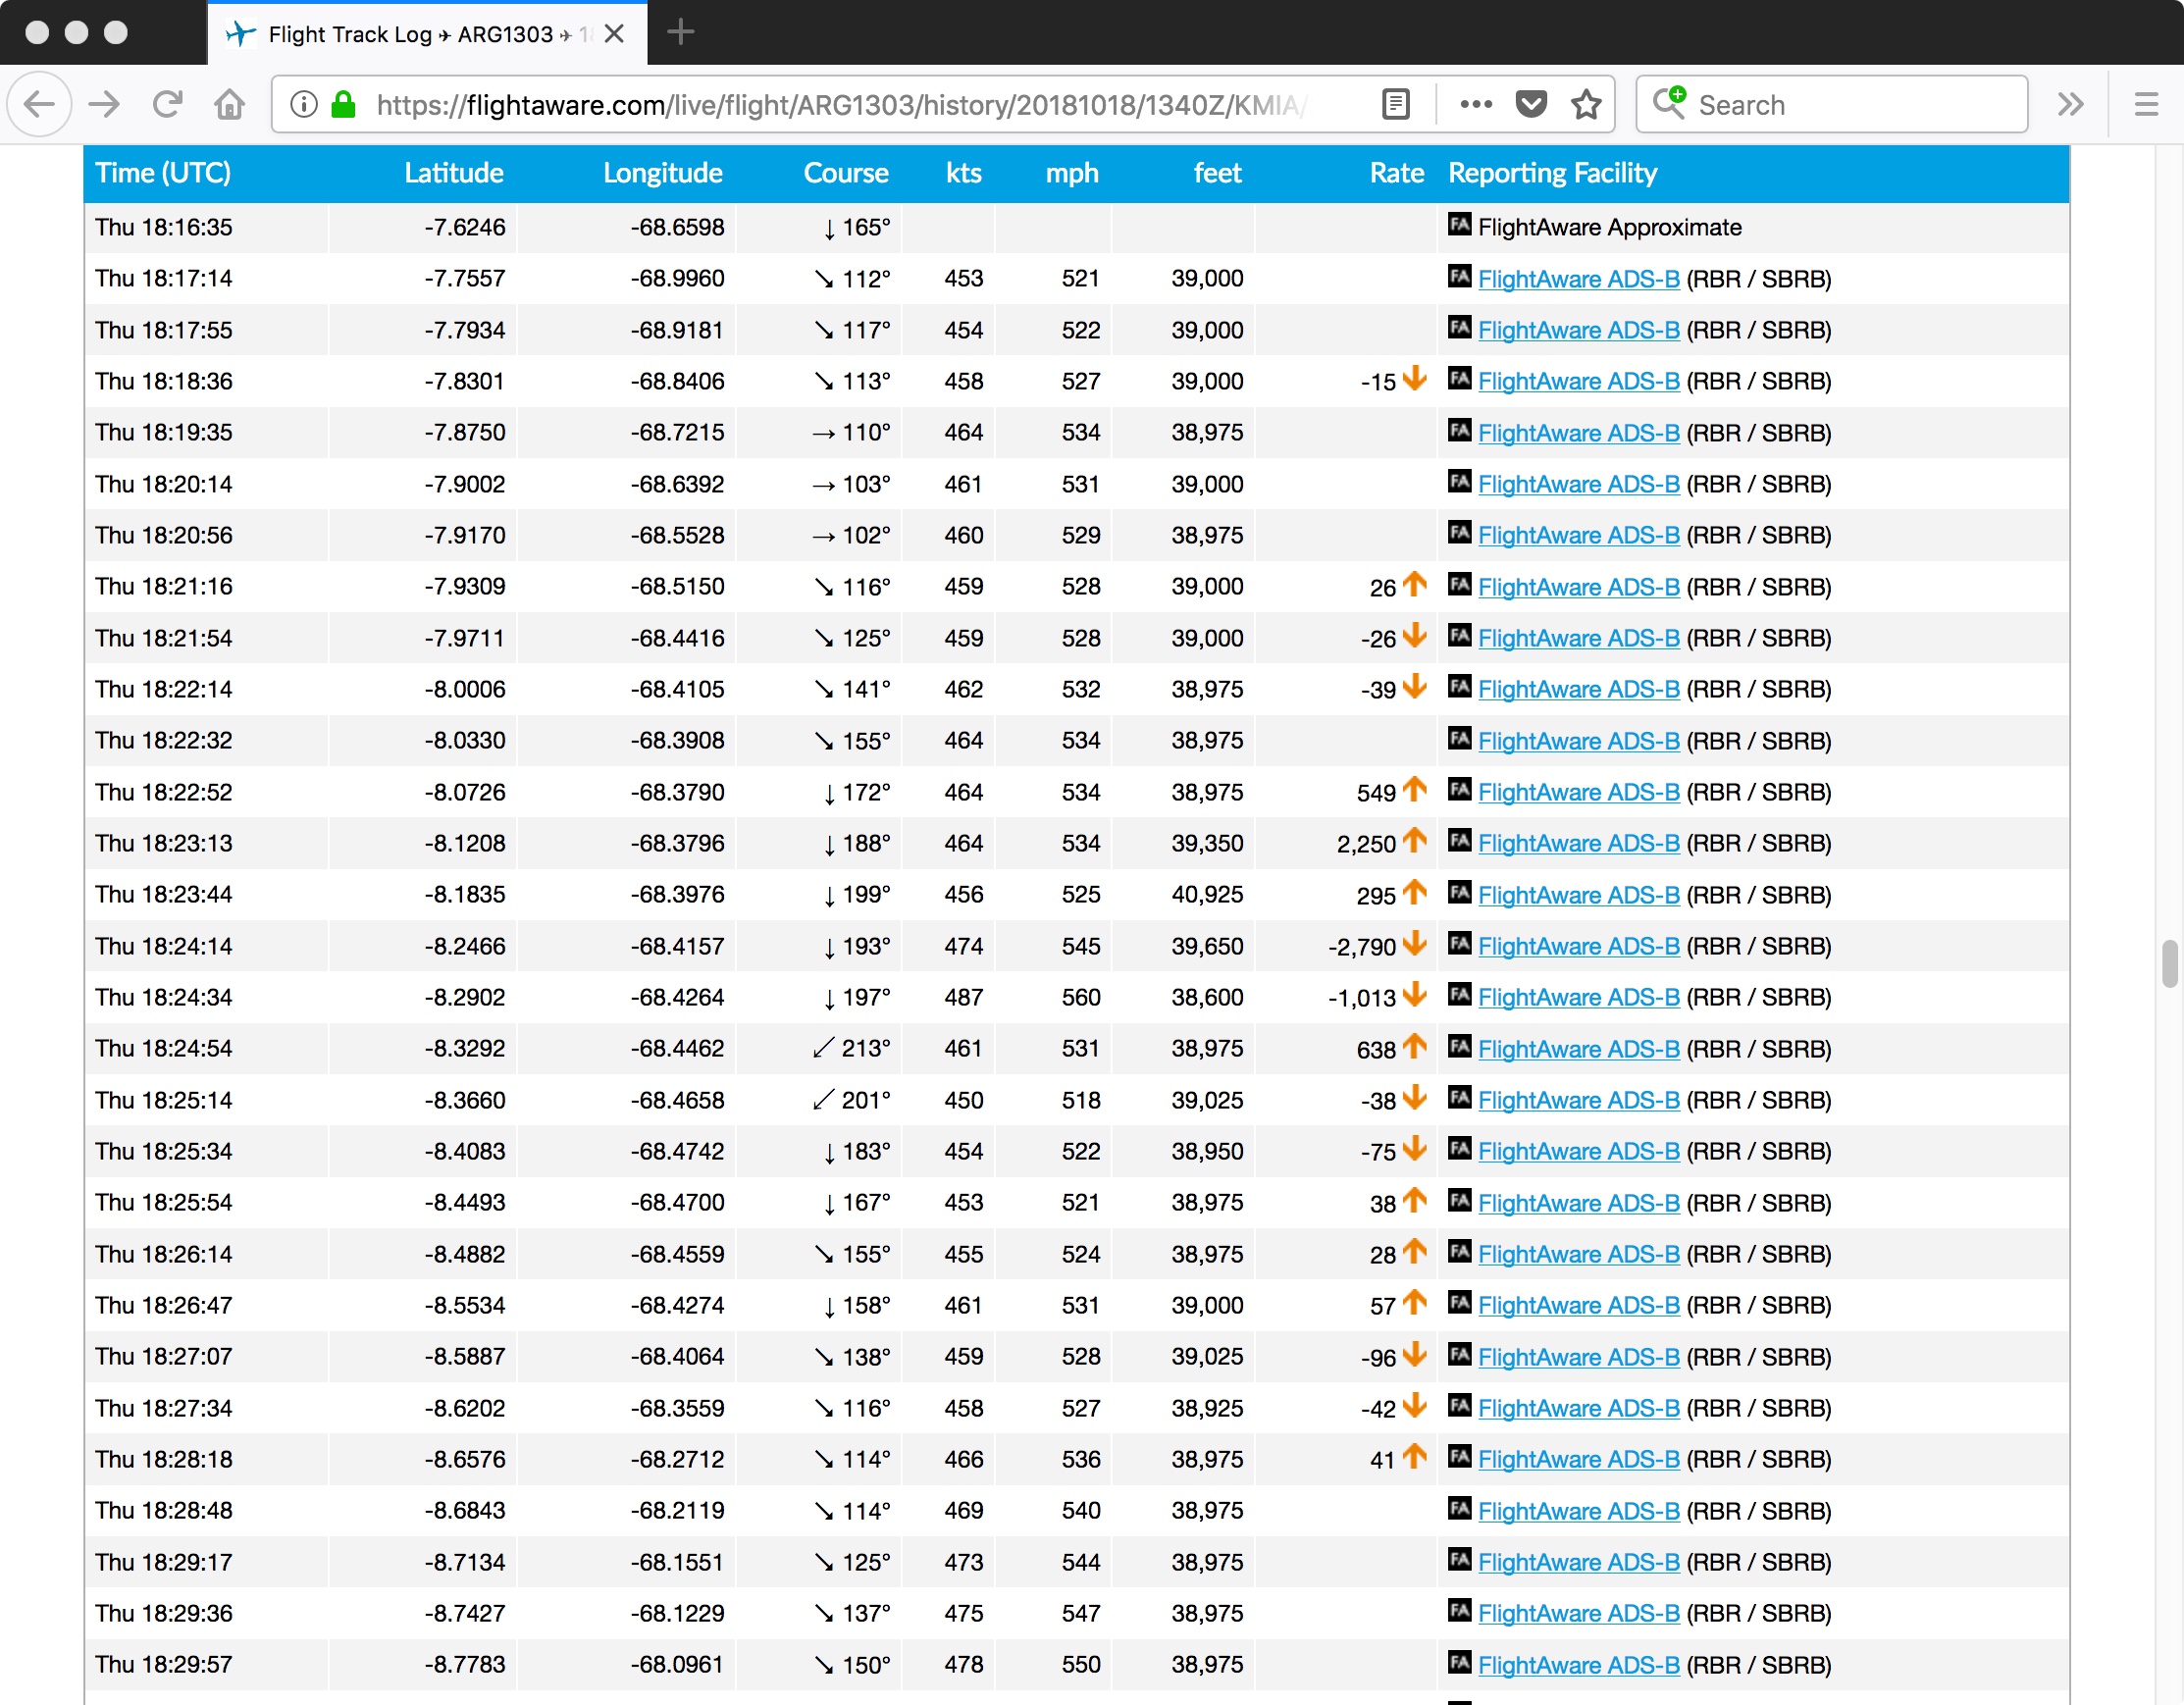
![ARG-1303 flight path (from FlightAware.com) [click to enlarge]](https://cimss.ssec.wisc.edu/satellite-blog/wp-content/uploads/sites/5/2018/10/181018_ARG1303_flight_path.jpeg)
![GOES-16 "Clean" Infrared Window (10.3 µm) images [click to play animation | MP4]](https://cimss.ssec.wisc.edu/satellite-blog/wp-content/uploads/sites/5/2018/10/181018_goes16_infrared_ARG1303_turbulence_anim.gif)
![Topography background with surface pressure analyses at 03, 06 and 09 UTC [click to enlarge]](https://cimss.ssec.wisc.edu/satellite-blog/wp-content/uploads/sites/5/2018/10/181018_topo_surface_pressure_anim.gif)
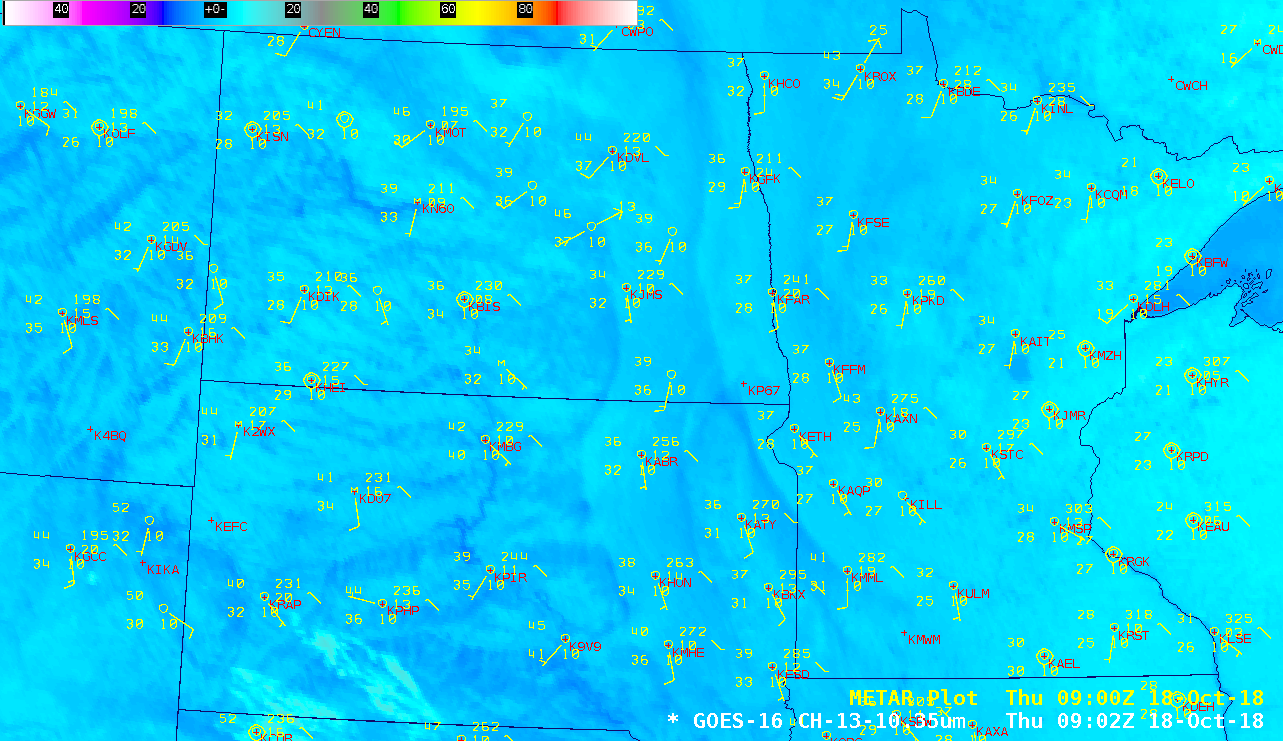
![GOES-16 Land Surface Temperature product + topography, with hourly plots of surface reports [click to play animation | MP4]](https://cimss.ssec.wisc.edu/satellite-blog/wp-content/uploads/sites/5/2018/10/181018_goes16_landSurfaceTemperature_Upper_Midwest_anim.gif)
![Infrared Window images from Terra/Aqua MODIS (11.0 µm) and NOAA-20/Suomi NPP VIIRS (11.45 µm), with topography and plots of surface reports [click to enlarge]](https://cimss.ssec.wisc.edu/satellite-blog/wp-content/uploads/sites/5/2018/10/181018_modis_viirs_infrared_topo_Upper_Midwest_anim.gif)
![Plot of 12 UTC rawinsonde data from Bismarck, North Dakota [click to enlarge]](https://cimss.ssec.wisc.edu/satellite-blog/wp-content/uploads/sites/5/2018/10/181018_12utc_kbis_raob.png)
![Plot of 12 UTC rawinsonde data from Aberdeen, South Dakota [click to enlarge]](https://cimss.ssec.wisc.edu/satellite-blog/wp-content/uploads/sites/5/2018/10/181018_12utc_kabr_raob.png)
![Terra MODIS and Suomi NPP VIIRS True Color RGB images [click to enlarge]](https://cimss.ssec.wisc.edu/satellite-blog/wp-content/uploads/sites/5/2018/10/181014_terra_modis_suomiNPP_viirs_truecolor_Greenland_dust_plume_2_anim.gif)


![GOES-17 "Red" Visible (0.64 µm) images [click to play animation | MP4]](https://cimss.ssec.wisc.edu/satellite-blog/wp-content/uploads/sites/5/2018/10/181014_goes17_visible_Greenland_dust_plume_anim.gif)
![GOES-17 Near-Infrared "Snow/Ice" (1.61 µm) images [click to play animation | MP4]](https://cimss.ssec.wisc.edu/satellite-blog/wp-content/uploads/sites/5/2018/10/181014_goes17_snow_ice_Greenland_dust_plume_anim.gif)
![Metop-B ASCAT surface scatterometer winds [click to enlarge]](https://cimss.ssec.wisc.edu/satellite-blog/wp-content/uploads/sites/5/2018/10/181014_1258utc_metopb_ascat.png)
![EUMETSAT Meteosat-11 Water Vapor (6.25 µm) images, with hourly plots of surface winds and gusts in knots [click to play animation | MP4]](https://cimss.ssec.wisc.edu/satellite-blog/wp-content/uploads/sites/5/2018/10/181013_meteosat11_waterVapor_b5_Leslie_landfall_anim.gif)
![Meteosat-11 Water Vapor (7.35 µm) images, with hourly splots of surface winds and gusts in knots [click to play animation | MP4]](https://cimss.ssec.wisc.edu/satellite-blog/wp-content/uploads/sites/5/2018/10/181013_meteosat11_waterVapor_band6_sting_jet_anim.gif)
![Radar reflectivity composites [click to play animation]](https://cimss.ssec.wisc.edu/satellite-blog/wp-content/uploads/sites/5/2018/10/181013_Portugal_radar_Leslie_landfall_anim.gif)
![GOES-16 Mid-level Water Vapor (6.9 µm) images, with hourly plots of surface winds and gusts in knots [click to play animation | MP4]](https://cimss.ssec.wisc.edu/satellite-blog/wp-content/uploads/sites/5/2018/10/181013_goes16_waterVapor_Leslie_landfall_anim.gif)

/na2018_10_14_287.gif)