![GOES-16 Air Mass RGB images [click to play animation | MP4]](https://cimss.ssec.wisc.edu/satellite-blog/wp-content/uploads/sites/5/2019/03/20190313133719_conus.jpg)
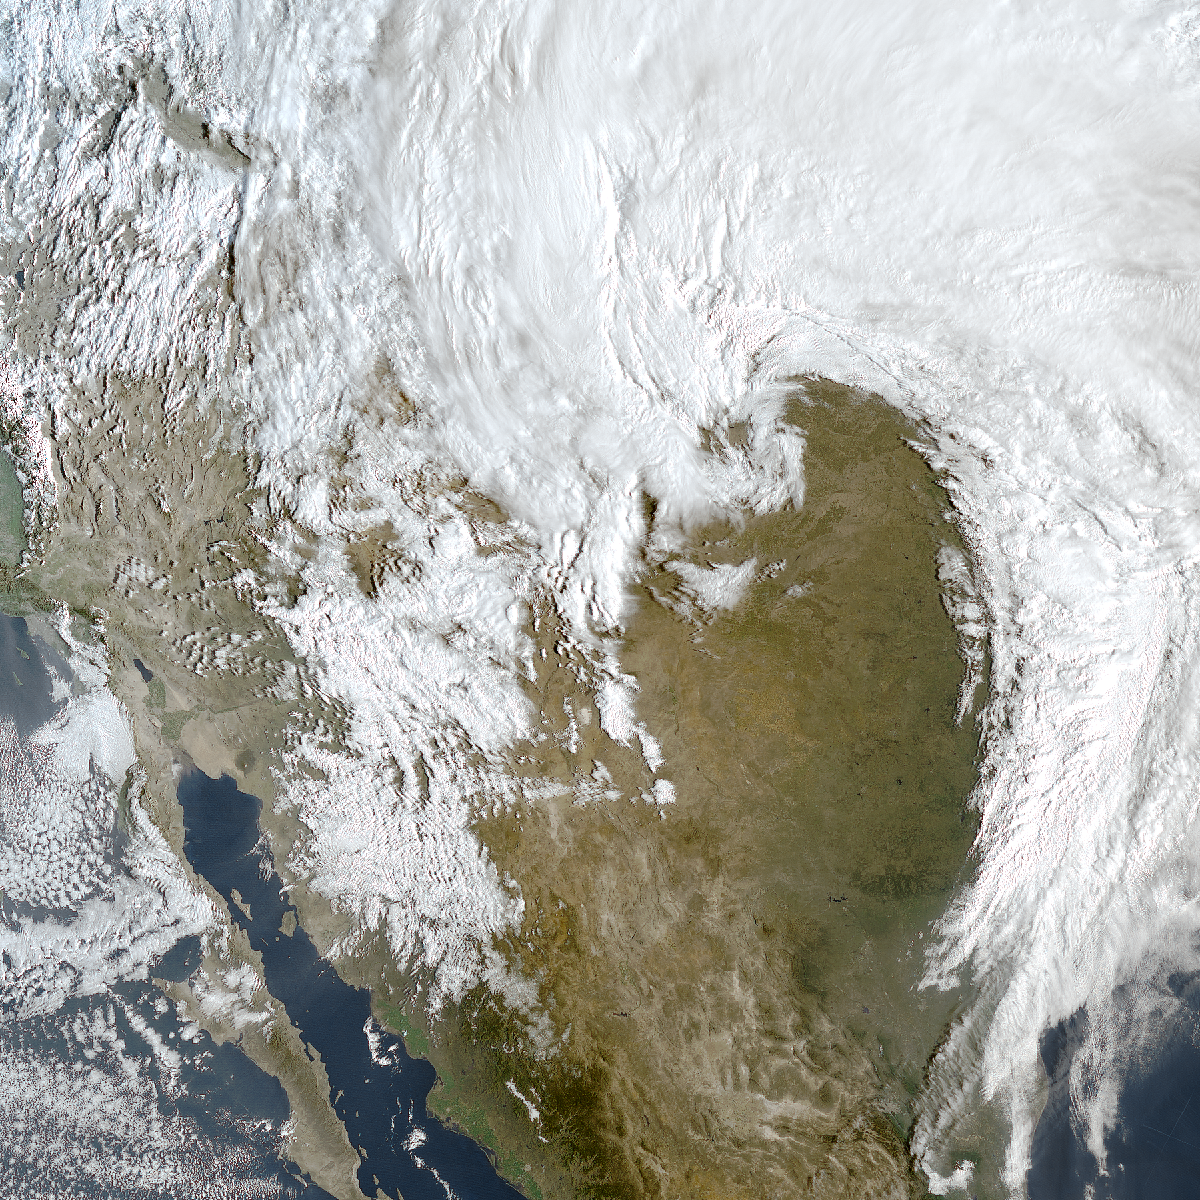
GOES-16 Air Mass RGB images [click to play animation | MP4]
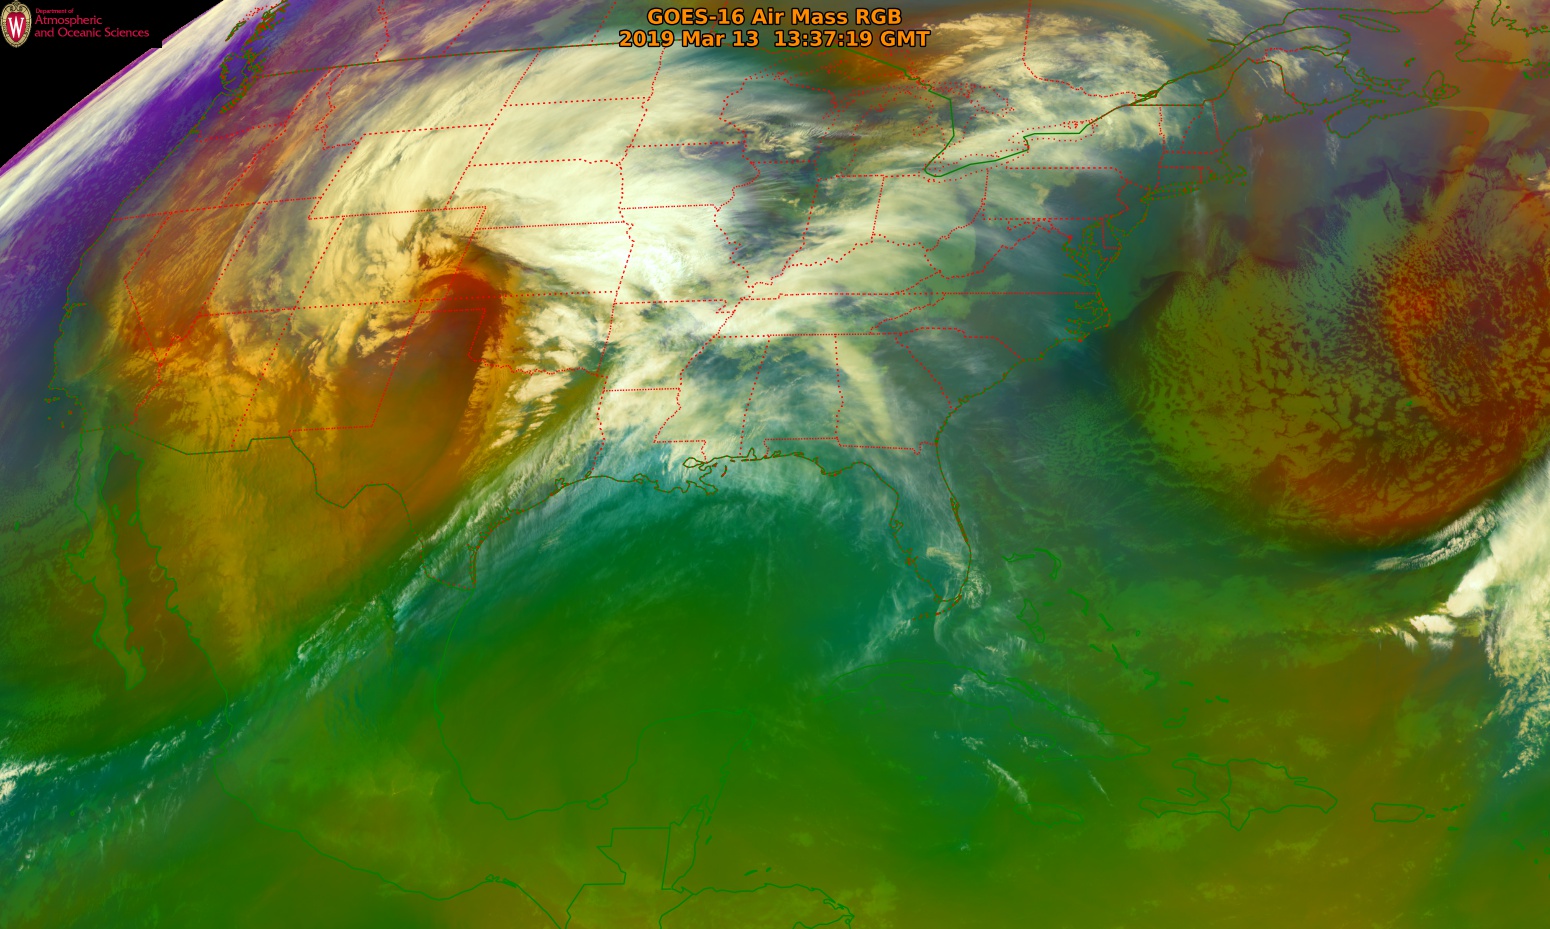
An unusually deep midlatitude cyclone — which easily met the criteria of a “bomb cyclone”, with its central pressure dropping 25 hPa in only 12 hours (
surface analyses) — developed over the central US on
13 March 2019 (
WPC storm summary). GOES-16
(GOES-East) Air Mass RGB images from the
AOS site
(above) showed the large size of the cloud shield — and the deeper red hues over the High Plains indicated the presence of ozone-rich air (from the stratosphere) within the atmospheric column as the tropopause descended. A preliminary new all-time low surface pressure of 975.1 hPa occurred at Pueblo, Colorado just after 13 UTC; to the east of Pueblo, a 970.4 hPa minimum pressure recorded at Lamar (
plot) possibly set a
new state record for Colorado.
On a map of NWS warnings/advisories valid at 14 UTC (below), Blizzard Warnings (red) extended from Colorado to the US/Canada border. South of the Blizzard Warnings, High Wind Warnings (brown) were in effect to the US/Mexico border.
![Map of NWS warnings and advisories at 14 UTC [click to enlarge]](https://cimss.ssec.wisc.edu/satellite-blog/wp-content/uploads/sites/5/2019/03/190313_14utc_nws_warnings_advisories.png)
Map of NWS warnings and advisories at 14 UTC [click to enlarge]
GOES-16 Mid-level Water Vapor (
6.9 µm) images
(below) displayed a hook-like signature resembling that of a sting jet, which developed over the Texas/Oklahoma Panhandle area after 11 UTC. At
14 UTC an interesting burst of surface wind gusts occurred at 3 sites —
Burlington CO,
Goodland KS and
Colby KS — which may have been related to the downward transfer of momentum along the leading edge of the sting jet flow. The corresponding
7.3 µm Low-level Water Vapor animations are also available:
GIF |
MP4.
![GOES-16 Mid-level Water Vapor (6.9 µm) images [click to play animation | MP4]](https://cimss.ssec.wisc.edu/satellite-blog/wp-content/uploads/sites/5/2019/03/G16_WV_WINDS_PLAINS_BLIZZARD_V2_13MAR2019_2019072_140219_GOES-16_0001PANEL.GIF)
GOES-16 Mid-level Water Vapor (6.9 µm) images [click to play animation | MP4]
The
MIMIC Total Precipitable Water product
(below) showed the northward surge of moisture from the Gulf of Mexico.
![MIMIC Total Precipitable Water product [click to play animation | MP4]](https://cimss.ssec.wisc.edu/satellite-blog/wp-content/uploads/sites/5/2019/03/comp20190313.140000_tpw.png)
MIMIC Total Precipitable Water product [click to play animation | MP4]
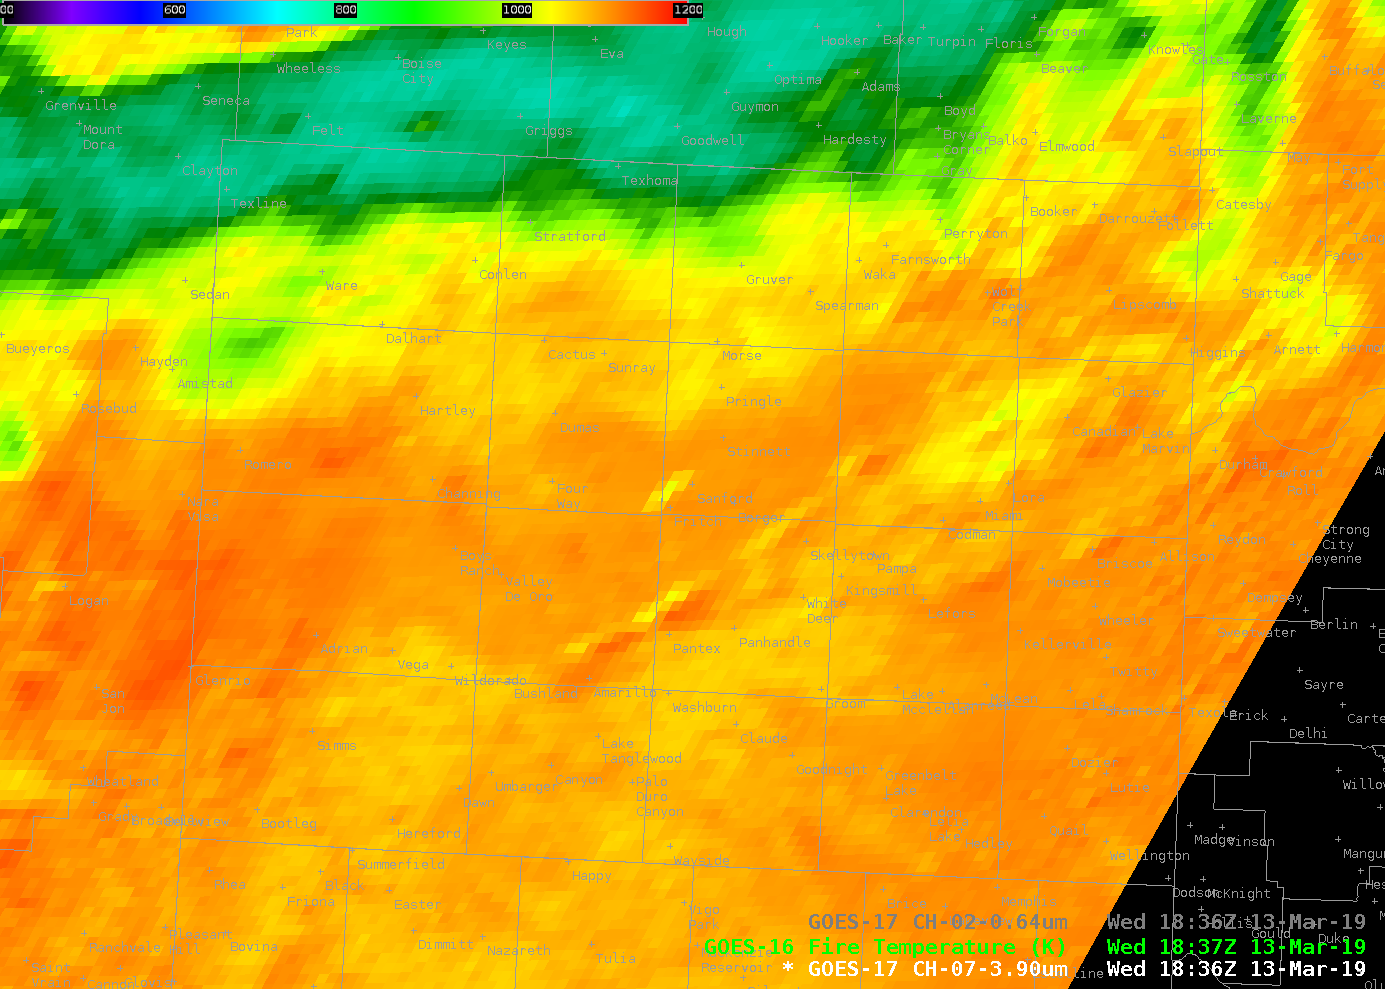
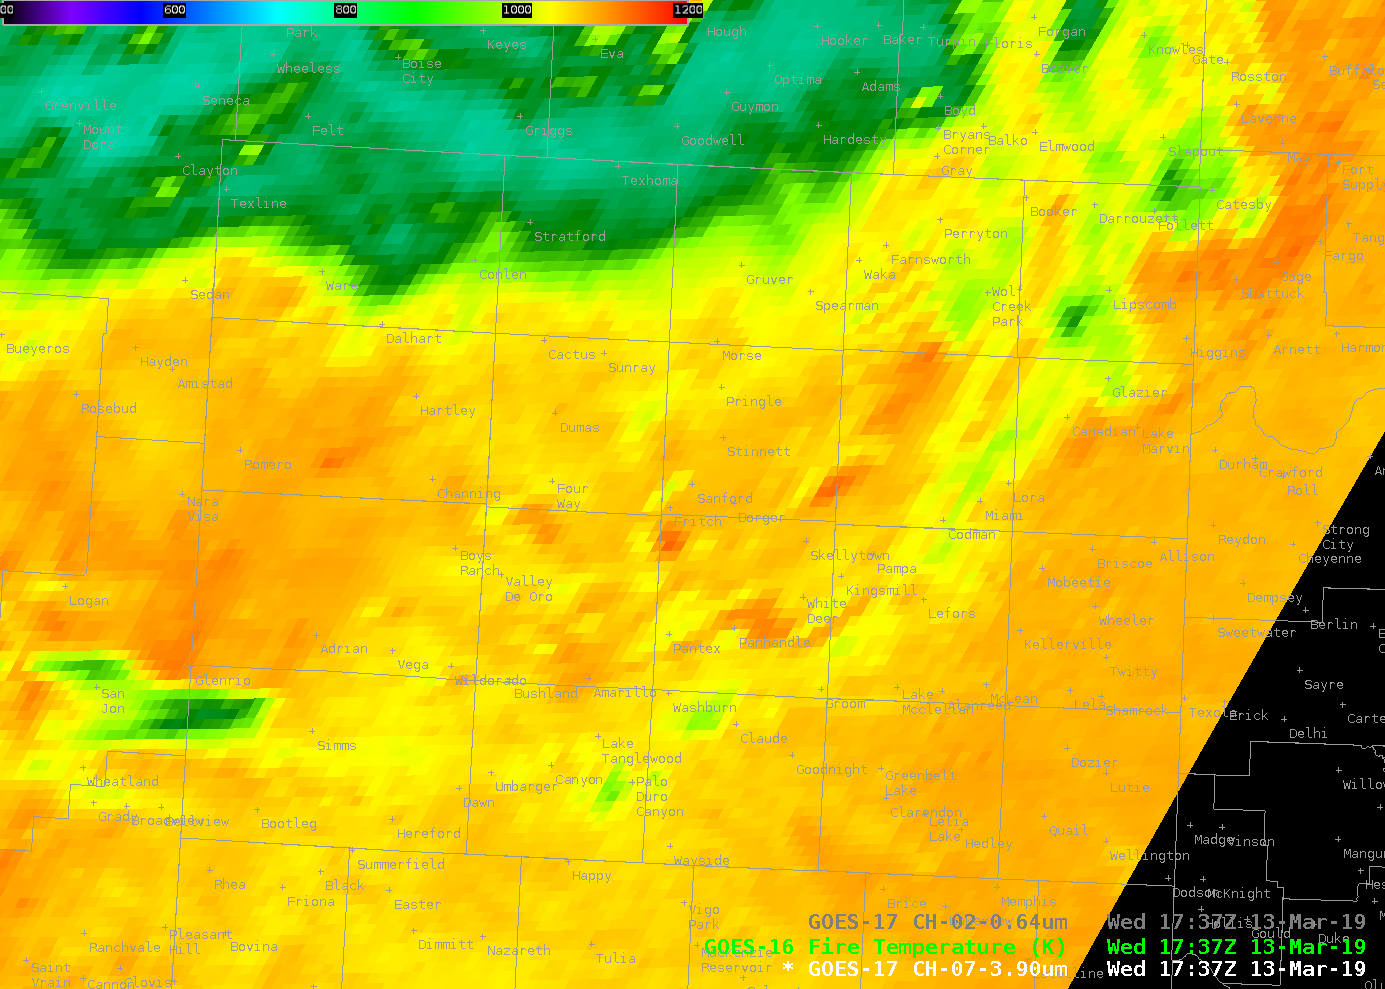
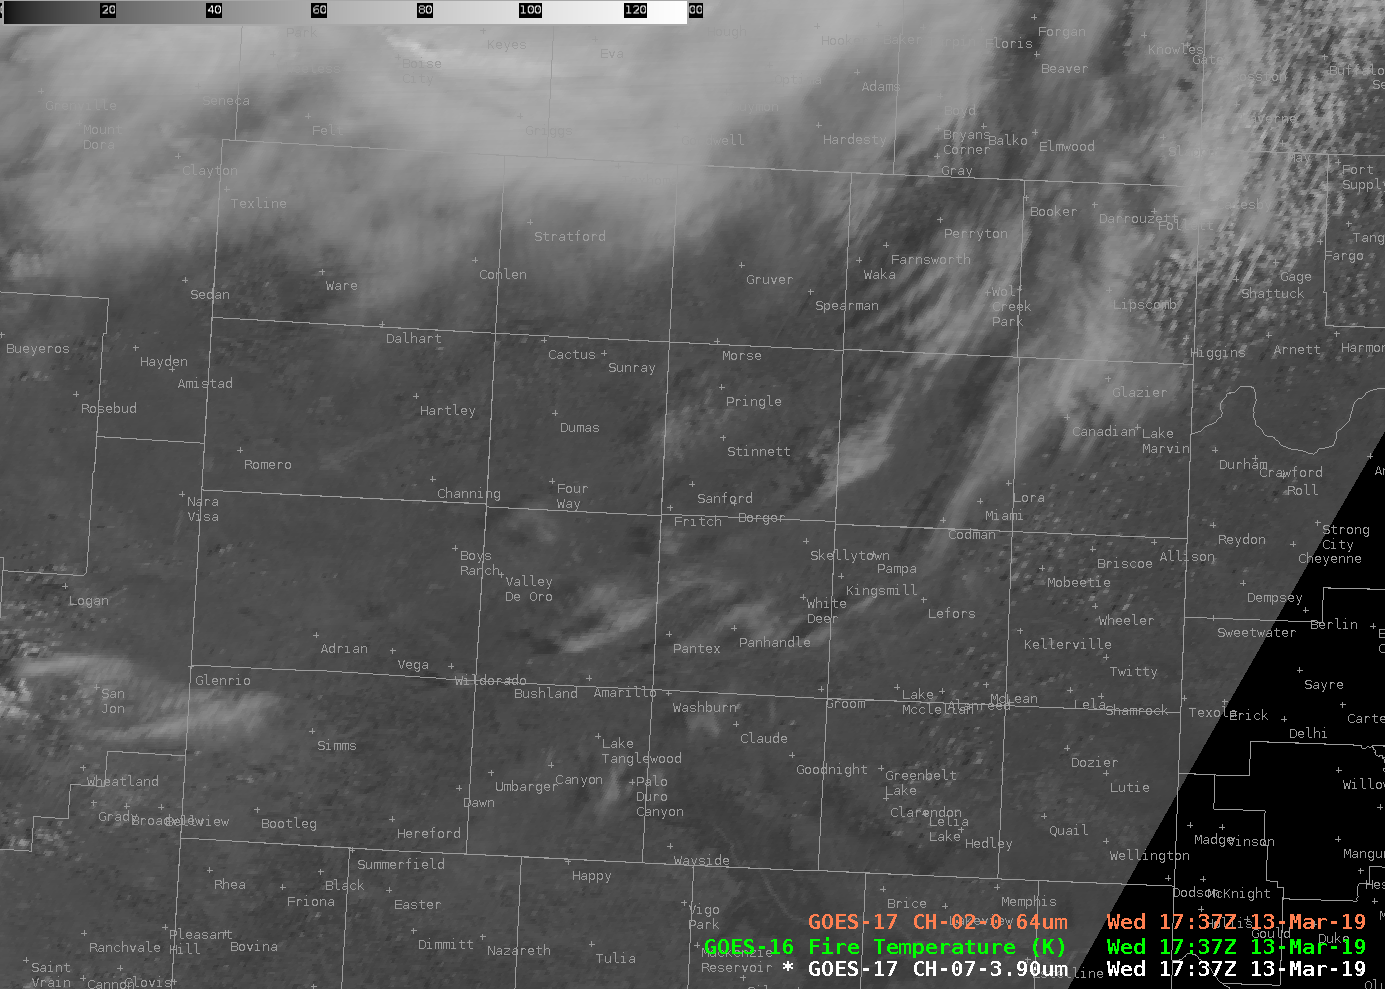
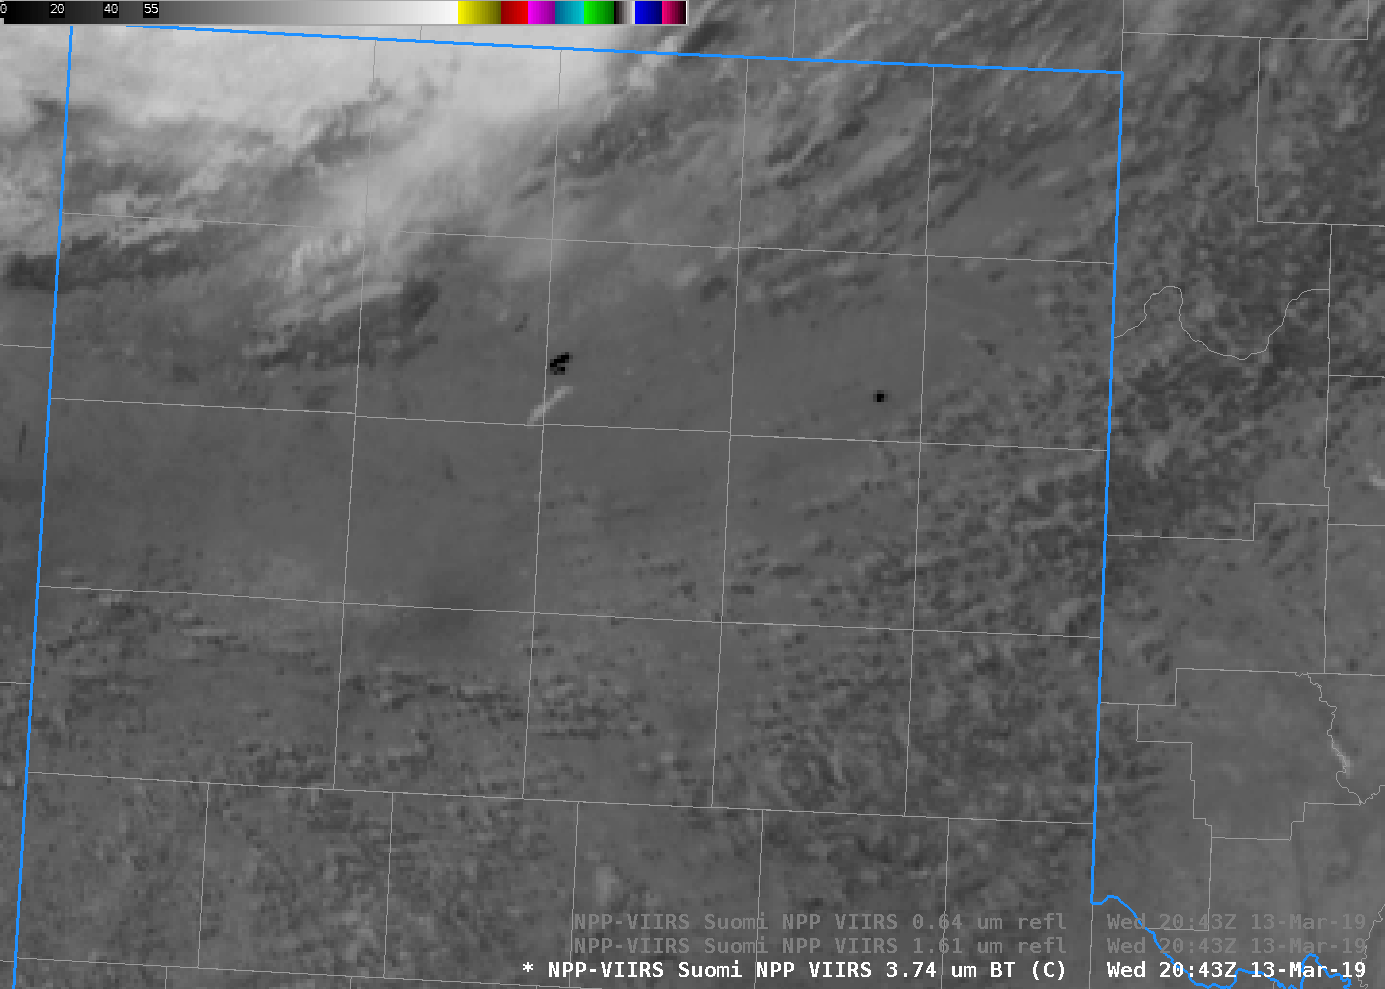
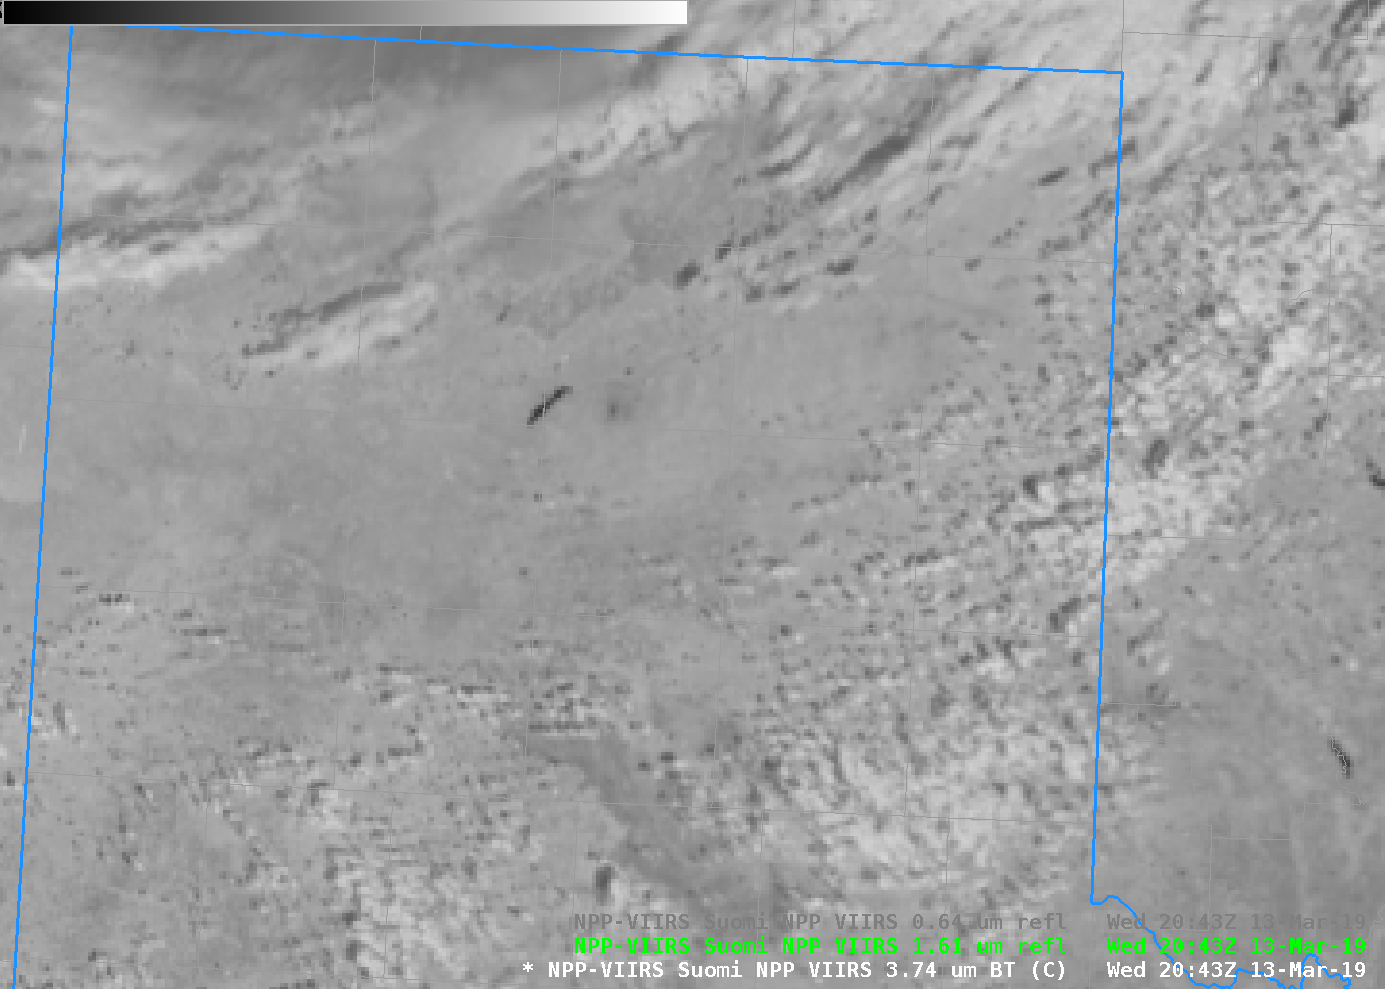
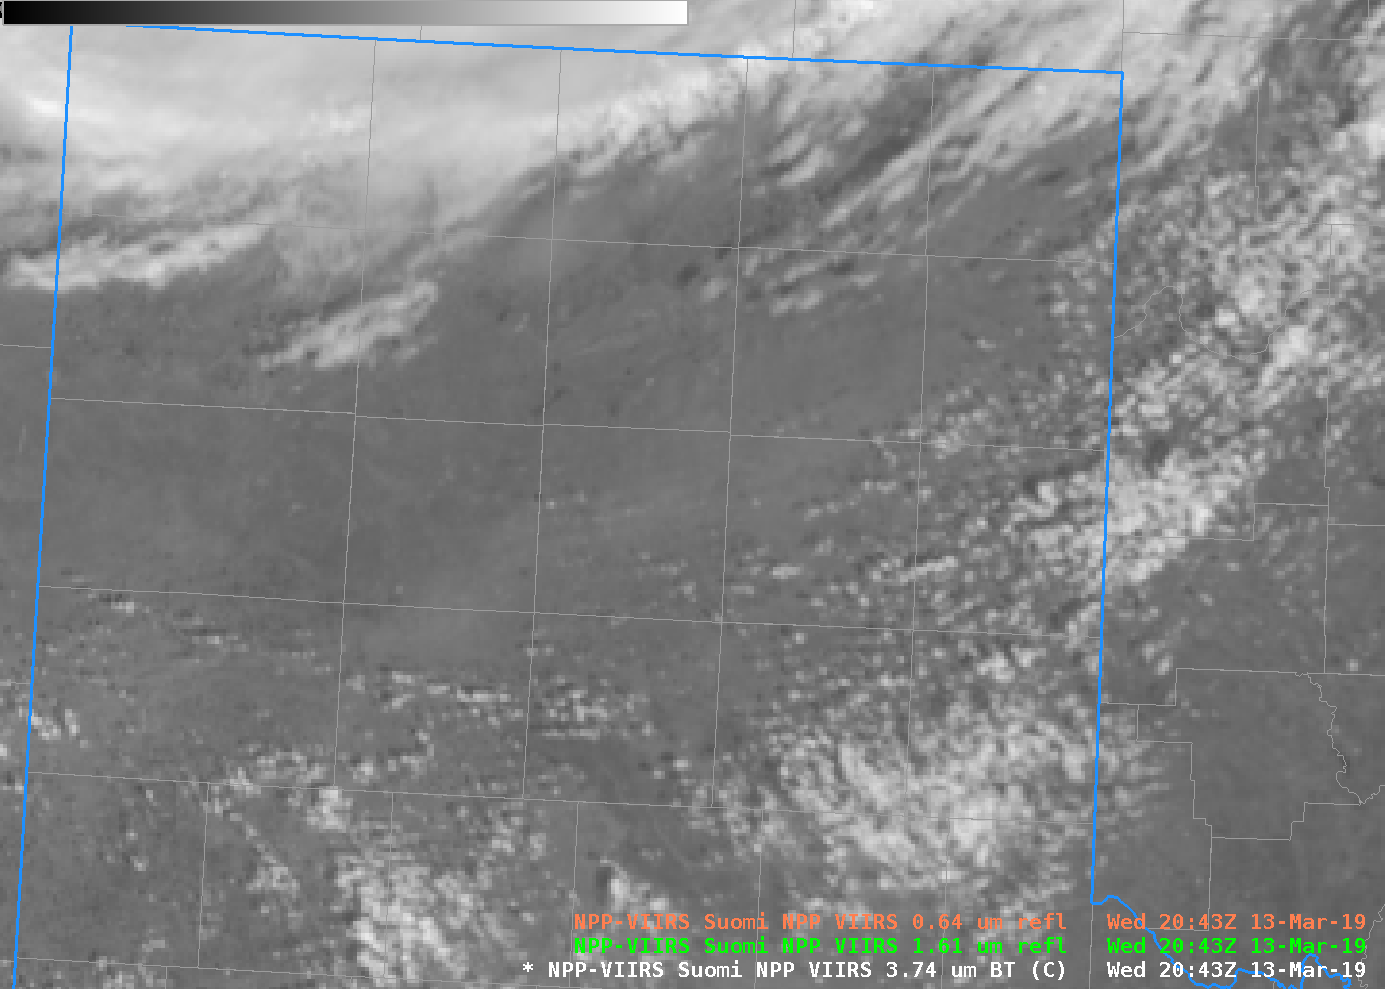
During the afternoon hours, the strong surface winds began to create plumes of blowing dust across parts of southeastern New Mexico and western Texas — a blowing dust signature first became apparent on GOES-16
Split Window Difference imagery as plumes of yellow, but then became more obvious on “Red” Visible (
0.64 µm) images as the afternoon forward scattering angle increased
(below). Blowing dust reduced the surface visibility to 1-2 miles at Snyder (
KSNK) and Lubbock (
KLBB).
![GOES-16 "Red" Visible (0.64 µm) and Split Window Difference images [click to play animation | MP4]](https://cimss.ssec.wisc.edu/satellite-blog/wp-content/uploads/sites/5/2019/03/bldn_swd-20190313_202719.png)
GOES-16 “Red” Visible (0.64 µm) and Split Window Difference images [click to play animation | MP4]
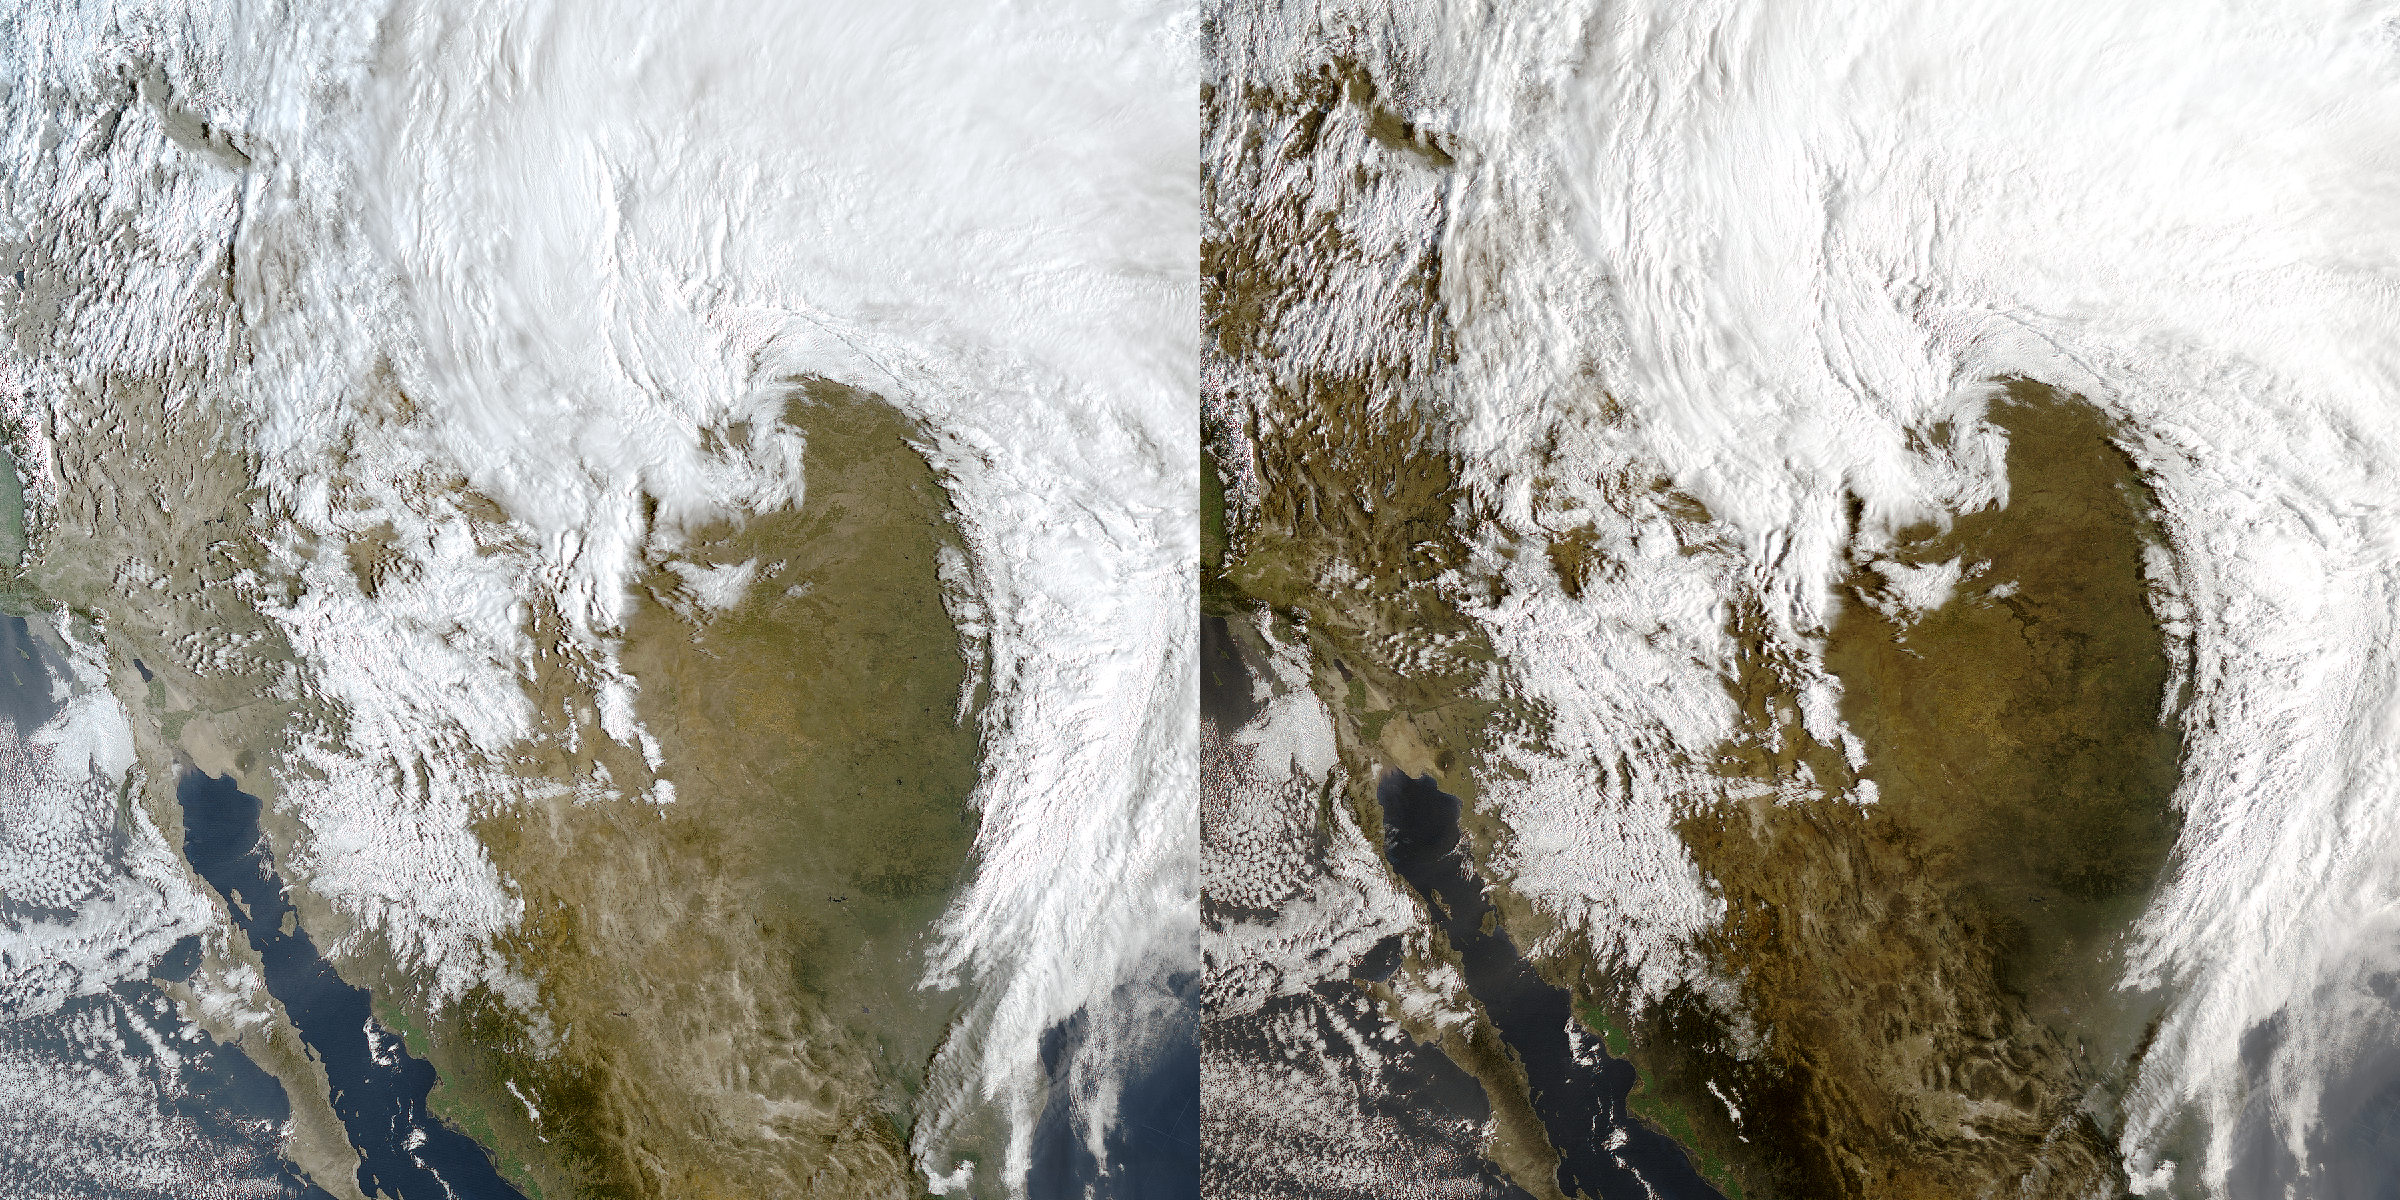
The blowing dust signature
(lighter shades of brown) was also easily seen in late-afternoon GOES-16 True Color RGB images
(below) — the dust plume reached southwestern Oklahoma by the end of the daytime hours, restricting the visibility to 5 miles at Frederick (
KFDR). The blowing dust was also evident in True Color imagery from GOES-17, as seen
here.
![GOES-16 True Color RGB images [click to play animation | MP4]](https://cimss.ssec.wisc.edu/satellite-blog/wp-content/uploads/sites/5/2019/03/201903132137_conus.jpg)
GOES-16 True Color RGB images [click to play animation | MP4]
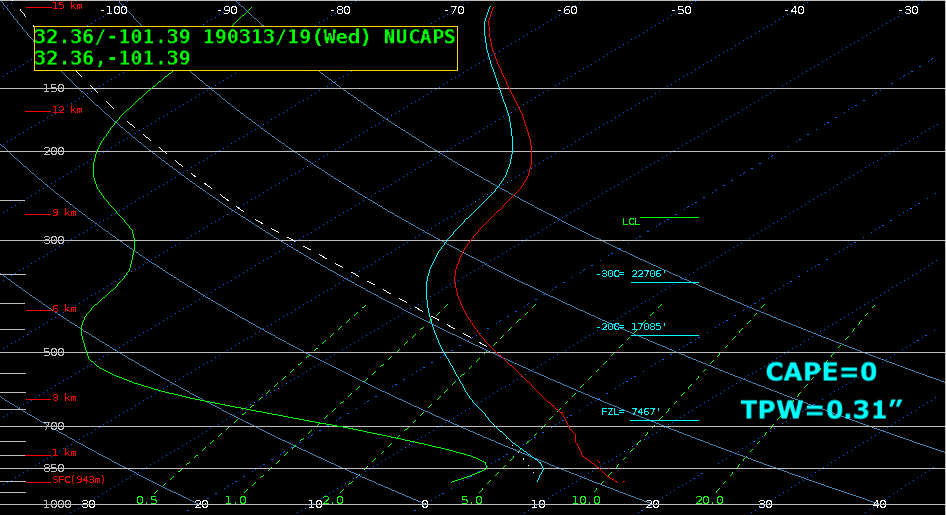
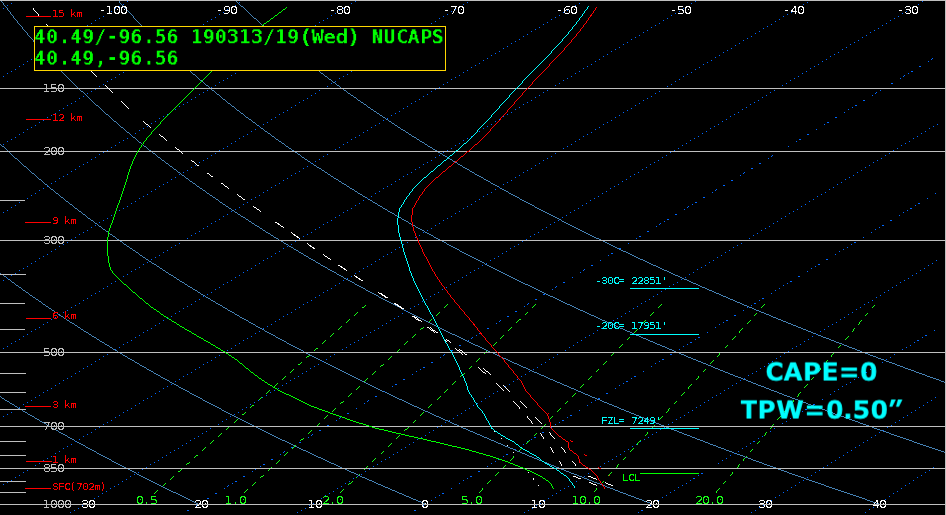
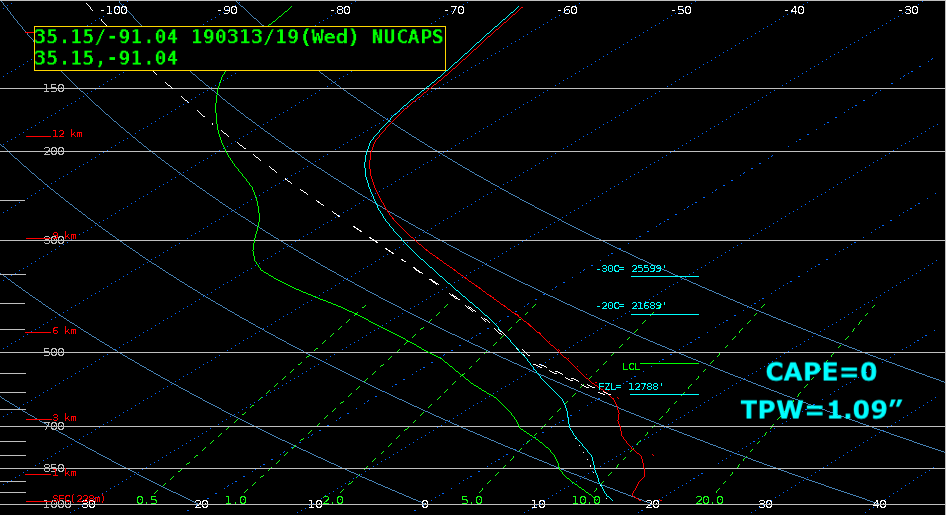
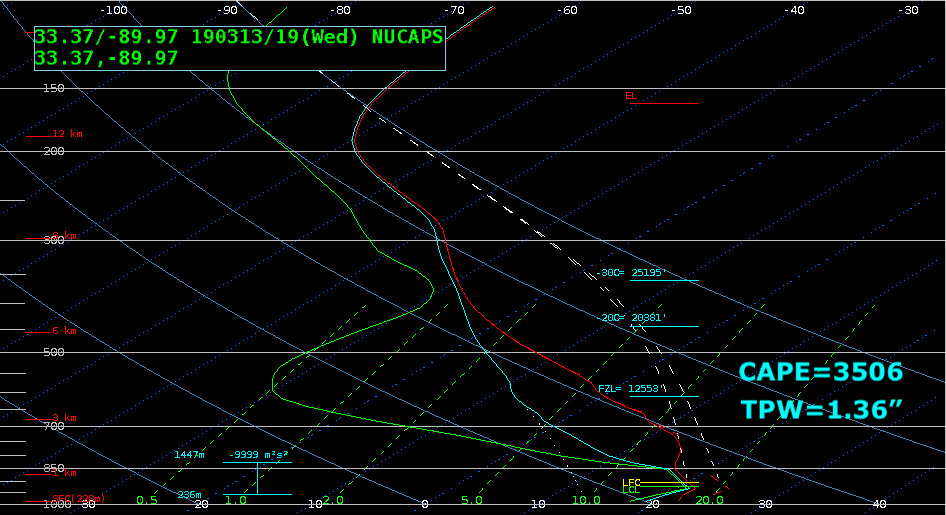
Not long after the cyclone reached its lowest analyzed surface pressure of 968 hPa at 18 UTC, an overpass of the Suomi NPP satellite around 19 UTC provided a swath of
NUCAPS soundings covering much of the storm
(below). The air was very dry and stable near the near the center of the surface low in eastern
Colorado (TPW=0.29″, CAPE=0 J/kg), in western
Texas (TPW=0.31″, CAPE=0 J/kg) and near the frontal triple point in southeastern
Nebraska (TPW=0.30″, CAPE=0 Jkg) — and out ahead of the warm front, the air was moist but stable behind a line of thunderstorms in northeastern
Arkansas (TPW=1.09″, CAPE=0 J/kg) but both moist and unstable in western
Mississippi (TPW=1.36″, CAPE=3506 J/kg).
![Suomi NPP VIIRS Visible (0.64 µm) image, with overlays of the surface analysis and available NUCAPS soundings [click to enlarge]](https://cimss.ssec.wisc.edu/satellite-blog/wp-content/uploads/sites/5/2019/03/bomb_viirs_visible_nucaps-20190313_185912_anim.gif)
Suomi NPP VIIRS Visible (0.64 µm) image, with overlays of the surface analysis and available NUCAPS soundings [click to enlarge]
During the early stages of cyclone development, this system spawned severe thunderstorms that produced tornadoes, large hail and damaging winds across New Mexico and Texas (
SPC storm reports) late in the day on
12 March. A GOES-17
(GOES-West) Mesoscale Domain Sector had been positioned over that region — which was helpful during a brief
GOES-16 data outage — providing images at 1-minute intervals
(below).
GOES-17 “Clean” Infrared Window (10.3 µm) images, with plots of SPC storm reports [click to play animation | MP4]
===== 14 March Update =====
![GOES-16 Mid-level Water Vapor (6.9 µm) images, with hourly plots of surface winds and gusts in knots [click to play animation | MP4]](https://cimss.ssec.wisc.edu/satellite-blog/wp-content/uploads/sites/5/2019/03/G16_WV_WINDS_PLAINS_BLIZZARD_14MAR2019_2019073_120219_GOES-16_0001PANEL.GIF)
GOES-16 Mid-level Water Vapor (6.9 µm) images, with hourly plots of surface winds and gusts in knots [click to play animation | MP4]
GOES-16 Mid-level Water Vapor (6.9 µm) images
(above) showed the storm moving slowly northeastward across Kansas, Nebraska and Iowa on 14 March — with strong winds continuing north and west of the surface low, blizzard conditions persisted across much of the Midwest.
Farther to the east, severe thunderstorms produced large hail, damaging winds and tornadoes as far north as northern Illinois/Indiana/Ohio and southern Lower Michigan (SPC storm reports | NWS Detroit) — as shown with 1-minute Mesoscale Domain Sector GOES-16 Visible images (below). The corresponding GOES-16 Infrared image animation is available here; the coldest cloud-top infrared brightness temperatures were only in the -30 to -40ºC range
![GOES-16 "Red" Visible (0.64 µm) Visible images, with SPC storm reports plotted in red [click to play MP4 animation]](https://cimss.ssec.wisc.edu/satellite-blog/wp-content/uploads/sites/5/2019/03/G16_VIS_IL_IN_MI_SVR_14MAR2019_2019073_230327_GOES-16_0001PANEL.GIF)
GOES-16 “Red” Visible (0.64 µm) Visible images, with SPC storm reports plotted in red [click to play MP4 animation]
View only this post
Read Less
![Meteosat-8 Infrared (10.8 µm) and DMSP-17 SSMIS Microwave (85 GHz) images of Cyclone Idai at 1630 UTC [click to enlarge]](https://cimss.ssec.wisc.edu/satellite-blog/wp-content/uploads/sites/5/2019/03/190314_1630utc_meteosat8_infrared_dmsp17__microwave_Idai_anim.gif)
![Meteosat-8 Infrared Window (10.8 µm) image, with plots of Metop-A ASCAT winds at 1911 UTC [click to enlarge]](https://cimss.ssec.wisc.edu/satellite-blog/wp-content/uploads/sites/5/2019/03/190314_1900utc_meteosat8_infrared_metopA_ascat_winds_Idai.png)
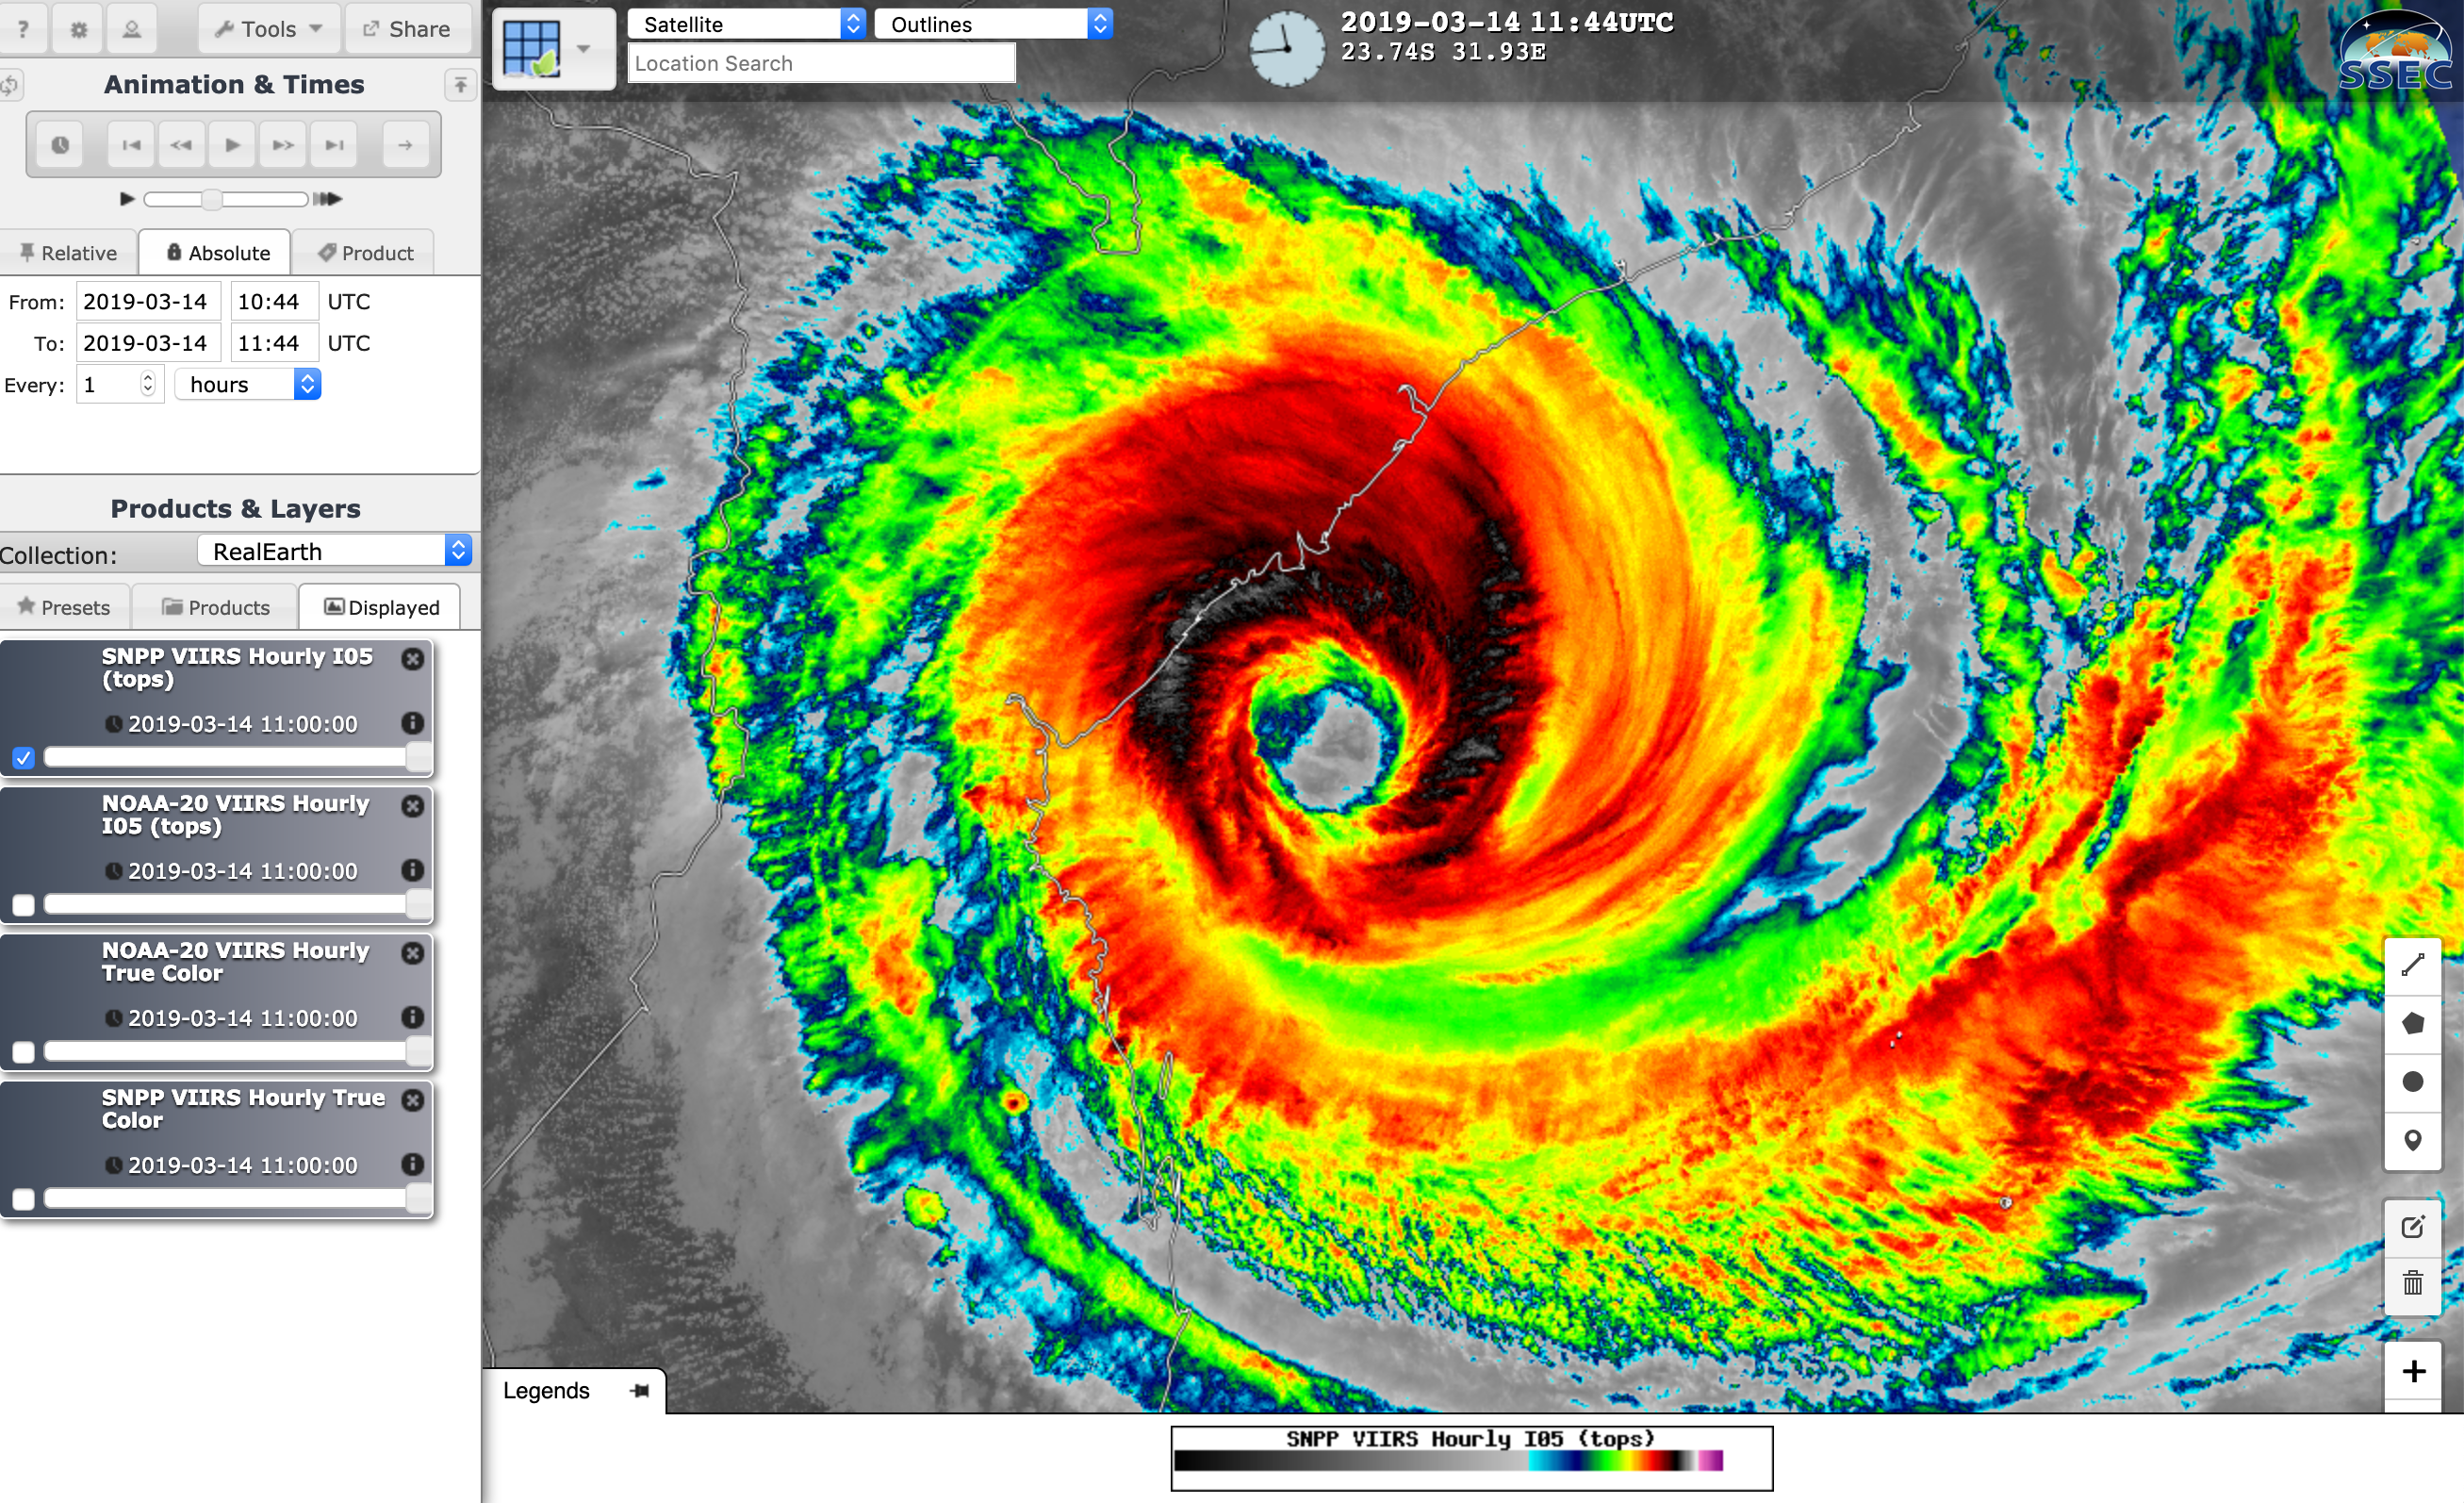
![NOAA-20 and Suomi NPP VIIRS True Color RGB and Infrared Window (11.45 µm) images [click to enlarge]](https://cimss.ssec.wisc.edu/satellite-blog/wp-content/uploads/sites/5/2019/03/190314_noaa20_suomiNPP_viirs_truecolor_infrared_Cyclone_Idai_anim.gif)
![Meteosat-8 Infrared Window (10.8 µm) images with contours of satellite-derived Deep-Layer Wind Shear valid at 18 UTC [click to enlarge]](https://cimss.ssec.wisc.edu/satellite-blog/wp-content/uploads/sites/5/2019/03/190314_meteosat8_infrared_Idai_anim.gif)
![MIMIC TC morphed microwave imagery [click to enlarge]](https://cimss.ssec.wisc.edu/satellite-blog/wp-content/uploads/sites/5/2019/03/190314_mimicTC_Idai_anim.gif)
![Meteosat-8 High Resolution Visible (0.8 µm) images [click to play animation]](https://cimss.ssec.wisc.edu/satellite-blog/wp-content/uploads/sites/5/2019/03/190314_meteosat8_visible_Idai_anim.gif)
![Surface observation data from Beira, Mozambique [click to enlarge]](https://cimss.ssec.wisc.edu/satellite-blog/wp-content/uploads/sites/5/2019/03/190314_FQBR_SFCMG.GIF)
![Landsat-8 False Color image of the eye of Idai on 11 March [click to play a zooming animation]](https://cimss.ssec.wisc.edu/satellite-blog/wp-content/uploads/sites/5/2019/03/190311_0710utc_landsat8_falsecolor_Idai_anim.gif)


![GOES-16 Air Mass RGB images [click to play animation | MP4]](https://cimss.ssec.wisc.edu/satellite-blog/wp-content/uploads/sites/5/2019/03/190313_goes16_airmassRGB_Plains_cyclone_anim.gif)
![GOES-16 Mid-level Water Vapor (6.9 µm) images [click to play animation | MP4]](https://cimss.ssec.wisc.edu/satellite-blog/wp-content/uploads/sites/5/2019/03/190313_goes16_waterVapor_windGusts_Plains_cyclone_anim.gif)
![MIMIC Total Precipitable Water product [click to play animation | MP4]](https://cimss.ssec.wisc.edu/satellite-blog/wp-content/uploads/sites/5/2019/03/190312_190313_mimicTPW_anim.gif)
![GOES-16 "Red" Visible (0.64 µm) and Split Window Difference images [click to play animation | MP4]](https://cimss.ssec.wisc.edu/satellite-blog/wp-content/uploads/sites/5/2019/03/190313_goes16_visible_splitWindowDifference_NM_TX_blowing_dust_anim.gif)
![GOES-16 True Color RGB images [click to play animation | MP4]](https://cimss.ssec.wisc.edu/satellite-blog/wp-content/uploads/sites/5/2019/03/190313_goes16_truecolor_Plains_cyclone_anim.gif)
![GOES-16 Mid-level Water Vapor (6.9 µm) images, with hourly plots of surface winds and gusts in knots [click to play animation | MP4]](https://cimss.ssec.wisc.edu/satellite-blog/wp-content/uploads/sites/5/2019/03/190314_goes16_waterVapor_windGusts_Plains_cyclone_anim.gif)
