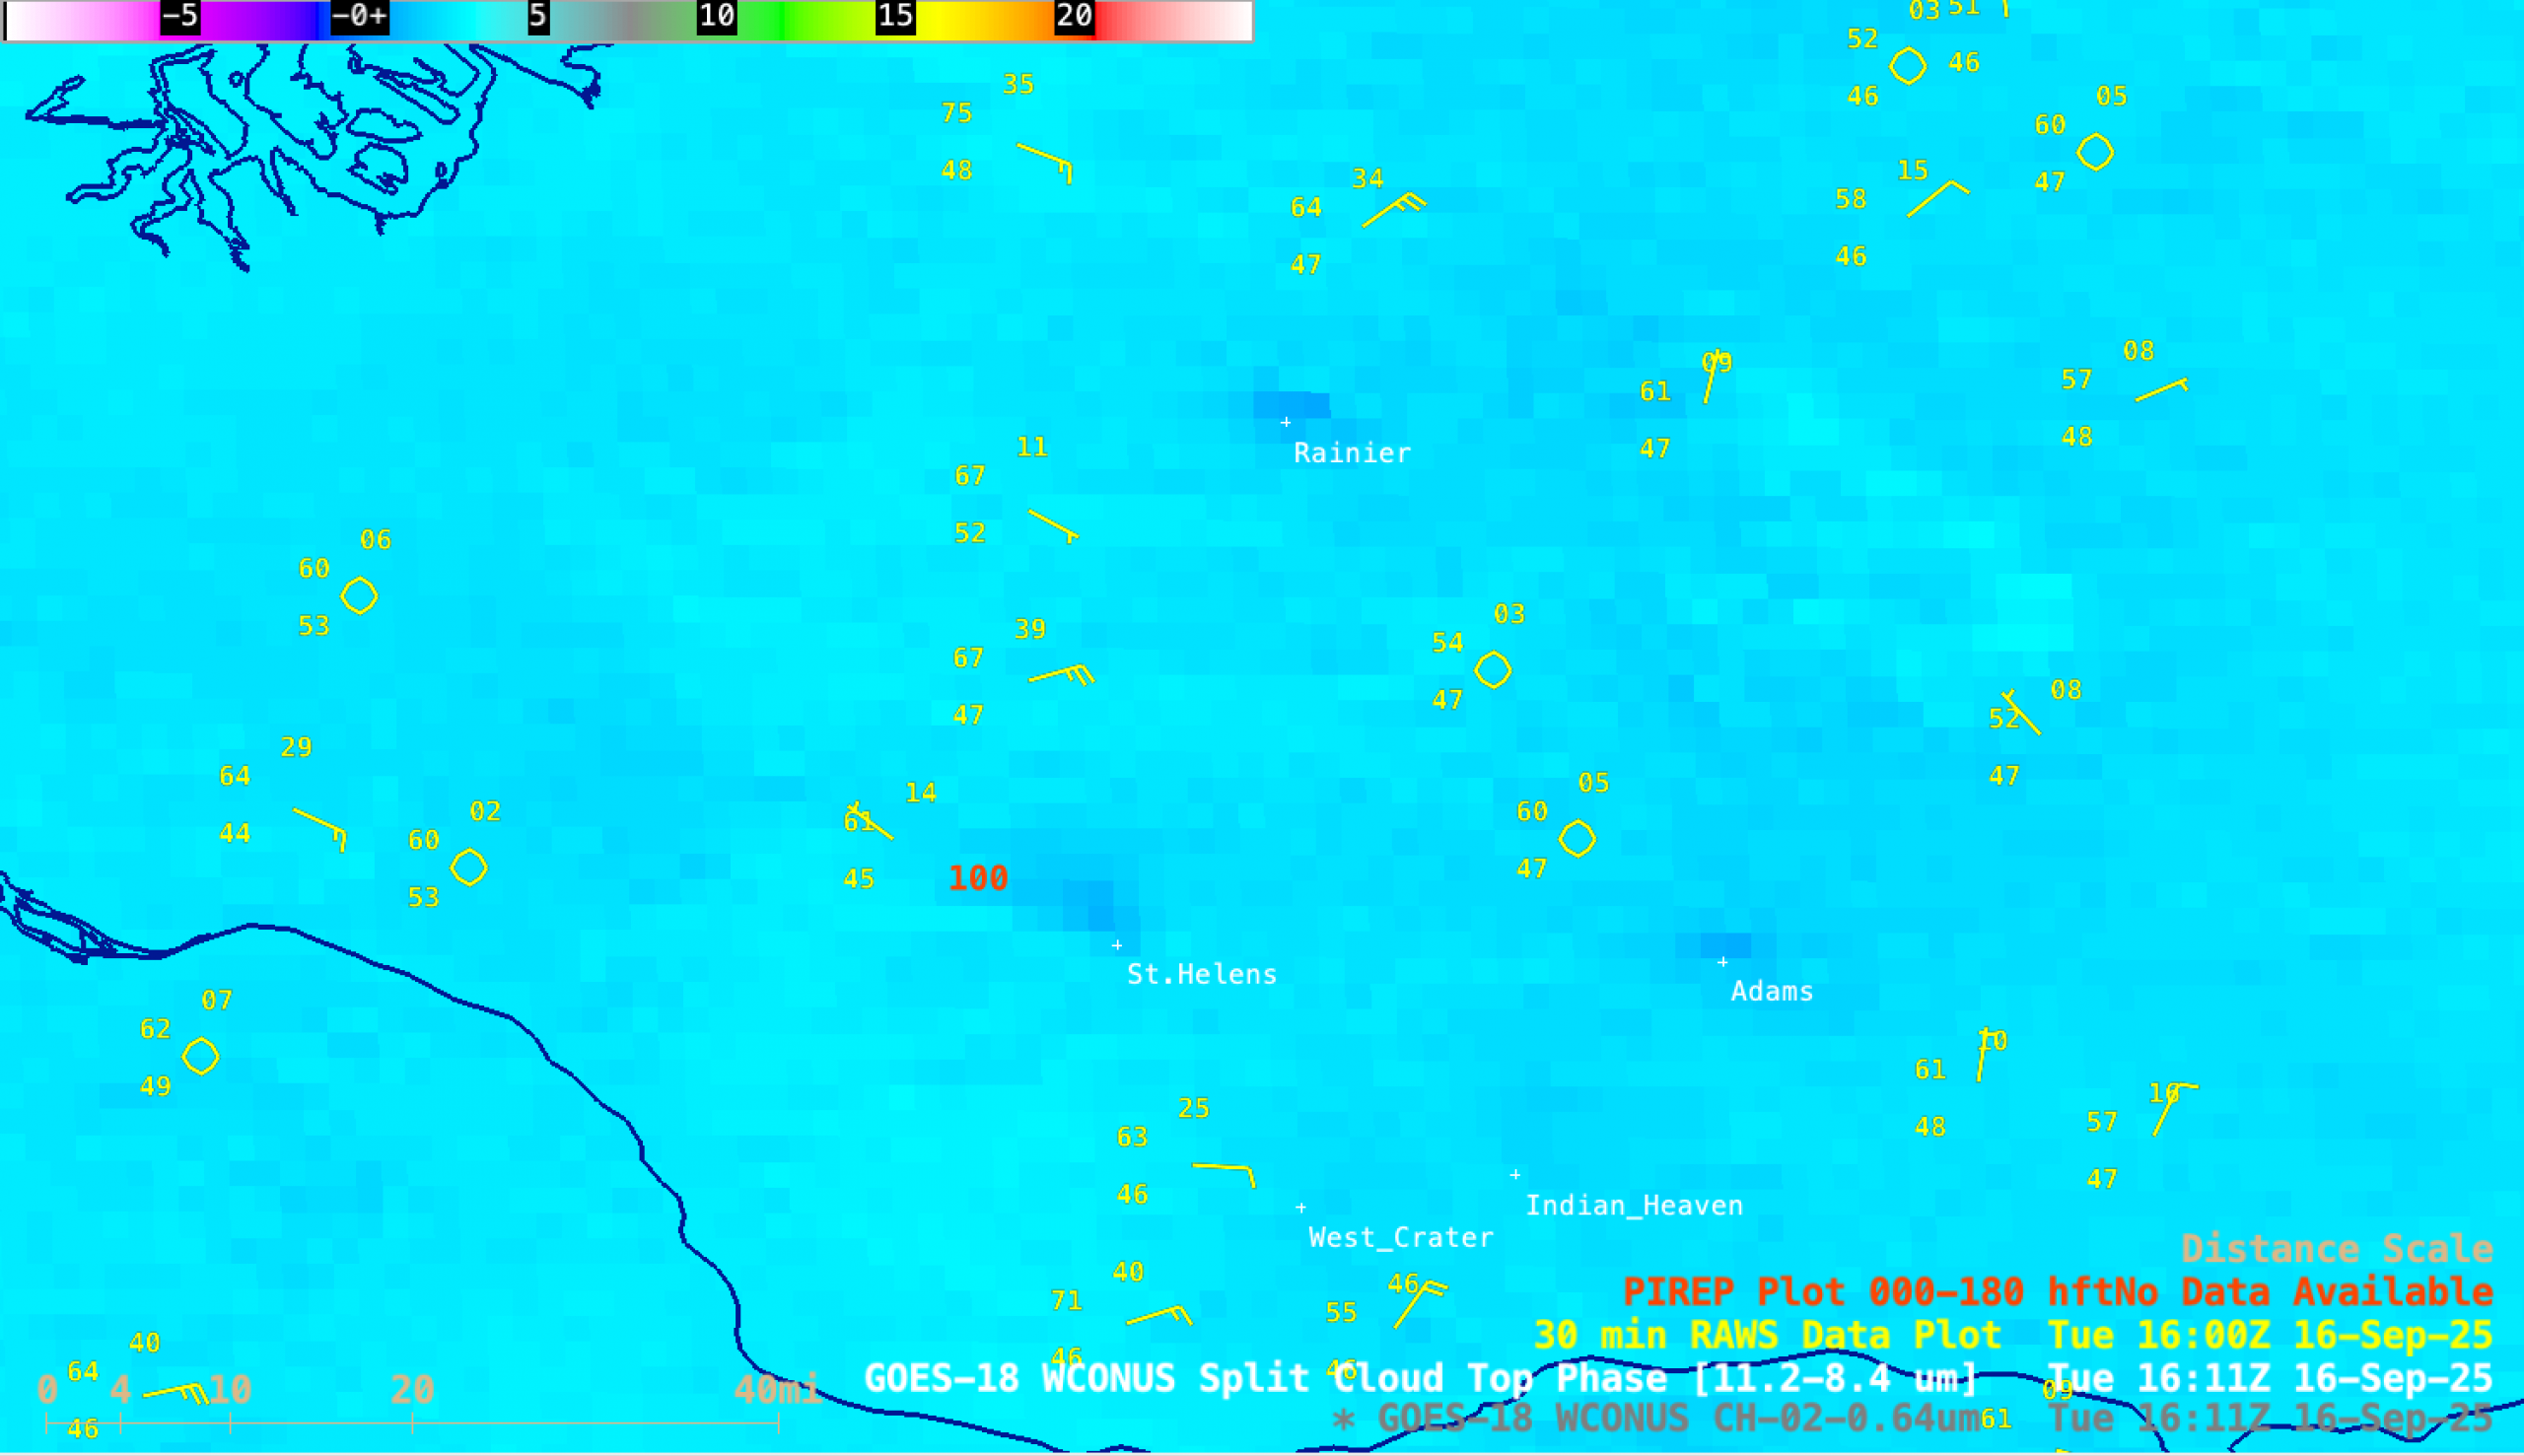
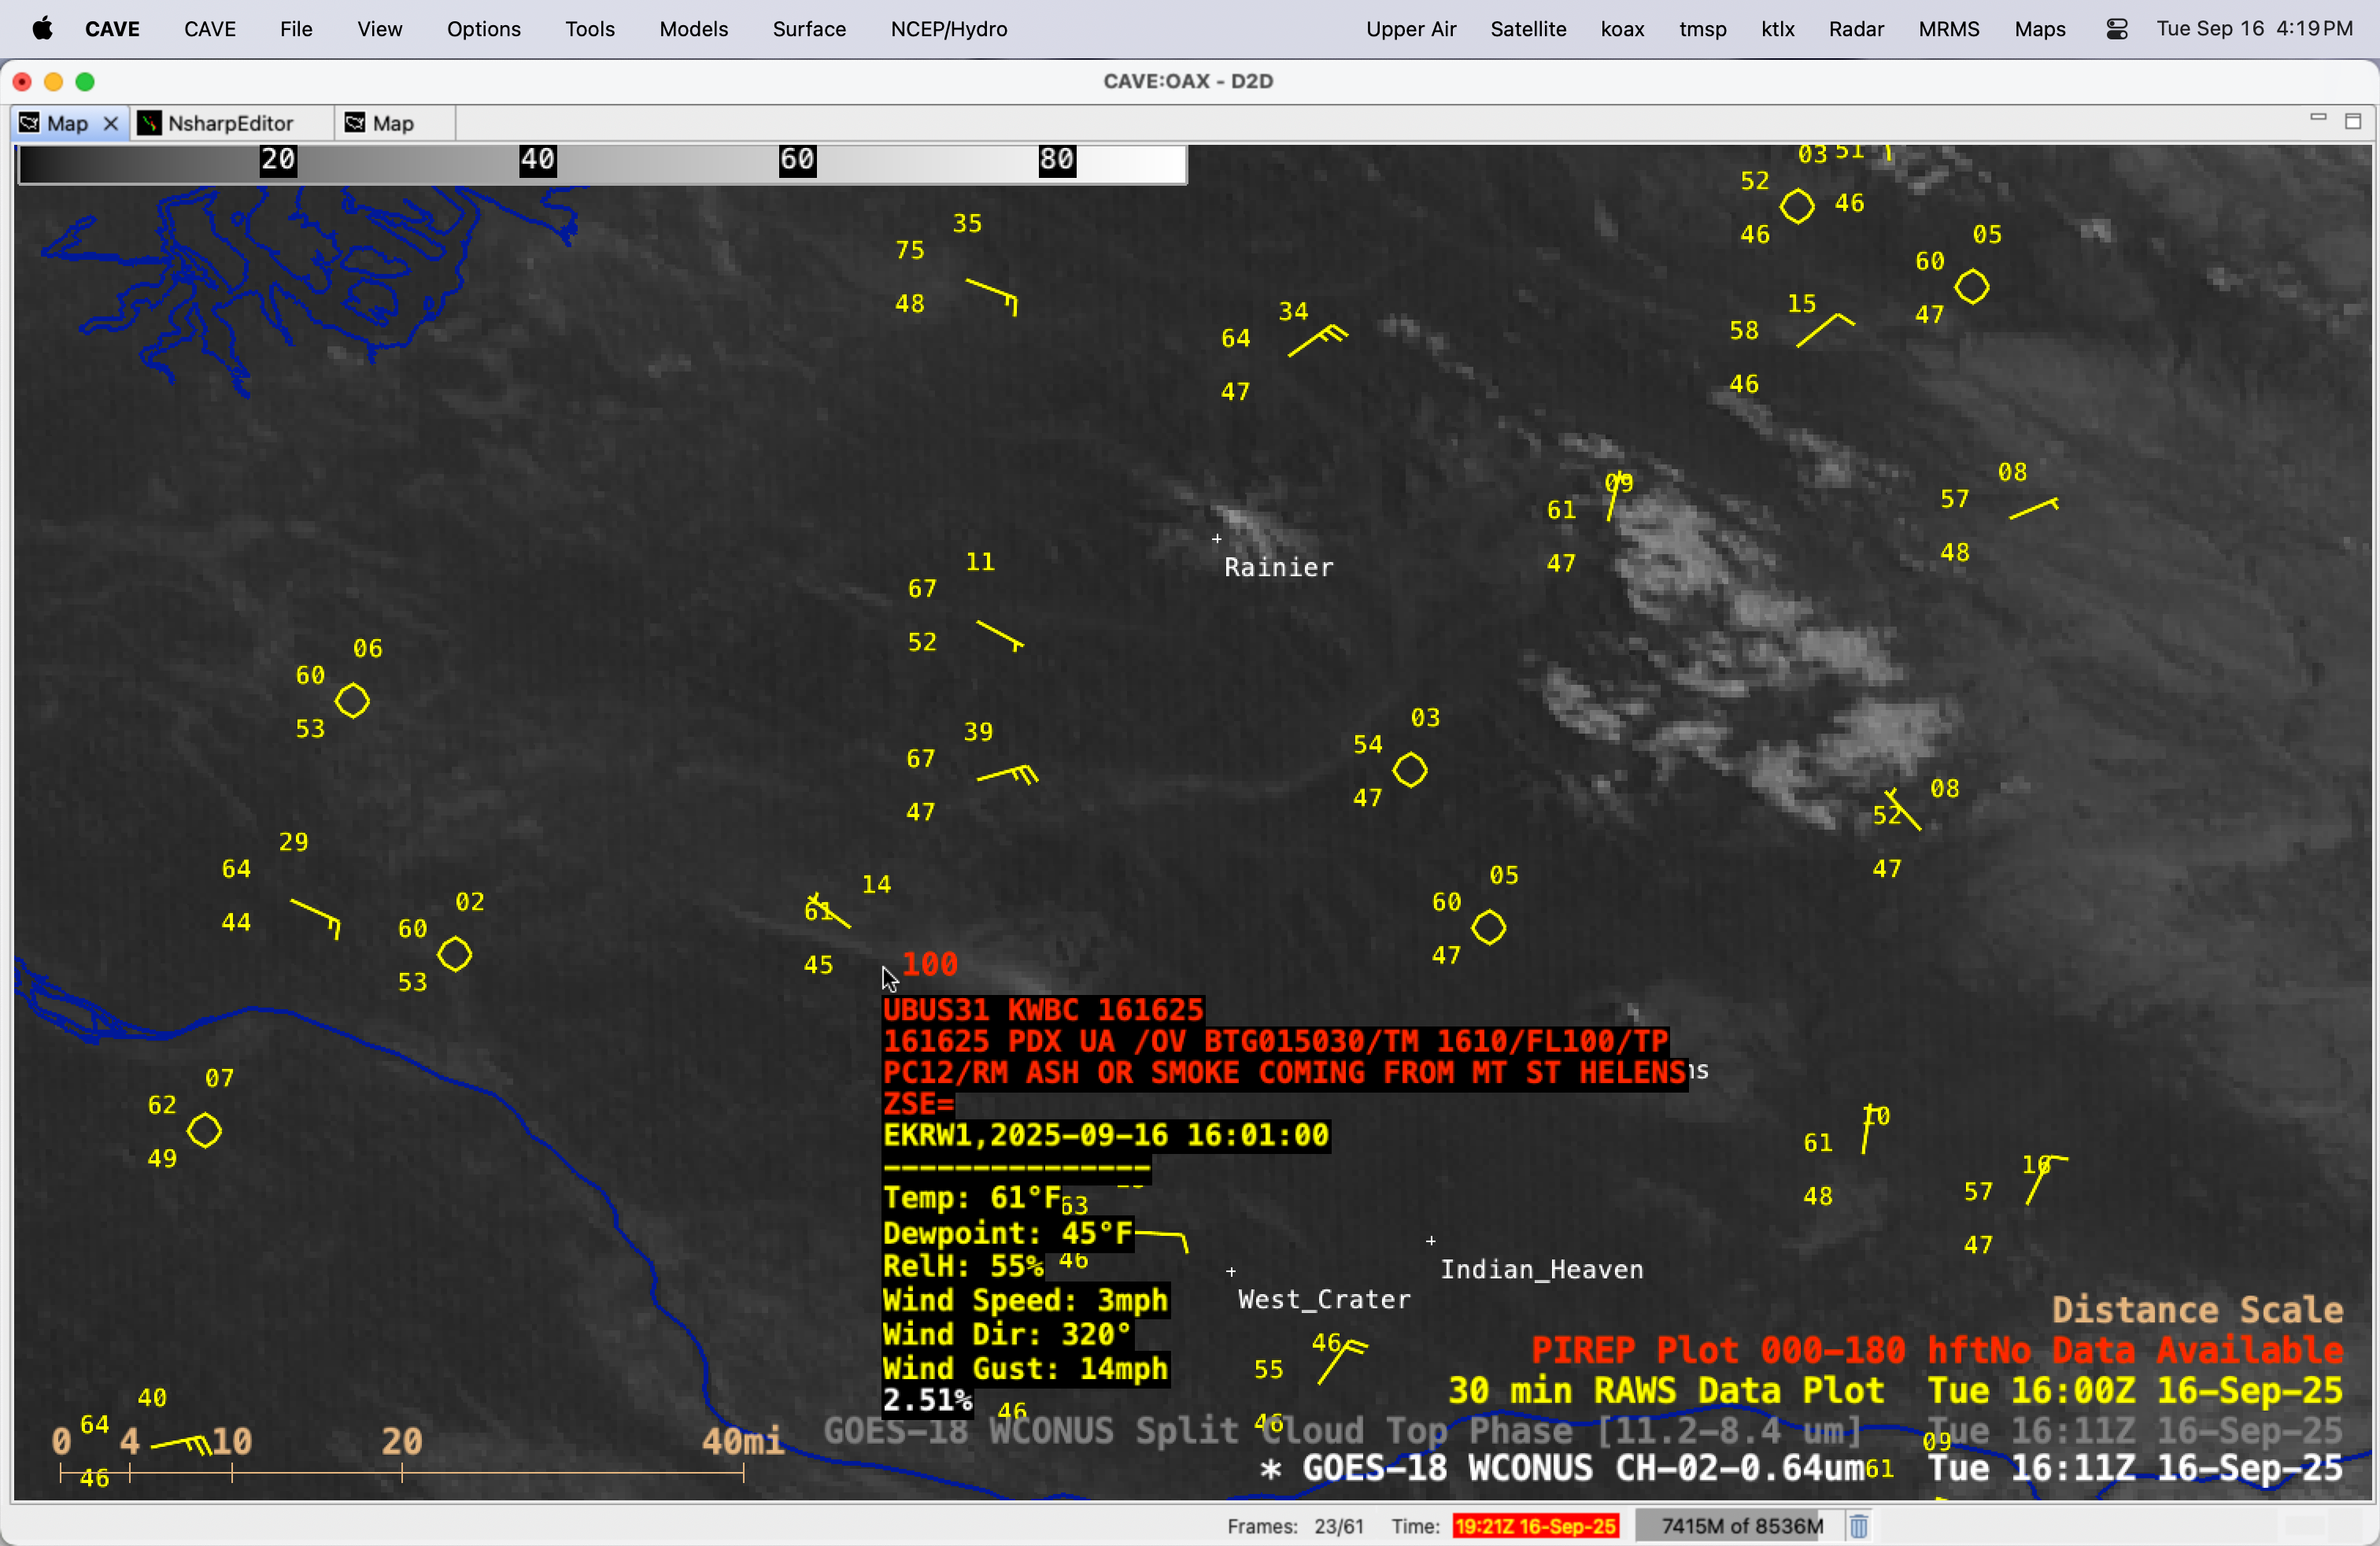
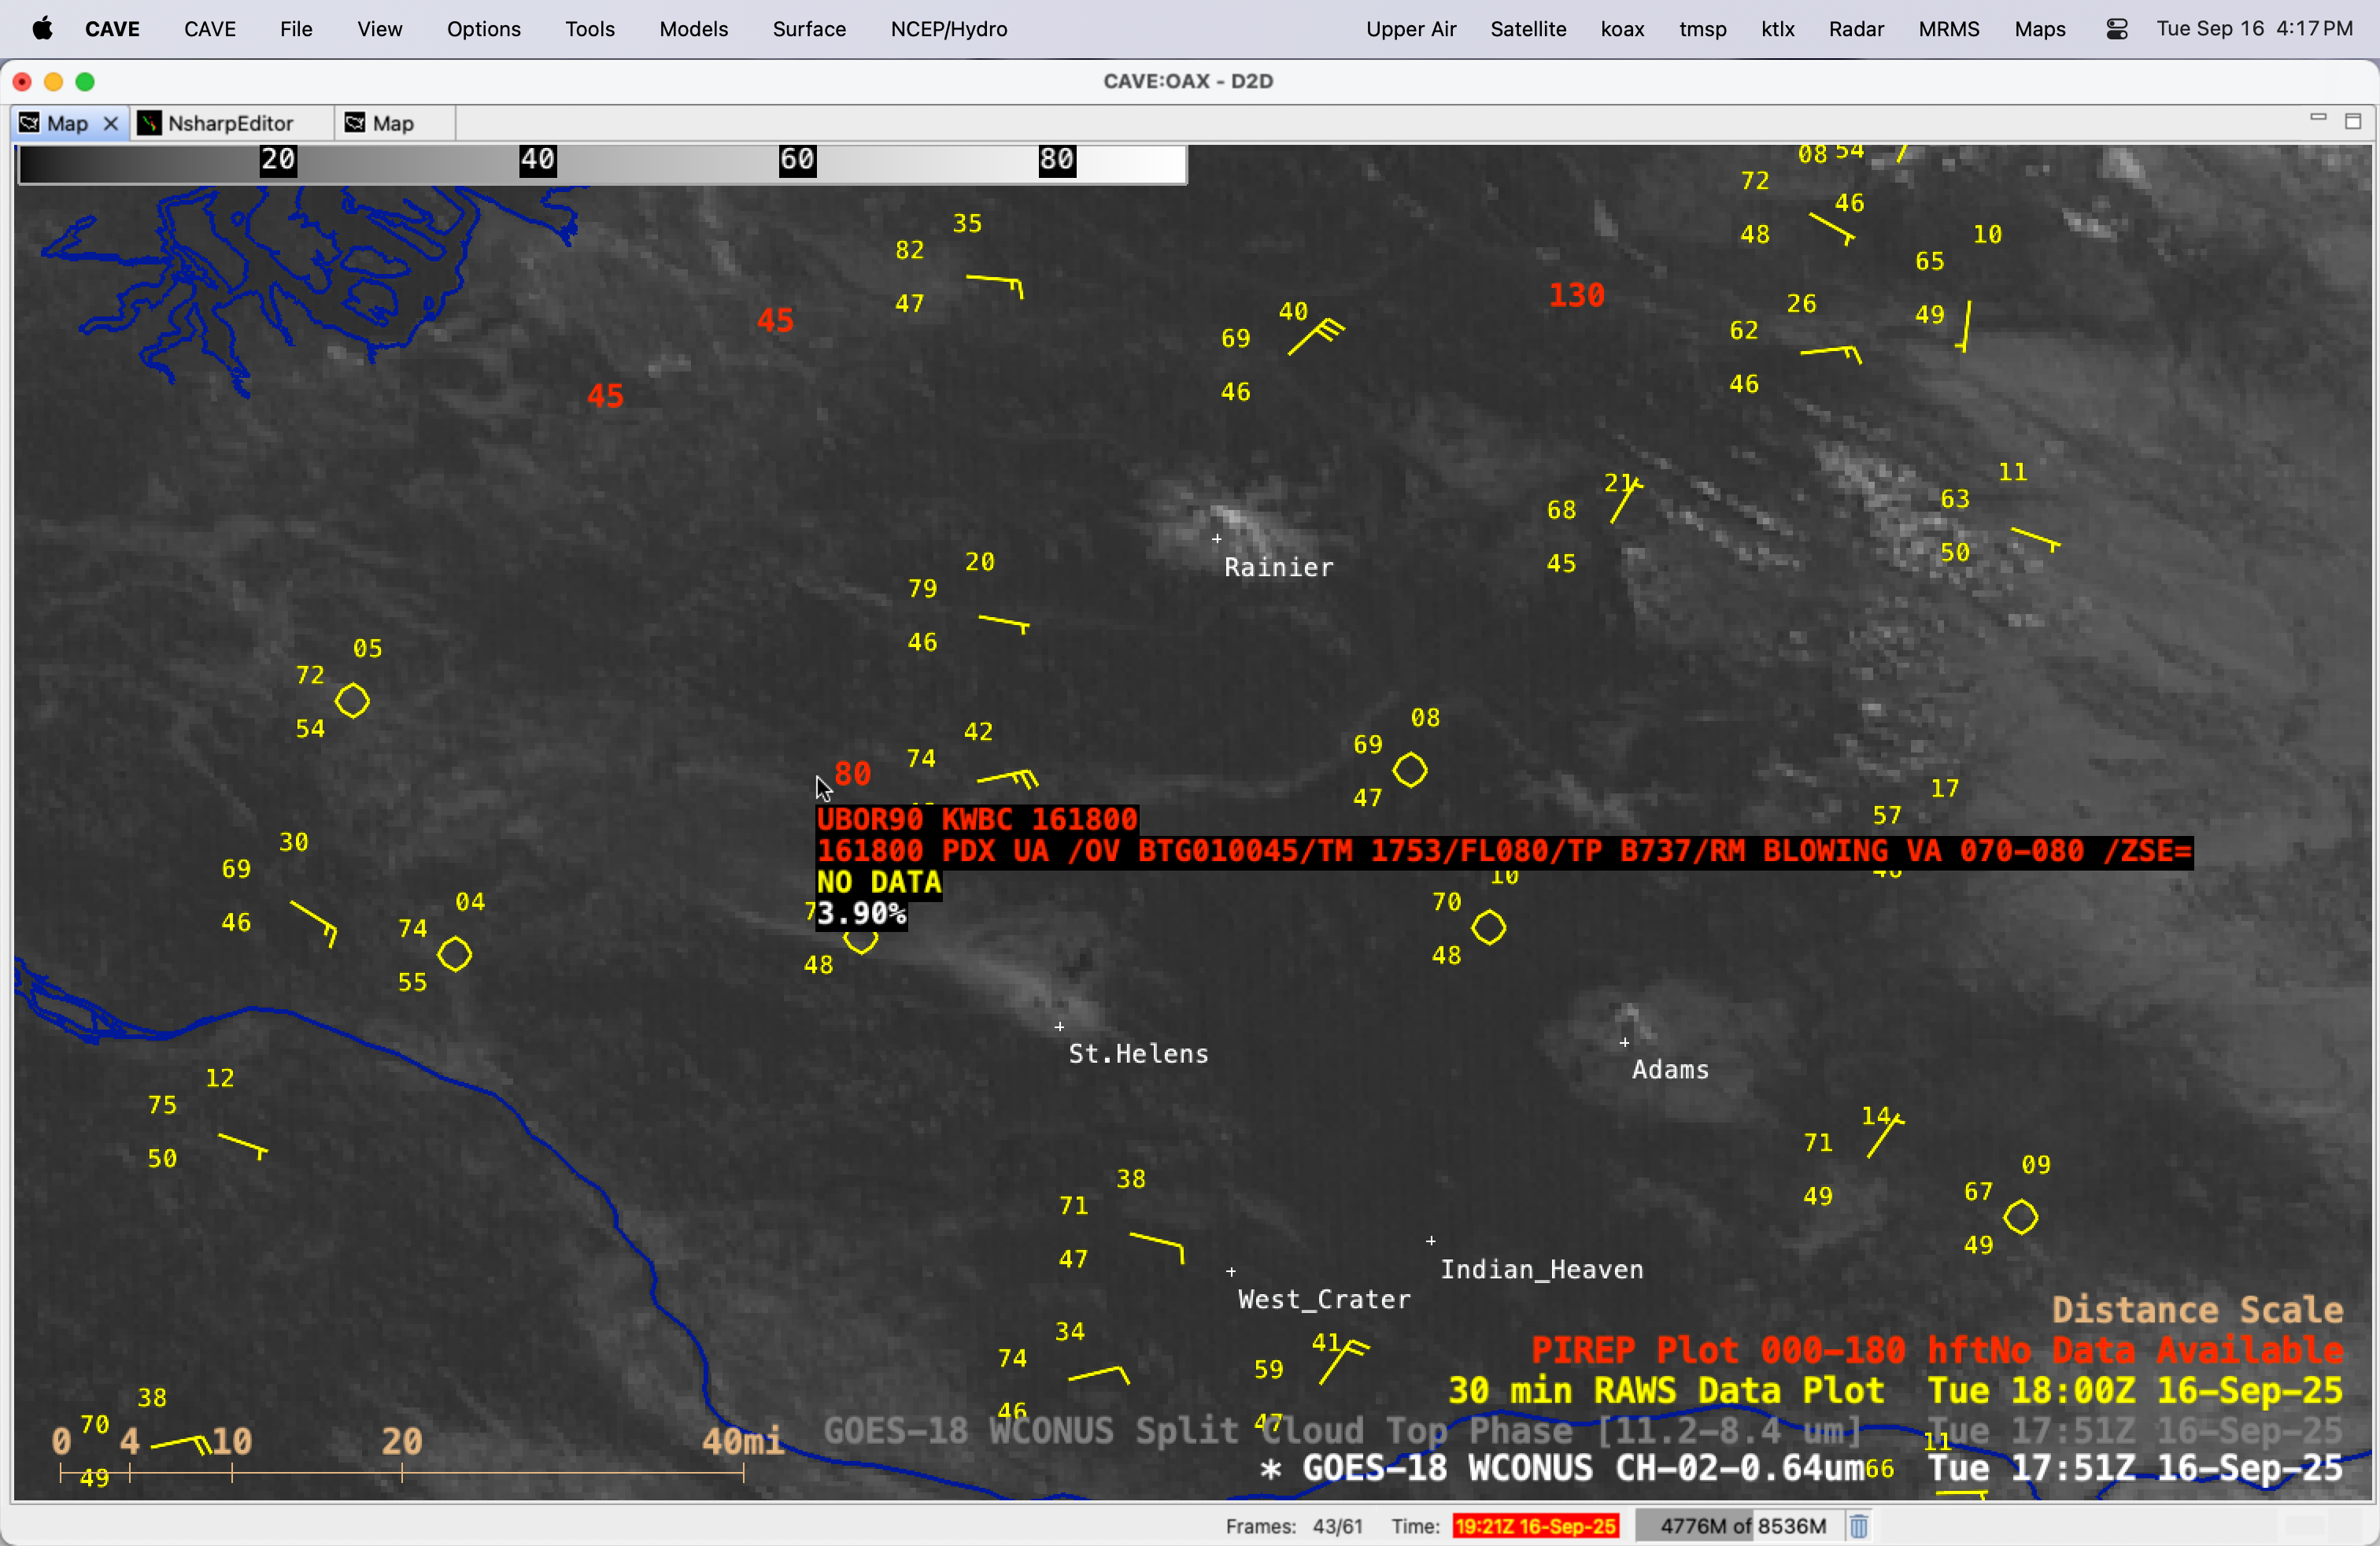
5-minute PACUS Sector GOES-18 (GOES-West) Visible images (above) showed the hazy signature of resuspended volcanic ash (remaining from the 1980 eruptions of Mount St. Helens) that was being lofted from the surface by strong east-southeast winds — which were gusting as high as 38-42 mph at nearby RAWS sites — and being... Read More
5-minute GOES-18 Visible images with plots of 30-minute RAWS surface observations (yellow) and intermittent Pilot Reports of volcanic ash (red), from 1421-1921 UTC on 16 September [click to play MP4 animation]
5-minute PACUS Sector GOES-18
(GOES-West) Visible images
(above) showed the hazy signature of resuspended volcanic ash (remaining from the
1980 eruptions of Mount St. Helens) that was being lofted from the surface by strong east-southeast winds — which were gusting as high as
38-42 mph at nearby
RAWS sites — and being transported west-northwestward on 16 September 2025. Pilot reports indicated that the resuspended ash was reaching altitudes of 10000 ft at
1610 UTC and 7000-8000 ft at
1753 UTC.
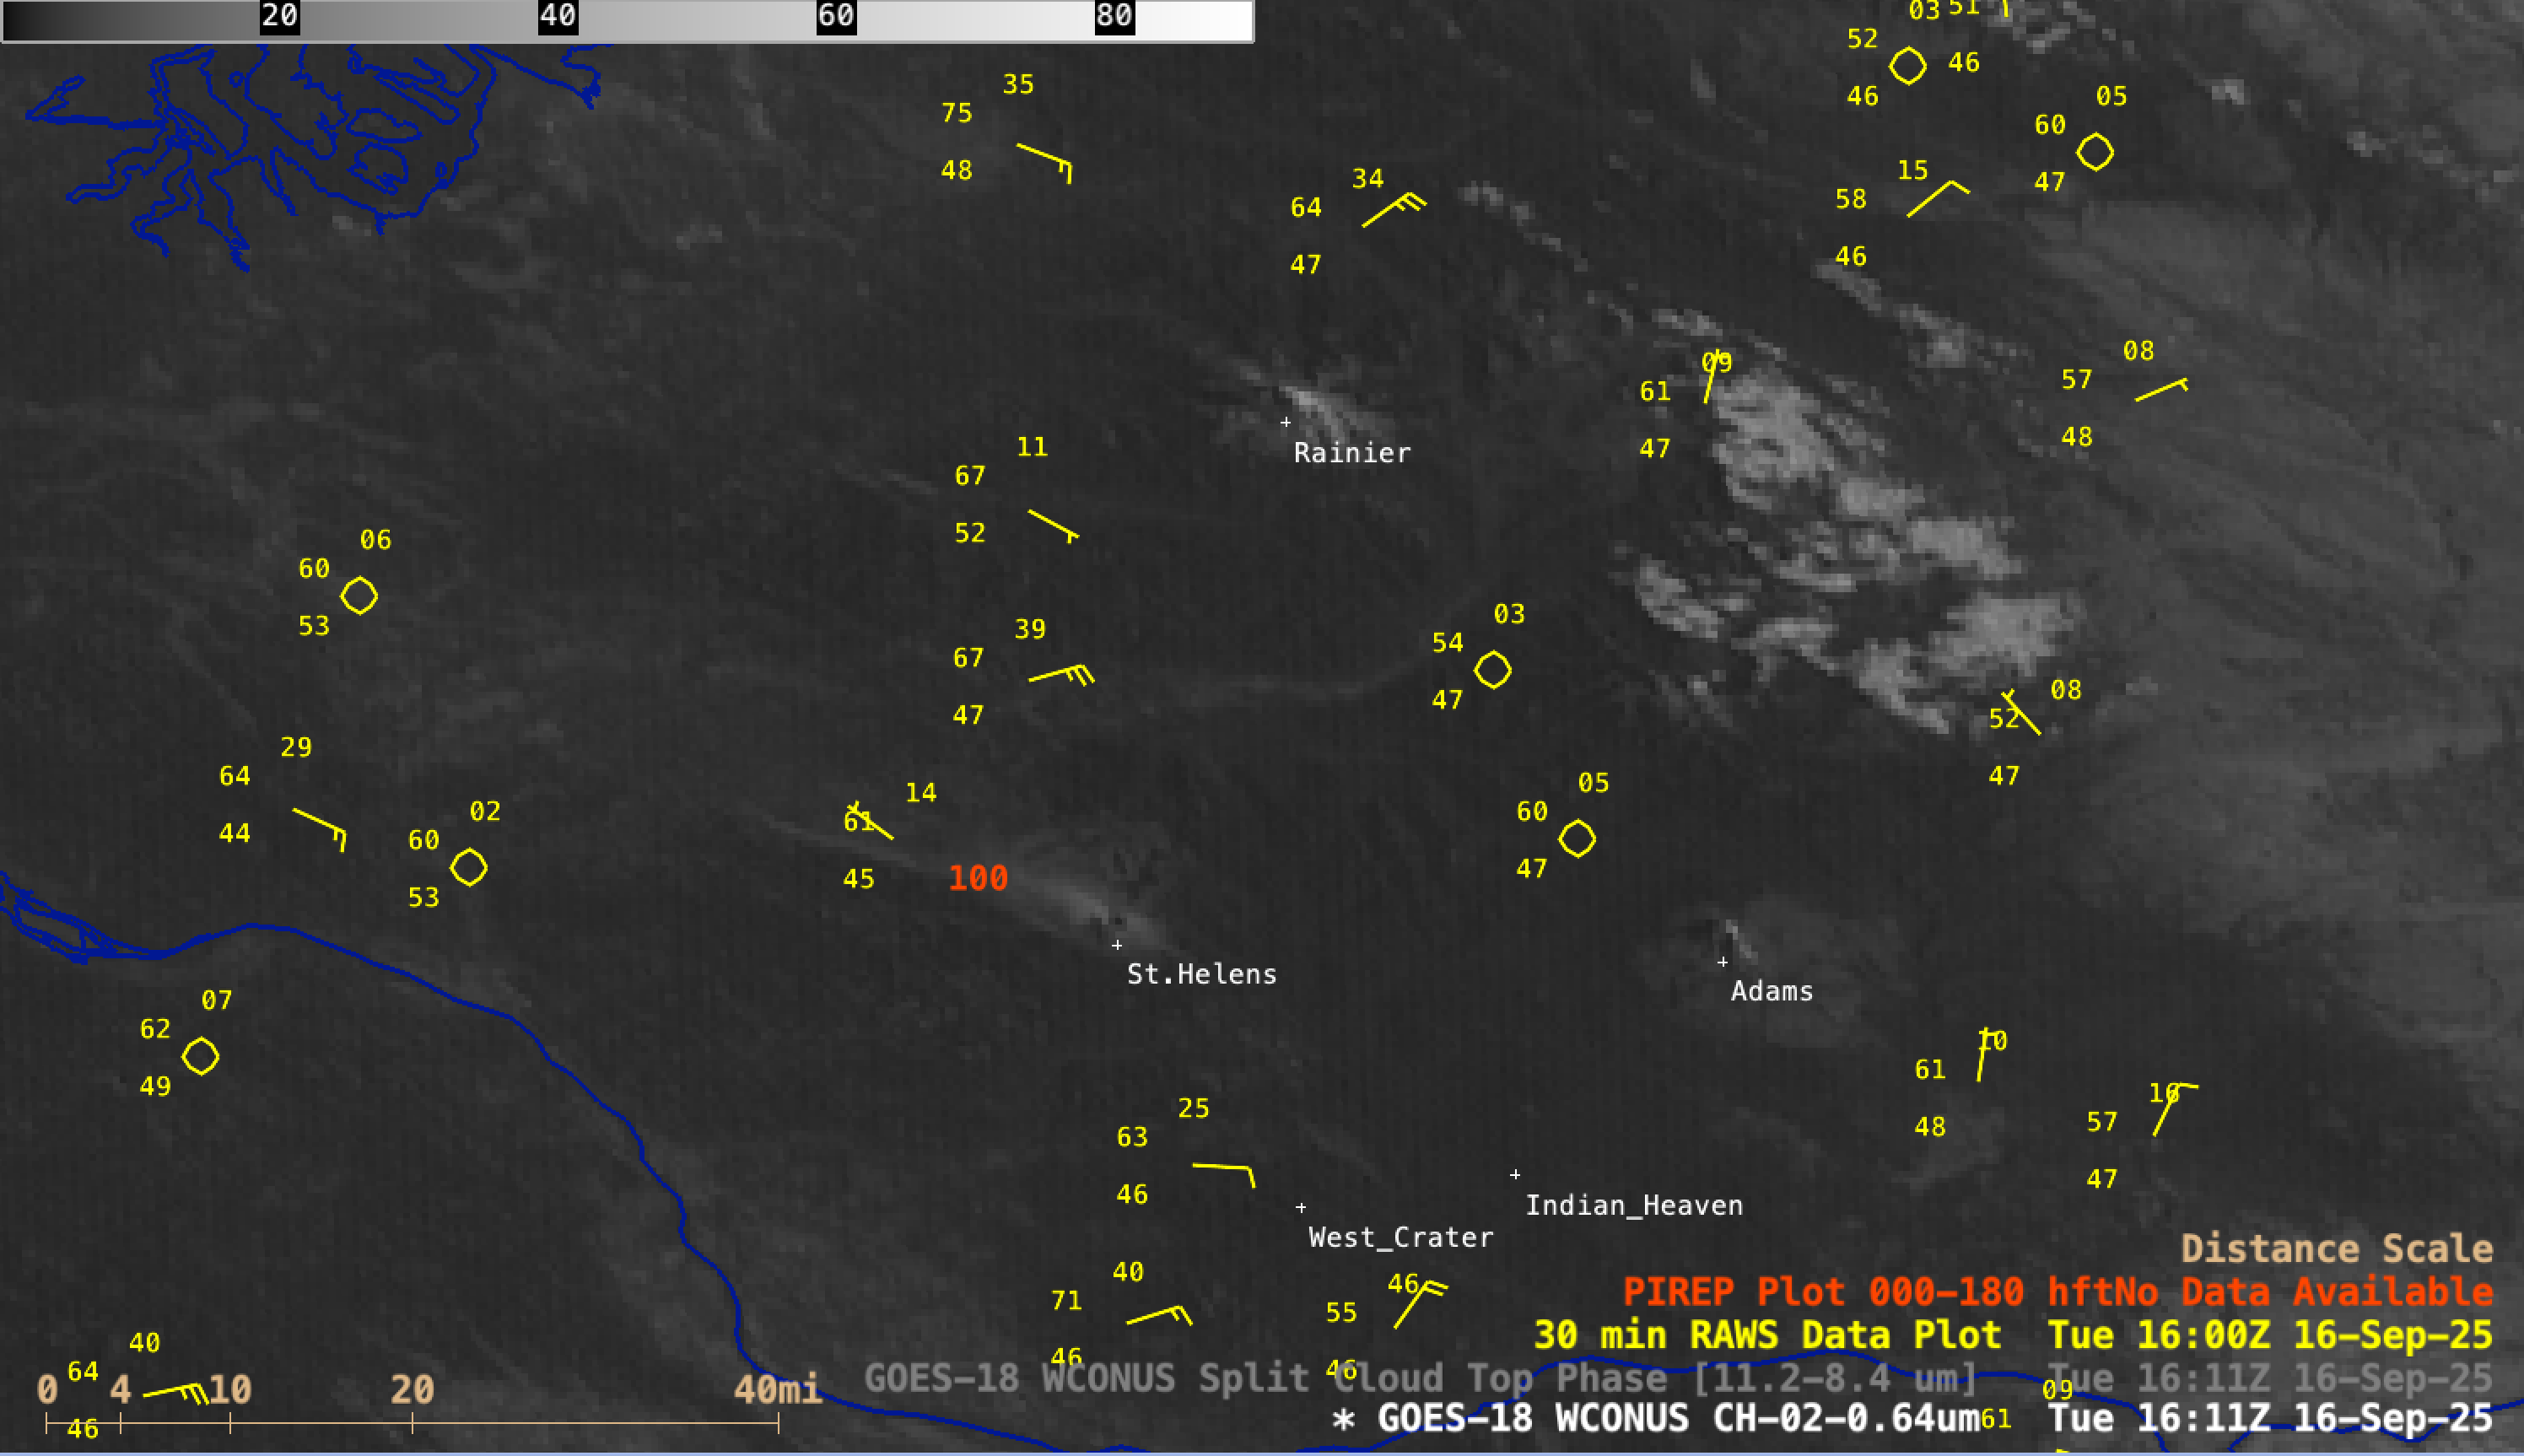
In the corresponding GOES-18 Split Cloud Top Phase brightness temperature difference images (below), the resuspended ash exhibited darker shades of blue.

5-minute GOES-18 Split Cloud Top Phase brightness temperature difference images with 30-minute plots of RAWS surface observations (yellow) and intermittent Pilot Reports of volcanic ash (red), from 1421-1921 UTC on 16 September [click to play MP4 animation]
_________________________
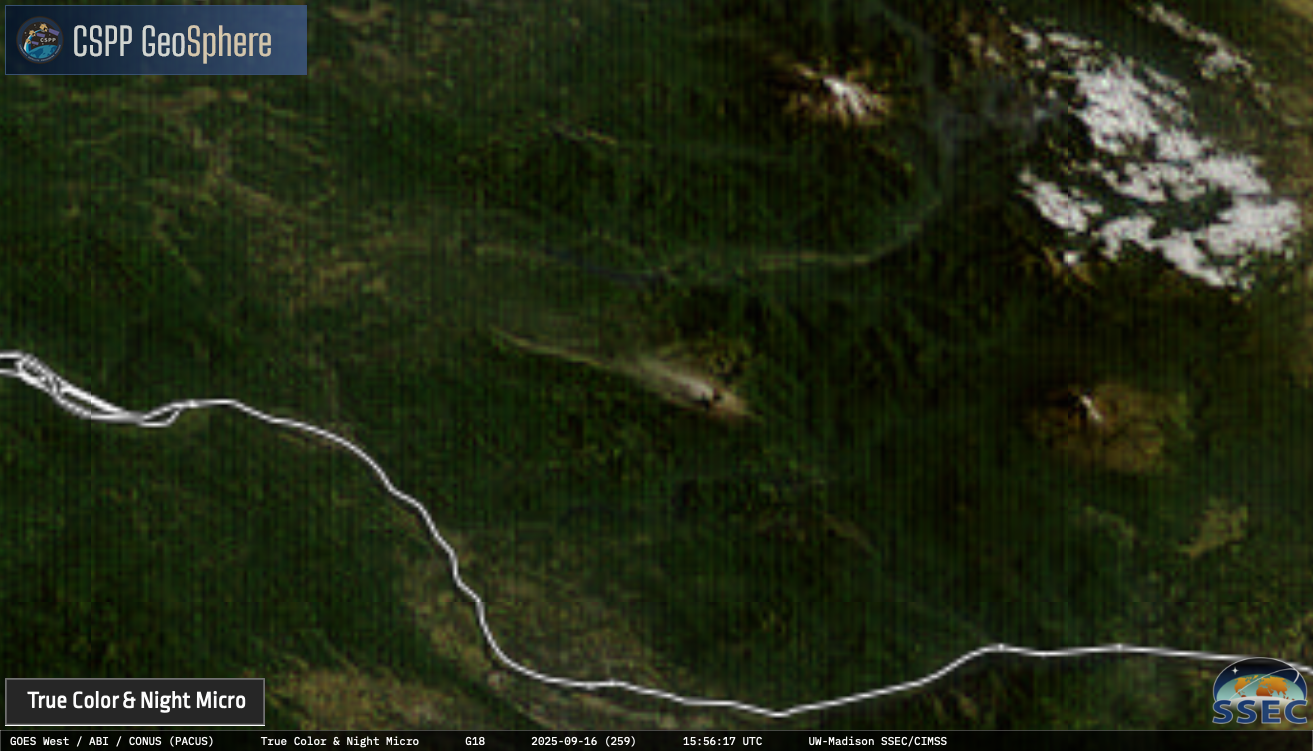
5-minute GOES-18 True Color RGB images, from 1421-2101 UTC on 16 September [click to play MP4 animation]
True Color RGB images (
source) from GOES-18
(above) provided good contrast between the hazy resuspended ash and the underlying vegetated landscape — and True Color RGB images from GOES-19
(GOES-East) (below) leveraged a more favorable forward scattering geometry later in the day to reveal that the transport of resuspended ash continued for a longer time period than was apparent in the GOES-18 imagery. The 2 sets of GOES True Color RGB images (both centered at Mount St. Helens) are displayed in the native projection of each satellite.

5-minute GOES-19 True Color RGB images, from 1541 UTC on 16 September to 0031 UTC on 17 September [click to play MP4 animation]
A side-by-side comparison of True Color RGB images from GOES-18 and GOES-19 — remapped to a common projection using
Geo2Grid (below) — similarly showed that the hazy signature of resuspended ash was more apparent later into the day in GOES-19 imagery, due to enhanced forward scattering associated with the GOES-East viewing angle.

True Color RGB images from GOES-18 (left) and GOES-19 (right), from 1411 UTC on 16 September to 0001 UTC on 17 September [click to play animated GIF | MP4]
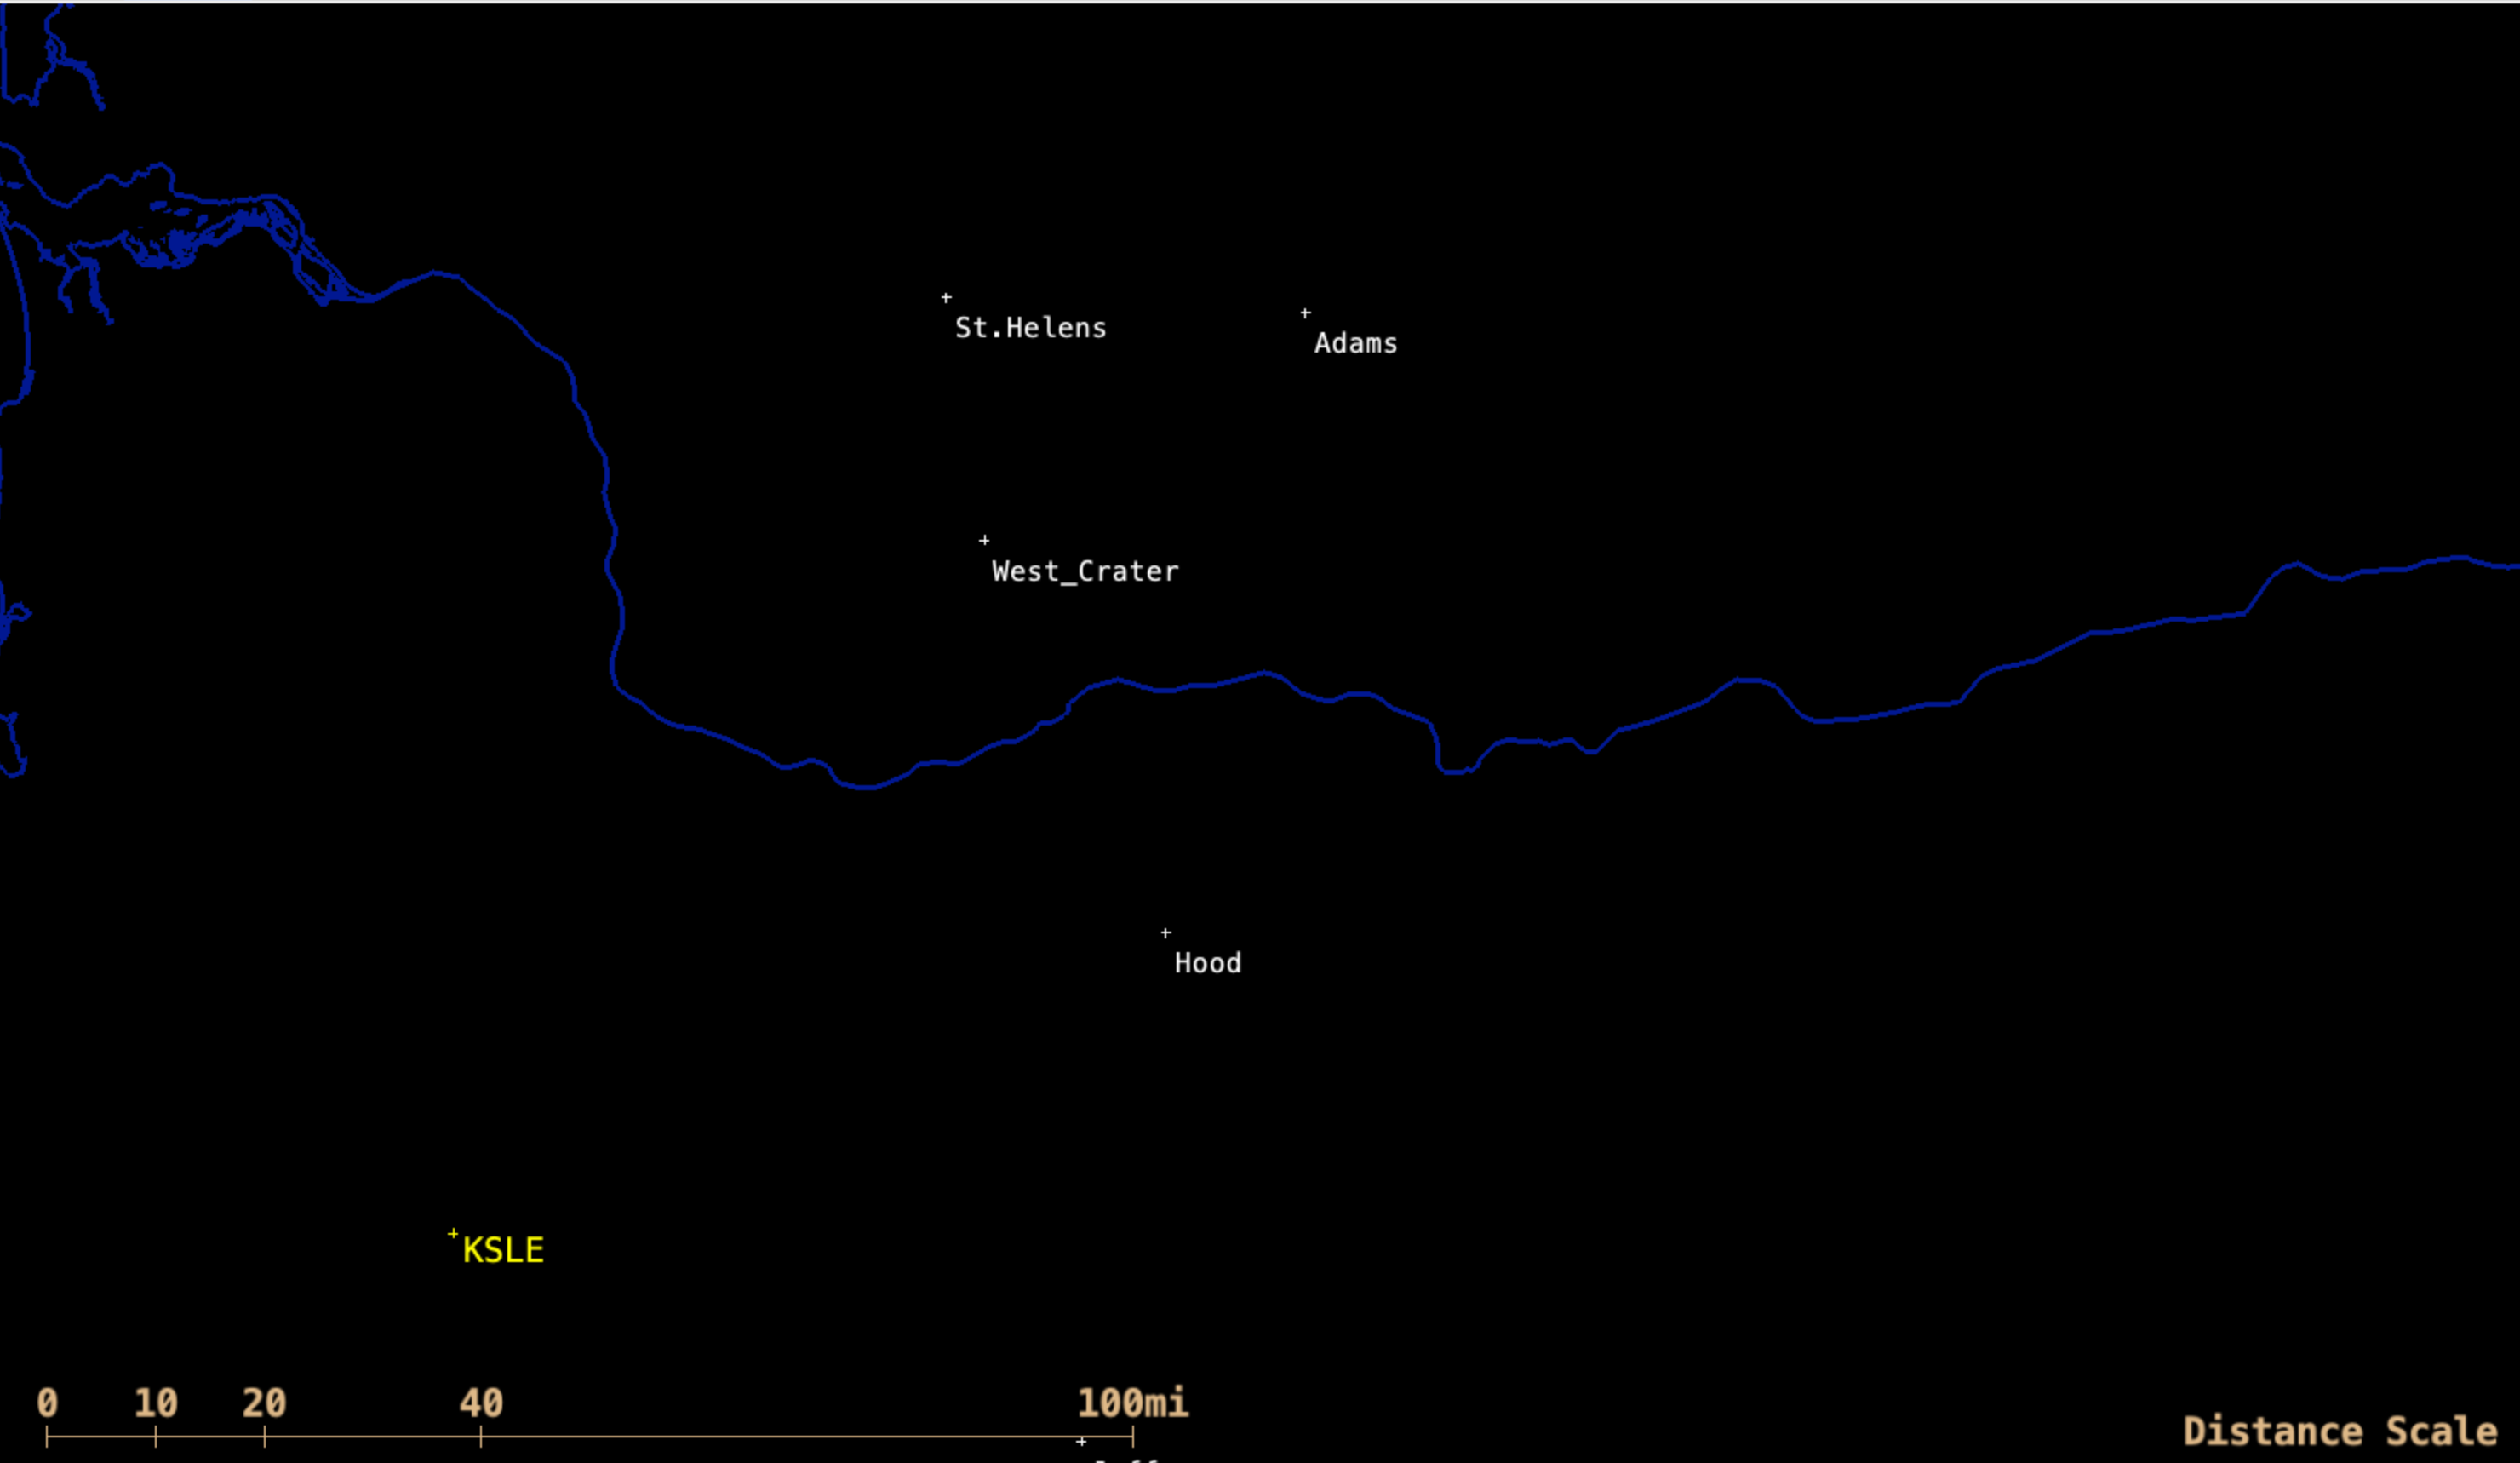
In a plot of rawinsonde data from Salem, Oregon
KSLE (below) note the transition from east-southeast winds below the 790 hPa (2.1 km) level to southerly winds between that and the 635 hPa (4 km) level — this change in wind direction influenced the transport of resuspended ash, carrying it more northward as the ash reached higher altitudes (which was apparent in the GOES True Color RGB images).

Plot of rawinsonde data from Salem, Oregon at 1200 UTC on 16 September [click to enlarge]
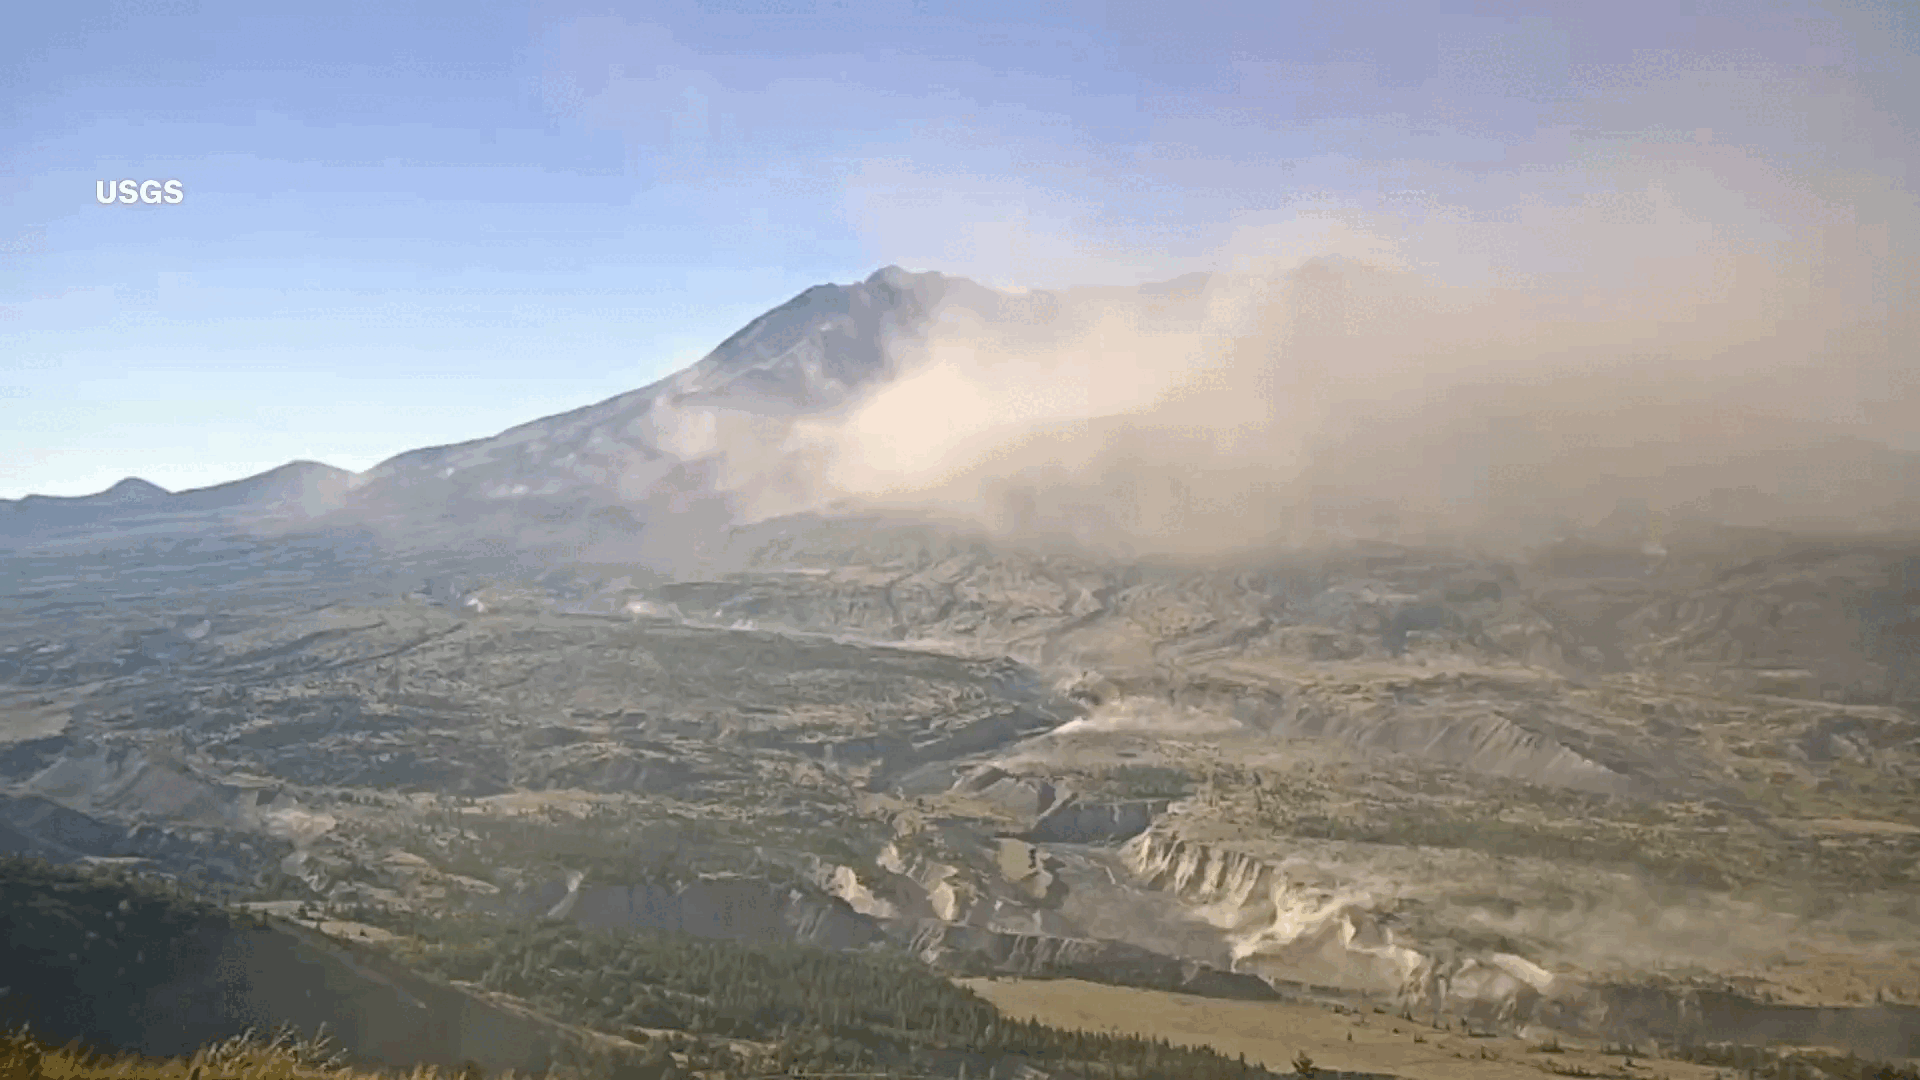
South-facing
USGS Johnston Ridge Observatory webcam images
(below) offered a ground-level view of the resuspended ash that was being lofted by strong winds on 16 September.

USGS Johnston Ridge Observatory webcam images of resuspended ash on 16 September [click to play animated GIF | MP4]
Resuspended ash from Mount St. Helens has also occurred with
strong westerly winds.
View only this post
Read Less


