
Loading map …
To celebrate the 50th anniversary of the GOES-A launch (GOES-A became GOES-1 on reaching geostationary orbit), this blog post contains one or two satellite animations (or images) for each of the 50 states. More on GOES-1 through GOES-19.
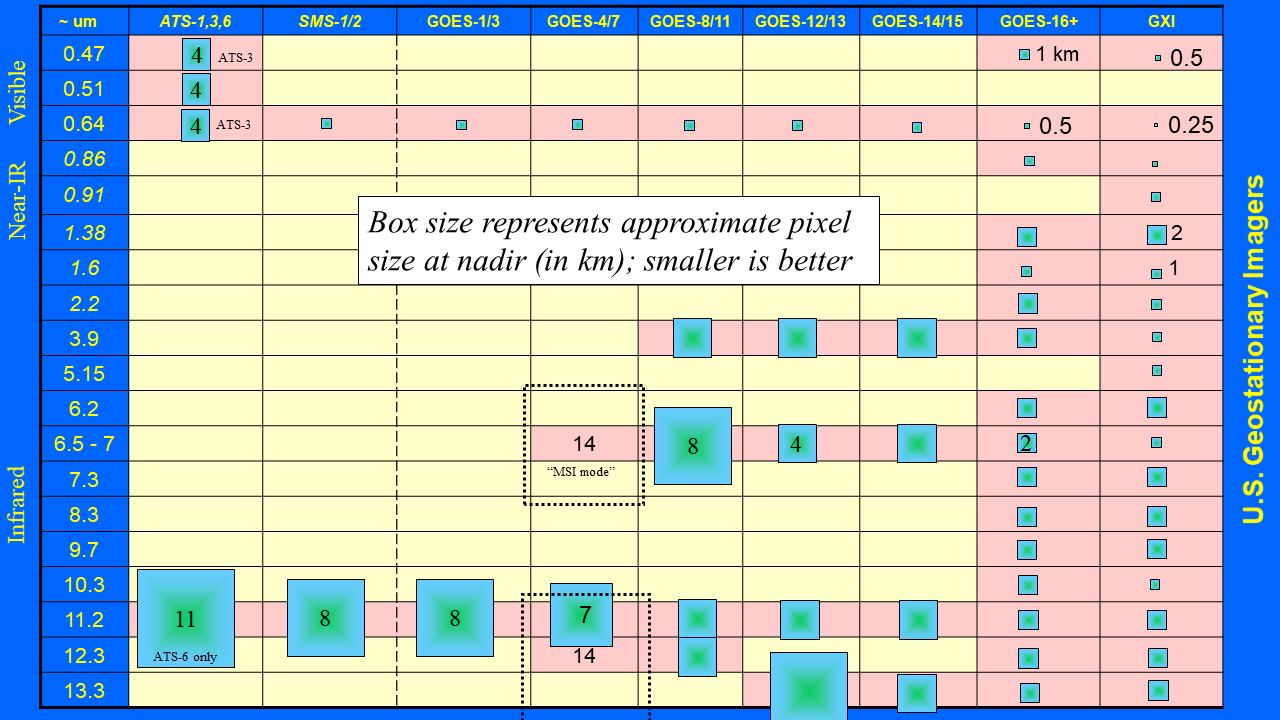
There were experimental geostationary imagers (ATS and SMS) that preceded the first GOES. In fact, what was going to be SMS-3 became GOES-1. Learn more about the the history of GOES in these book chapters (chapter 2 and chapter 1.05: Schmit, T.J., Goodman, S.J., Daniels, J., Rachmeler, L.A., 2026. GOES: Past, Present, and Future. In: Liang, S. (Ed.), Comprehensive Remote Sensing, vol. 1. Elsevier, pp. 126–166. https://dx.doi.org/10.1016/B978-0-443-13220-9.00051-2). More on the history of satellites.
Alabama
1-minute GOES-16 Infrared (IR) Window images of severe thunderstorms that produced an EF-3 tornado near Birmingham: https://cimss.ssec.wisc.edu/satellite-blog/images/2021/01/210125_goes16_infrared_spcStormReports_AL_anim.mp4 via https://cimss.ssec.wisc.edu/satellite-blog/archives/39747
Alaska
GOES-17 visible images showing the tidal motion of ice in Norton Sound: https://cimss.ssec.wisc.edu/satellite-blog/images/2022/02/NORTON_loop_GOES-17_2021149_160059_2021150_015949.mp4 via https://cimss.ssec.wisc.edu/satellite-blog/archives/40991
A low pressure system intensfying over the Gulf of Alaska, depicted by the GOES-17 water vapor band: https://cimss.ssec.wisc.edu/satellite-blog/images/2022/01/WV_PAC_loop_GOES-17_2022012_140032_2022013_130032_faster.mp4
Also see this resuspended volcanic ash example: https://cimss.ssec.wisc.edu/satellite-blog/archives/66940
Arizona
1-minute GOES-17 Fire Temperature RGB imagery of the Tunnel Fire: https://cimss.ssec.wisc.edu/satellite-blog/images/2022/04/Tunnel_GOES-17_Rad_fire_temperature_abi_2022109_160117_2022111_083035.mp4 via https://cimss.ssec.wisc.edu/satellite-blog/archives/45859
Arkansas
Severe thunderstorms with SPC Storm Reports plotted over 1-minute GOES-16 IR Window imagery: https://cimss.ssec.wisc.edu/satellite-blog/images/2022/04/220411_goes16_infrared_spcStormReports_AR_anim.mp4 via https://cimss.ssec.wisc.edu/satellite-blog/archives/45730
California
Smoke and thermal signatures of the County Fire as seen in the GOES-16 visible and shortwave infrared window bands: https://cimss.ssec.wisc.edu/satellite-blog/wp-content/uploads/sites/5/2018/07/180630_goes16_visible_shortwave_infrared_County_Fire_CA_anim.mp4 via https://cimss.ssec.wisc.edu/satellite-blog/archives/28722. Fog is also seen in the visible images, while the hottest shortwave IR pixels are colored in red.
Colorado
Snow cover shown in GOES-16 Visible images and the Land Surface Temperature derived product : https://cimss.ssec.wisc.edu/satellite-blog/images/2024/11/241111_g16_vis_lst_sfcTemp_CO_snow_cover.mp4 via https://cimss.ssec.wisc.edu/satellite-blog/archives/61705
Connecticut
GOES-16 Visible imagery of severe thunderstorms with SPC Storm Reports over-plotted: https://cimss.ssec.wisc.edu/satellite-blog/images/2021/11/211113_goes16_visible_spcStormReports_NJ_NY_CT_anim.mp4 via https://cimss.ssec.wisc.edu/satellite-blog/archives/43277
Delaware
Fog as shown in GOES-16 Cloud Thickness derived product and Visible imagery: https://cimss.ssec.wisc.edu/satellite-blog/images/2021/03/210323_goes16_cloudThickness_visible_East_Coast_anim.mp4 via https://cimss.ssec.wisc.edu/satellite-blog/archives/40373
Florida
Florida is home to Cape Canaveral, from where all GOES Satellites were launched. The ABI can be used to view rocket launches, as in this animation showing the GOES-T launch with special GOES-17 30-second Mesoscale Sector scans https://cimss.ssec.wisc.edu/satellite-blog/images/2022/02/800x800_AGOES17_B1_ZOOM_V2_30SEC_animated_2022060_213625_188_2022060_215455_188_X_redo.mp4 via https://cimss.ssec.wisc.edu/satellite-blog/archives/44902
Florida’s location in the tropics means that tropical cyclones frequently affect the state. Sometimes they make landfall in an area where previous storms have occurred, allowing interesting satellite comparisons such as this one between 2022’s Ian and 2004’s Charley: https://cimss.ssec.wisc.edu/satellite-blog/archives/48129. This kind of comparison between different storms has also been done near Jamaica, as shown in this blog post: https://cimss.ssec.wisc.edu/satellite-blog/archives/60196
GOES-R series routine 5-minute scanning allows for precise knowledge of fog‘s increase, as shown in this animation of the Nighttime Microphysics RGB. Note that surface observations show widespread fog in regions where the RGB doesn’t suggest fog (i.e., where the cyan color isn’t present). GOES-R IFR Probability fields, a product that combines satellite information with Rapid Refresh model estimates of low-level saturation, does indicate high probabilities of IFR conditions throughout the observed fog field.
Georgia
SPC Storm Reports plotted on 1-minute GOES-16 Visible imagery of severe thunderstorms: https://cimss.ssec.wisc.edu/satellite-blog/wp-content/uploads/sites/5/2019/03/190303_goes16_visible_spcStormReports_AL_GA_anim.mp4 via https://cimss.ssec.wisc.edu/satellite-blog/archives/32150
Hawaii
Derived multi-spectral Volcanic Ash Probability https://cimss.ssec.wisc.edu/satellite-blog/wp-content/uploads/sites/5/2022/11/GOES17AshProbability_0906_1301_28Nov_2022.gif (or https://cimss.ssec.wisc.edu/satellite-blog/images/2025/10/GOES17AshProbability_0906_1301_28Nov_2022.mp4) via https://cimss.ssec.wisc.edu/satellite-blog/archives/48881 Automated, multi-spectral derived products are key to be able to monitor such phenomena in realtime.
Also see GOES-18 imagery of the deadly Lahaina, Maui wildfire: https://cimss.ssec.wisc.edu/satellite-blog/images/2023/08/230808_230809_goes18_shortwaveInfrared_HI_anim.mp4
Idaho
Wildfire smoke as seen in this CIMSS True Color RGB imagery: https://cimss.ssec.wisc.edu/satellite-blog/images/2024/12/ID_GOES-17_RadC_cimss_true_color_2022252_140117_2022253_015617.mp4 via https://cimss.ssec.wisc.edu/satellite-blog/archives/47831
Illinois
GOES continuously monitors the Earth and its atmosphere. When something new and unexpected occurs, GOES imagery or products can help with situational awareness. Consider, for example, this Chemtool facility fire in northern Illinois in 2021. GOES-16 Near-Infrared imagery identified the (dark) smoke plume’s transport and areal extent. This was also a case where both GOES satellites (East and West) were useful; although GOES-East gave a better view of the smoke plume, that dense smoke plume masked the view of the fire thermal signature. GOES-West however had a continuous view of the fire and could be used to determine how the fire intensity might be changing in time. https://cimss.ssec.wisc.edu/satellite-blog/images/2021/06/GOES-16_RadC_C03_2021165_120000_2021165_192500.mp4 via https://cimss.ssec.wisc.edu/satellite-blog/archives/41094
Indiana
During arctic outbreaks, northwest Indiana frequently experiences lake effect snow bands. Multi-spectral RGB imagery from GOES-East can highlight which cloud bands are most likely to produce heavy snow. GOES-16 Cloud Phase Distinction RGB images: https://cimss.ssec.wisc.edu/satellite-blog/images/2024/01/MI_GOES-16_RadC_cloud_phase_distinction_2024019_140117_2024019_220117.mp4 via https://cimss.ssec.wisc.edu/satellite-blog/archives/56535
Aircraft “hole punch” (or cavum) clouds https://cimss.ssec.wisc.edu/satellite-blog/wp-content/uploads/sites/5/2017/12/171221_goes16_visible_snow-ice_IL_IN_hole_punch_clouds_anim.mp4 via https://cimss.ssec.wisc.edu/satellite-blog/archives/26446 GOES Visible imagery is on the top panel, while Near-IR Snow/Ice imagery is on the bottom panel.
Iowa
One of the most powerful derechos of the 2020s formed over western Iowa on 10 August 2020 and then moved eastward (Here’s a summary from the Quad Cities NWS; Cedar Rapids was particularly hard-hit; WFO IND noted the anniversary). A CIMSS Satellite Blog post: https://cimss.ssec.wisc.edu/satellite-blog/archives/37938 includes 1-minute imagery and plots of SPC Storm Reports of the system as it crossed Iowa. https://cimss.ssec.wisc.edu/satellite-blog/images/2020/08/200810_goes16_visible_spcStormReports_Midwest_Derecho_anim.mp4
Here is an animated gif version of the above animation. There are several other CIMSS Satellite Blog posts on Derechos.
Kansas
In addition to severe severe thunderstorms, the Spring season will often bring agricultural burning that can be monitored very closely from GOES, as shown in this blog post. These agricultural burns can also show up in the Next Generation Fire System events dashboard here.
Severe thunderstorms: https://cimss.ssec.wisc.edu/satellite-blog/images/2024/05/240519_goes16_visibleInfraredSandwichRGB_localStormReports_KS_2_anim.mp4 via https://cimss.ssec.wisc.edu/satellite-blog/archives/59341
Kentucky
Thunderstorms that produced heavy rainfall and flooding in July 2022, as seen by GOES-16: https://cimss.ssec.wisc.edu/satellite-blog/images/2022/07/220727_220728_goes16_infrared_surfacePlots_KY_flooding_anim.mp4 via https://cimss.ssec.wisc.edu/satellite-blog/archives/47406
A river valley fog example: https://cimss.ssec.wisc.edu/satellite-blog/archives/42165
Louisiana
Hurricane Katrina in August of 2005, as seen by GOES-12: https://cimss.ssec.wisc.edu/satellite-blog/images/2024/12/logoLL_logoLR_GOES12_Katrina_loop_GOES-12_2005235_001500_2005242_034500.mp4 via https://cimss.ssec.wisc.edu/satellite-blog/archives/19402
Maine
Wildfire smoke as seen in two of the GOES-16 spectral bands — Visible and Near-Infrared Cirrus: https://cimss.ssec.wisc.edu/satellite-blog/wp-content/uploads/sites/5/2017/08/170817_goes16_visible_cirrus_Canadian_smoke_anim.mp4 (Preliminary, Non-operational) via https://cimss.ssec.wisc.edu/satellite-blog/archives/24736
Maryland
Winter storm via the GOES-16 Cloud Type RGB: https://cimss.ssec.wisc.edu/satellite-blog/images/2024/02/240213_goes16_dayCloudTypeRGB_Northeast_US_snow_cover_anim.mp4 via https://cimss.ssec.wisc.edu/satellite-blog/archives/57171
Massachusetts
GOES-16 Set of Nor’ Easters: https://cimss.ssec.wisc.edu/goes/abi/youtube/loops/20_1080x1920_AGOES16_B1_SHCS_FD_FOUREASTER_2018_loop_59s.mp4
Michigan
Bore over Lake Superior in GOES-16 Visible imagery: https://cimss.ssec.wisc.edu/satellite-blog/images/2024/12/RedVisLakeSuperiorFog-20170710_101218_194718anim.mp4 via https://cimss.ssec.wisc.edu/satellite-blog/archives/24420
Minnesota
The GOES-R series routine 5-minute scanning allowed for timely monitoring of snow melt over southwest Minnesota in early December 2021, as shown in the animation below — see this CIMSS Satellite Blog post. The animation shows Band 2 (Visible, 0.64 µm), True Color RGB imagery, the Day Cloud Phase Distinction RGB, and the Day Snow/Fog RGB. You can view the mp4 below, or an animated gif.
Blowing snow example: https://cimss.ssec.wisc.edu/satellite-blog/images/2024/12/GOES-19_RadC_blowing_snow_2024339_142117_2024339_220117.gif via https://cimss.ssec.wisc.edu/satellite-blog/archives/61934
Mississippi
Severe thunderstorms https://cimss.ssec.wisc.edu/satellite-blog/images/2024/04/240410_goes16_visible_spcStormReports_TX_LA_MS_AL_anim.mp4 via https://cimss.ssec.wisc.edu/satellite-blog/archives/58370
Missouri
Severe convection as seen by 1-minute Mesoscale Sector GOES-16 Visible and Infrared imagery: https://cimss.ssec.wisc.edu/satellite-blog/images/2023/05/230506_goes16_visible_infrared_localStormReports_MO_anim.mp4 via https://cimss.ssec.wisc.edu/satellite-blog/archives/52201
Montana
30-second GOES-18 Visible imagery of severe thunderstorms https://cimss.ssec.wisc.edu/satellite-blog/images/2022/07/220709_goes18_visible_spcStormReports_MT_anim.mp4 via https://cimss.ssec.wisc.edu/satellite-blog/archives/47146
Nebraska
Haboob over Nebraska in May 2022 https://cimss.ssec.wisc.edu/satellite-blog/images/2024/12/NE_GOES-16_RadC_cimss_true_color_2022132_150117_2022132_235617.mp4 via https://cimss.ssec.wisc.edu/satellite-blog/archives/46385
Nevada
Cherrywood Fire from May 2021 as seen by GOES-17 in 4-panels: https://cimss.ssec.wisc.edu/satellite-blog/images/2021/05/210520_goes17_shortwaveInfrared_visible_goes16_firePower_fireTemperature_Cherrywood_Fire_NV_anim.mp4 via https://cimss.ssec.wisc.edu/satellite-blog/archives/40926
New Hampshire
Mountain waves and banner clouds in October 2018 as seen by GOES-16: https://cimss.ssec.wisc.edu/satellite-blog/wp-content/uploads/sites/5/2018/10/181025_goes16_waterVapor_Northeast_US_anim.mp4 via https://cimss.ssec.wisc.edu/satellite-blog/archives/30441
New Jersey
Special (research) GOES-14 Super Storm Sandy in 2012: https://cimss.ssec.wisc.edu/satellite-blog/images/2024/12/logos_GOES14_SRSOR_B1_2012299_174500_2012304_224500_UTC.mp4 More on Hurricane Sandy and SRSOR imagery which was used to prepare users for the eventual routine GOES-R ABI 1-minute imagery.
New Mexico
GOES data are helpful in identifying regions of blowing dust that can occur either with strong low pressure systems or with thunderstorm outflow. For example, this GOES-18 animation (https://cimss.ssec.wisc.edu/satellite-blog/images/2024/06/Haboob_GOES-18_RadM1_cimss_true_color_night_dust_2024171_210030_2024172_035927.mp4) shows dust caused by a thunderstorm downdraft moving westward across New Mexico (for more information, see this CIMSS Satellite Blog post: https://cimss.ssec.wisc.edu/satellite-blog/archives/60275 .
This CIMSS Satellite Blog post (https://cimss.ssec.wisc.edu/satellite-blog/archives/64237 ) shows dust moving northeastward across New Mexico in response to the circulation around a strong low pressure system. Here’s the animation: https://cimss.ssec.wisc.edu/satellite-blog/images/2025/04/250417_goes19_trueColorRGB_dustRGB_NM_TX_blowing_dust_anim.mp4
New York
A heavy rain event over NYC in September 2023: https://cimss.ssec.wisc.edu/satellite-blog/archives/54772 that was also a Forecast Decision Training Division (FDTD) Webinar ( https://rammb2.cira.colostate.edu/training/visit/satellite_webinar/fdtd_webinar/2024-01-10/ and https://www.youtube.com/watch?v=8v9qUynltyc ) as well as a Satellite Book Club presentation (https://www.youtube.com/watch?v=KuO-xsy3S-s&list=PLJzZC8w9vPV1NSHVBtMqOEP0VxlDmh5WA&index=61).
An example of river valley fog and snow cover is shown above: https://cimss.ssec.wisc.edu/satellite-blog/wp-content/uploads/sites/5/2018/04/180501_goes16_visible_snow_ice_NY_Catskills_anim.mp4 via https://cimss.ssec.wisc.edu/satellite-blog/archives/27893
North Carolina
Tropical Storm Ophelia in September 2023: https://cimss.ssec.wisc.edu/satellite-blog/images/2023/09/230922_goes16_visible_infared_TS_Ophelia_anim.mp4 via https://cimss.ssec.wisc.edu/satellite-blog/archives/54632
North Dakota
An annual possibility along North Dakota’s eastern border is flooding from the Red River of the North. Satellite information is vital to monitor such inundations. Combined ABI/VIIRS products (available at this website) allow for the monitoring, as shown here: https://cimss.ssec.wisc.edu/satellite-blog/archives/45947 ; SAR data can also be used for very high-spatial resolution flood monitoring: https://cimss.ssec.wisc.edu/satellite-blog/archives/46140 . Multi-spectral data are very important when monitoring floods, especially observations at 0.87 and/or 1.61 micrometers (an early example with MODIS data: https://cimss.ssec.wisc.edu/satellite-blog/archives/7894).
Light snow from lake effect clouds as seen in GOES-19 Day Cloud Phase Distinction RGB imagery: https://cimss.ssec.wisc.edu/satellite-blog/images/2024/11/241125_goes19_dayCloudPhaseDistinctionRGB_ND_lake_effect_clouds_anim.mp4 via https://cimss.ssec.wisc.edu/satellite-blog/archives/61872
Satellite observations of blowing snow in very cold airmasses (when visibility restrictions from blowing snow can rapidly become life-threatening) are very important over North Dakota — one example is shown in this CIMSS Satellite Blog post: https://cimss.ssec.wisc.edu/satellite-blog/archives/44612 ; Note that for this case, Blizzard Warnings were modified based on the Satellite Observations, as detailed in this Satellite Liaison Blog post: https://satelliteliaisonblog.wordpress.com/2022/02/11/more-northern-plains-blowing-snow/
Ohio
Cleveland is an active port on Lake Erie. GOES data can be used to monitor ship tracks as they move through lake ice, as shown in the animation (https://cimss.ssec.wisc.edu/satellite-blog/images/2022/02/220215_goes16_visible_Lake_Erie_ship_track_anim.mp4“), from this blog post: https://cimss.ssec.wisc.edu/satellite-blog/archives/44646“.
Oklahoma
Grass fires (hottest pixels colored red to yellow) and smoke plumes https://cimss.ssec.wisc.edu/goes/abi/youtube/loops/17_ABI_BAND7_13_FIRE_COMBO_OK_loop_2017065_170029_2017066_045929_fast.mp4 via https://cimss.ssec.wisc.edu/satellite-blog/archives/23297
Oregon
Wildfire smoke as seen in CIMSS True Color RGB imagery: https://cimss.ssec.wisc.edu/satellite-blog/images/2024/12/OR_GOES-17_RadC_cimss_true_color_2022252_140117_2022253_015617.mp4 via https://cimss.ssec.wisc.edu/satellite-blog/archives/47831
Pennsylvania
Pennsylvania’s many river-filled valleys are common areas for fog development. The high temporal resolution of GOES-R (as shown in the animation below from a special observing session with GOES-14) means you can observe the dissipation to the closest minute.
https://cimss.ssec.wisc.edu/satellite-blog/wp-content/uploads/sites/5/2014/08/GOES14_VIS_18August2014loop.gif as in this blog post.
Snow squalls https://cimss.ssec.wisc.edu/satellite-blog/images/2022/02/220219_goes16_dayCloudPhaseDistinctionRGB_PA_snow_squalls_anim.mp4 via https://cimss.ssec.wisc.edu/satellite-blog/archives/44742
Also see: https://cimss.ssec.wisc.edu/satellite-blog/archives/45461
Rhode Island
This animation https://www.ssec.wisc.edu/~scottl/data/GOES-16_ABI_RadC_C02_20210607_1501_to_2356_RhodeTLanim.gif (See more at this blog post https://cimss.ssec.wisc.edu/satellite-blog/archives/41031) shows the evolution of fog moving over Block Island. Of particular note, especially to sailors, is the development of overlapping waves downwind of Block Island. Note also how this imagery can be used to pinpoint where over southern Rhode Island beaches you might be disappointed by the weather on this day! Snow during a Nor’easter: https://cimss.ssec.wisc.edu/satellite-blog/images/2020/12/201216_201217_goes16_waterVapor_Noreaster_anim.mp4 via https://cimss.ssec.wisc.edu/satellite-blog/archives/39306
South Carolina
South Carolina was visited by a swarm of tornadoes before sunrise on 13 April 2020 (SPC Storm Reports) as a strong cold front moved through the state. The animation below shows GOES-16 Mesoscale Sector 1-minute imagery. Most of the tornadoes occurred between 0900 and 1000 UTC. A large-scale view of this system is shown below. The forecast office in Columbia (WFO CAE) published a Storyboard on this event.
South Dakota
“River effect” clouds during an arctic outbreak: https://cimss.ssec.wisc.edu/satellite-blog/images/2024/01/240113_goes16_daySnowFogRGB_SD_river_effect_snow_anim.mp4 via https://cimss.ssec.wisc.edu/satellite-blog/archives/56436
Tennessee
GOES-16 Visible and Infrared images (with GLM lightning observations) of severe thunderstorms https://cimss.ssec.wisc.edu/satellite-blog/images/2024/05/240508_goes16_visible_infrared_glmFlashExtentDensity_warningPolygons_TN_anim.mp4 via https://cimss.ssec.wisc.edu/satellite-blog/archives/59059
Texas
West Texas can be a prime wildfire environment, and GOES-R’s fine temporal scanning abilities allows for precise monitoring of the evolution of fires. That kind of information is vital to ensure the safety of those responding to the fire. An excellent example is the Smokehouse Creek fire in 2024: https://cimss.ssec.wisc.edu/satellite-blog/archives/57431, the largest fire in areal extent in Texas history; it burned more than 1600 square miles, an area larger than the state of Rhode Island.
Texas has a long Gulf coastline, and tropical cyclones are a common occurrence. Hurricane Harvey, in 2017, was an early example of a tropical system being monitored with Geostationary Lightning Mapper data, as shown in this blog post: https://cimss.ssec.wisc.edu/satellite-blog/archives/24841 . Harvey’s effects on SE Texas were also monitored via VIIRS’ Day Night Band sensor on Suomi-NPP: https://cimss.ssec.wisc.edu/satellite-blog/archives/24924. A similar Day Night Band comparison with Hurricane Beryl in 2024 is shown in this National Weather Association short course: https://rammb2.cira.colostate.edu/training/2024-nwa-satellite-workshop/
GOES-16 images showing splitting convection in 2018: https://cimss.ssec.wisc.edu/goes/abi/youtube/loops/04_ABI_BAND2_SPLIT_loop_2018084_200104_2018085_012904_17s.mp4
Utah
30-second imagery from GOES-17, to monitor the development of convection during a radar outage: https://cimss.ssec.wisc.edu/satellite-blog/images/2022/06/220623_goes17_visible_UT_CO_KGJT_radar_outage_anim.mp4 via https://cimss.ssec.wisc.edu/satellite-blog/archives/46981
Vermont
Wave clouds and snow squalls https://cimss.ssec.wisc.edu/satellite-blog/images/2024/12/VT_GOES-16_RadC_cloud_phase_distinction_2022058_123117_2022058_222617.mp4 via https://cimss.ssec.wisc.edu/satellite-blog/archives/44873
Virginia
Rocket Plume and Shadow https://cimss.ssec.wisc.edu/satellite-blog/wp-content/uploads/sites/5/2019/11/WALLOPS_Vis_loop.mp4 via https://cimss.ssec.wisc.edu/satellite-blog/archives/34945
Washington
Preliminary, Non-operational GOES-16 Fog advection https://cimss.ssec.wisc.edu/satellite-blog/images/2024/12/Fog_GOES-16_RadC_day_snow_fog_2017140_173207_2017141_032707.mp4 via https://cimss.ssec.wisc.edu/satellite-blog/archives/23981
West Virginia
Snow cover https://cimss.ssec.wisc.edu/satellite-blog/images/2021/01/210128_goes16_visible_daySnowFogRGB_dayCloudPhaseDistinctionRGB_VA_NC_snow_cover_anim.mp4 via https://cimss.ssec.wisc.edu/satellite-blog/archives/39766
Wisconsin
GOES data continuously monitors the evolution of the atmosphere, and machine learning tools have been developed (at CIMSS, CIRA and elsewhere) to help forecasters (in the National Weather Service and elsewhere) anticipate the development of lightning. One of the more important channels that fosters the ability of satellite data to anticipate lightning is GOES-R’s Band 5 (that is, observations at 1.61) that can highlight phase changes during the day based on changes in reflectivity from clouds made up of water droplets vs. clouds made up of ice crystals. Both the Day Cloud Phase Distinction and Day Cloud Type RGBs include band 5 for that reason. LightningCast probabilities, plotted below on top of Day Cloud Phase Distinction RGB imagery, shows a slow increase in lightning possibilities in advance of a GLM observation at the end of the animation (See more, including this animated gif https://cimss.ssec.wisc.edu/satellite-blog/wp-content/uploads/sites/5/2024/07/G16DCPD_LtgCast_GLMFED-20240716_1616_to_1931anim.gif at this CIMSS satellite blog post https://cimss.ssec.wisc.edu/satellite-blog/archives/60337 )
In 2018, fire at a refinery in Superior Wisconsin was captured by GOES-East (and JPSS) satellite imagery. GOES imagery allows Emergency Managers to determine where any evacuations might have to occur. A CIMSS Satellite Blog post on this event is here: https://cimss.ssec.wisc.edu/satellite-blog/archives/27868. The response of WFO Duluth to this event was discussed at the FDTD Satellite Applications webinar here https://rammb2.cira.colostate.edu/training/visit/satellite_webinar/fdtd_webinar/2019-07-17/ and on YouTube here: https://www.youtube.com/watch?v=h4BImH-zJio
Wyoming
Hail Swath produced by a severe thunderstom: https://cimss.ssec.wisc.edu/satellite-blog/images/2023/07/230711_goes16_nighttimeMicrophysicsRGB_WY_SD_anim.mp4 via https://cimss.ssec.wisc.edu/satellite-blog/archives/53389
Other
Washington, D. C.
Severe weather: https://cimss.ssec.wisc.edu/satellite-blog/images/2025/10/PSv3Readout5July2022_2000_to_2200step.mp4 https://cimss.ssec.wisc.edu/satellite-blog/images/2025/10/G16B13-20220705_2001_to_2256anim.mp4 via https://cimss.ssec.wisc.edu/satellite-blog/archives/47110
Puerto Rico
Hurricane Maria https://cimss.ssec.wisc.edu/satellite-blog/wp-content/uploads/sites/5/2017/09/GOES16_RedVis-20170920_1017_1117anim.gif via https://cimss.ssec.wisc.edu/satellite-blog/archives/25338
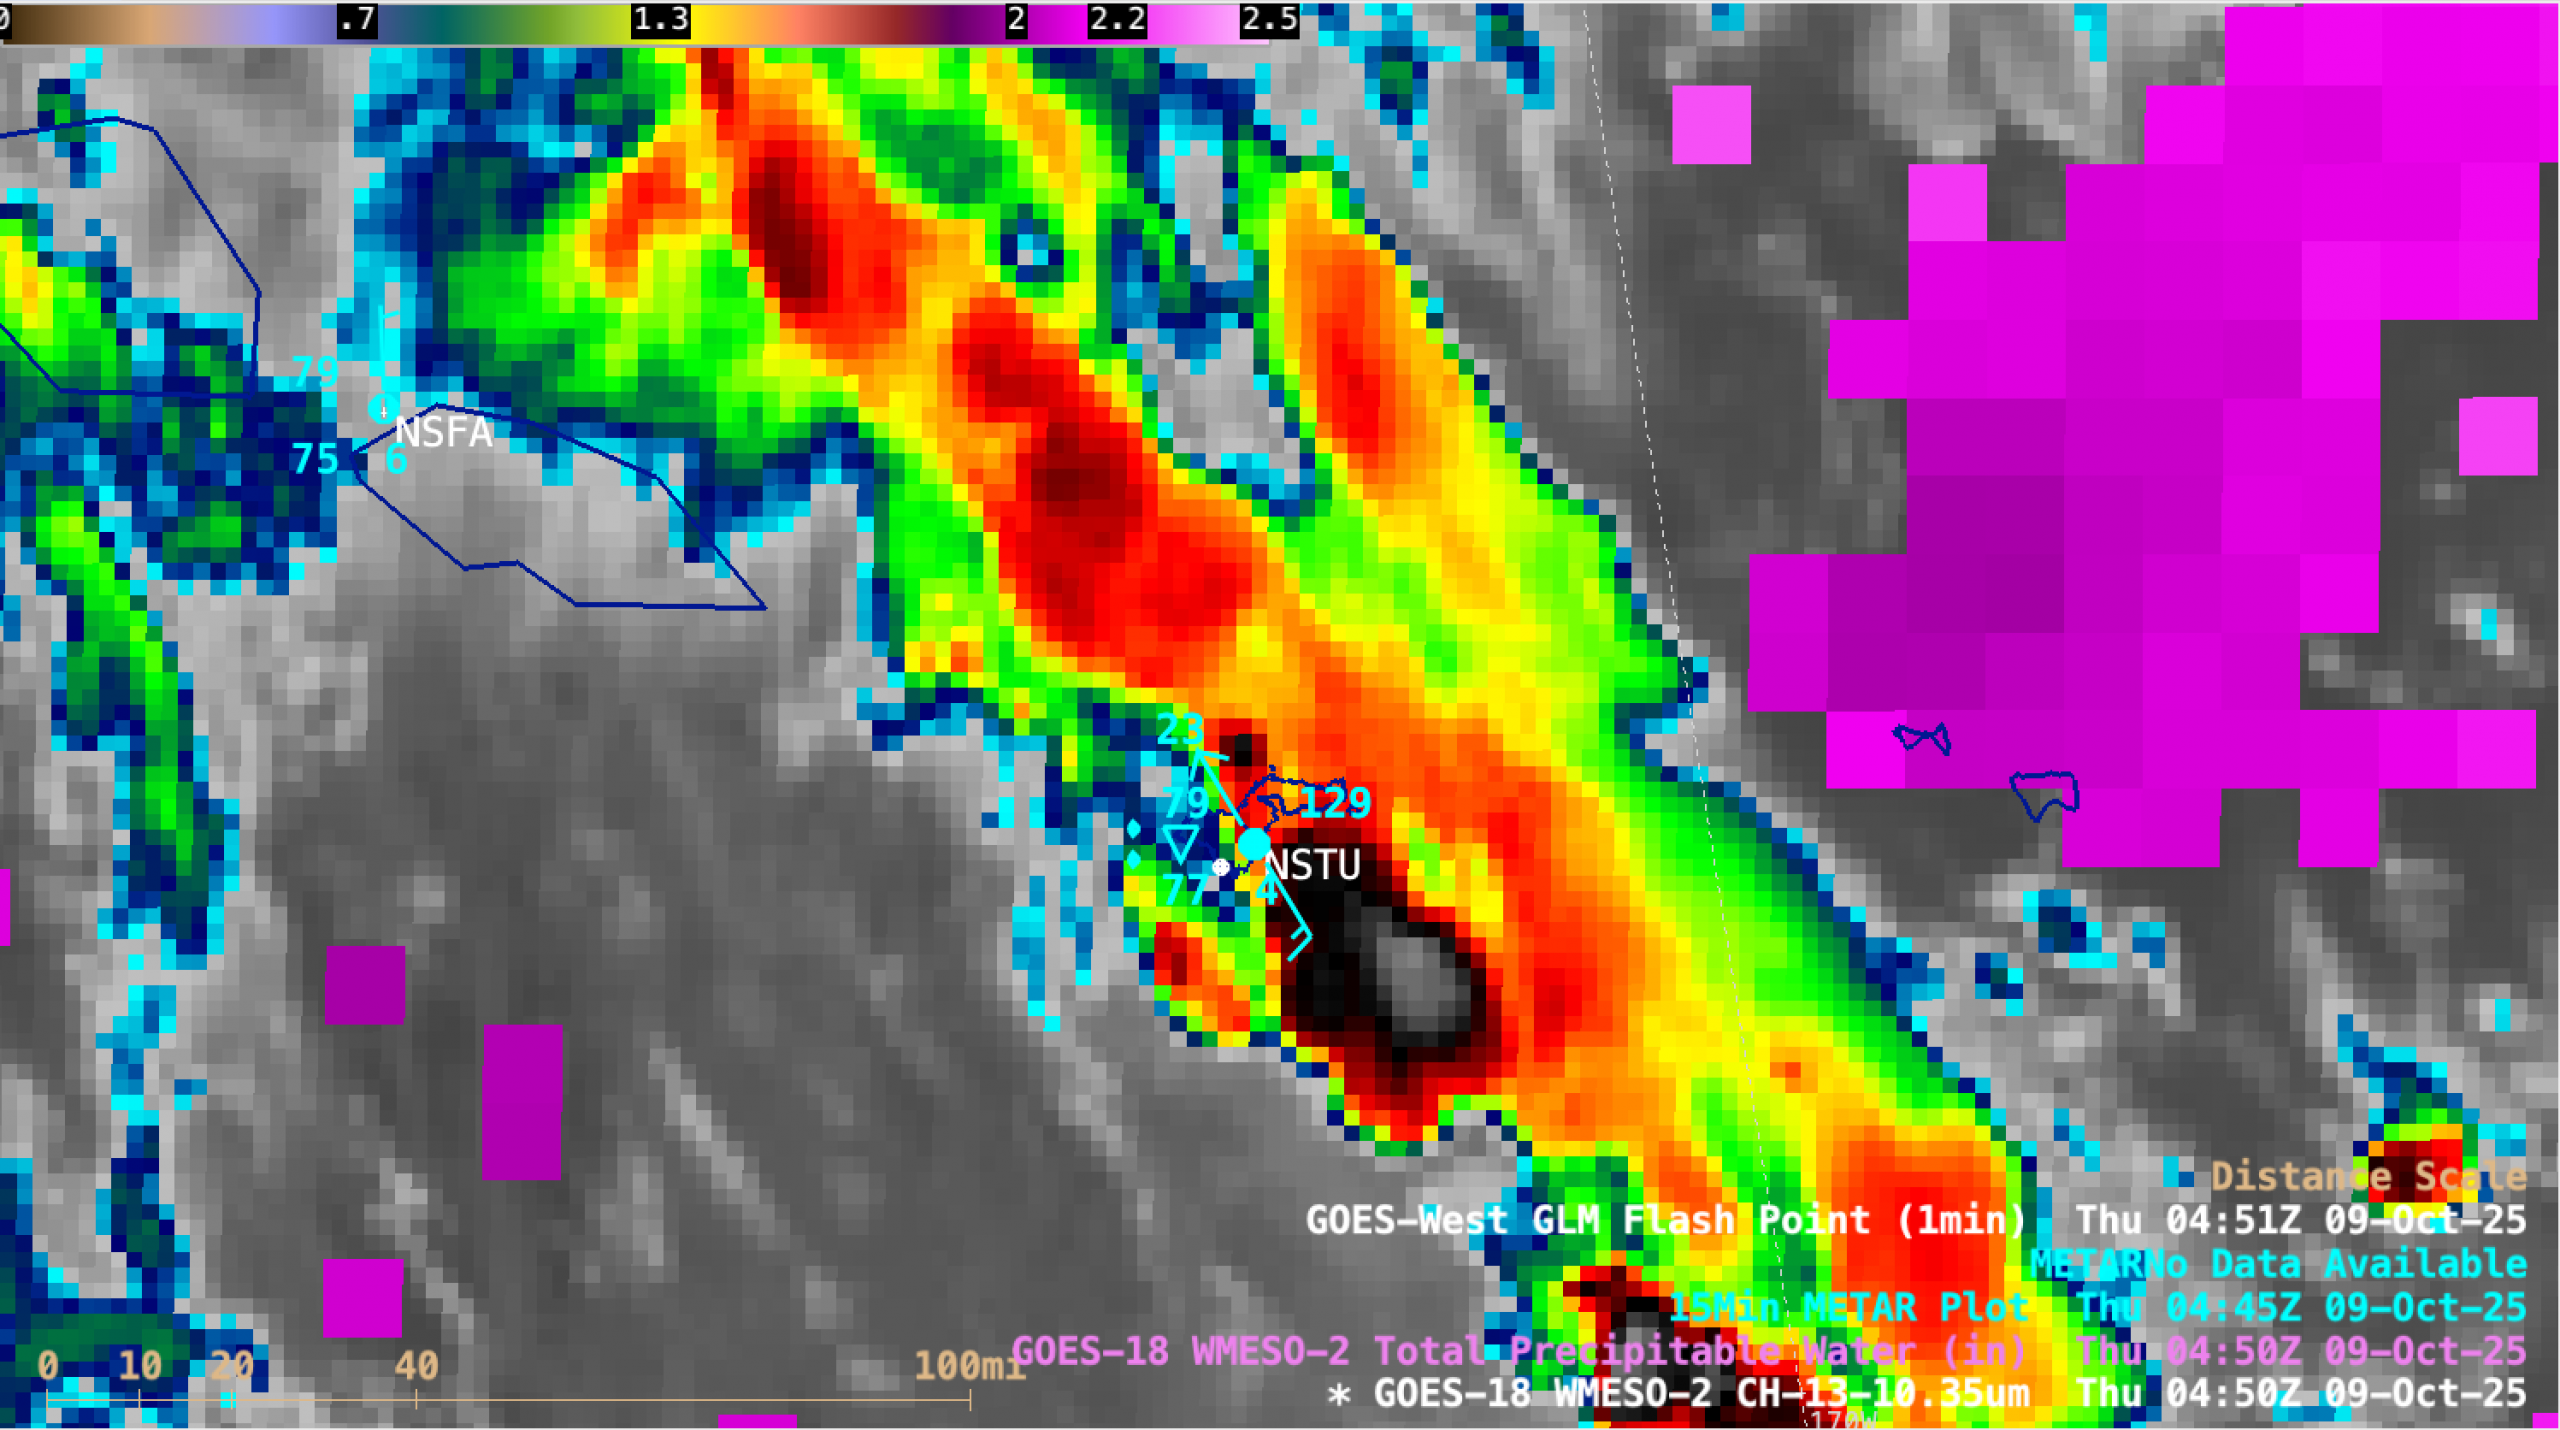
American Samoa
Flash flooding example: https://cimss.ssec.wisc.edu/satellite-blog/archives/59796
H/T
Both McIDAS-X and Geo2Grid (as well as AWIPS) software was used in generating these images, using data via the UW/SSEC Data Services. More about GOES-16. Thanks to CIMSS Satellite Blog contributors Scott Bachmeier and Tim Schmit, in addition to Mat Gunshor and Alexa Ross. Credit to Bill Bellon for coding up the map.

View only this post Read Less


