Hurricane Force Low off the US East Coast
5-minute GOES-16 Red Visible (0.64 µm) images, with overlays of hourly buoy/ship reports and 3-hourly analyses of surface pressure and fronts, from 1426-2101 UTC on 15th November [click to play MP4 animation]
About an hour after the beginning of the GOES-16 Visible image animation, Metop-C ASCAT Ultra High Resolution surface winds at 1529 UTC (source) depicted a small area of wind speeds greater than 50 knots, just west of the light winds near the center of the low pressure system (below) — and the 1531 UTC GOES-16 image also showed a few GOES-16 Derived Motion Wind vectors with speeds of 51-53 knots just west of the surface low.
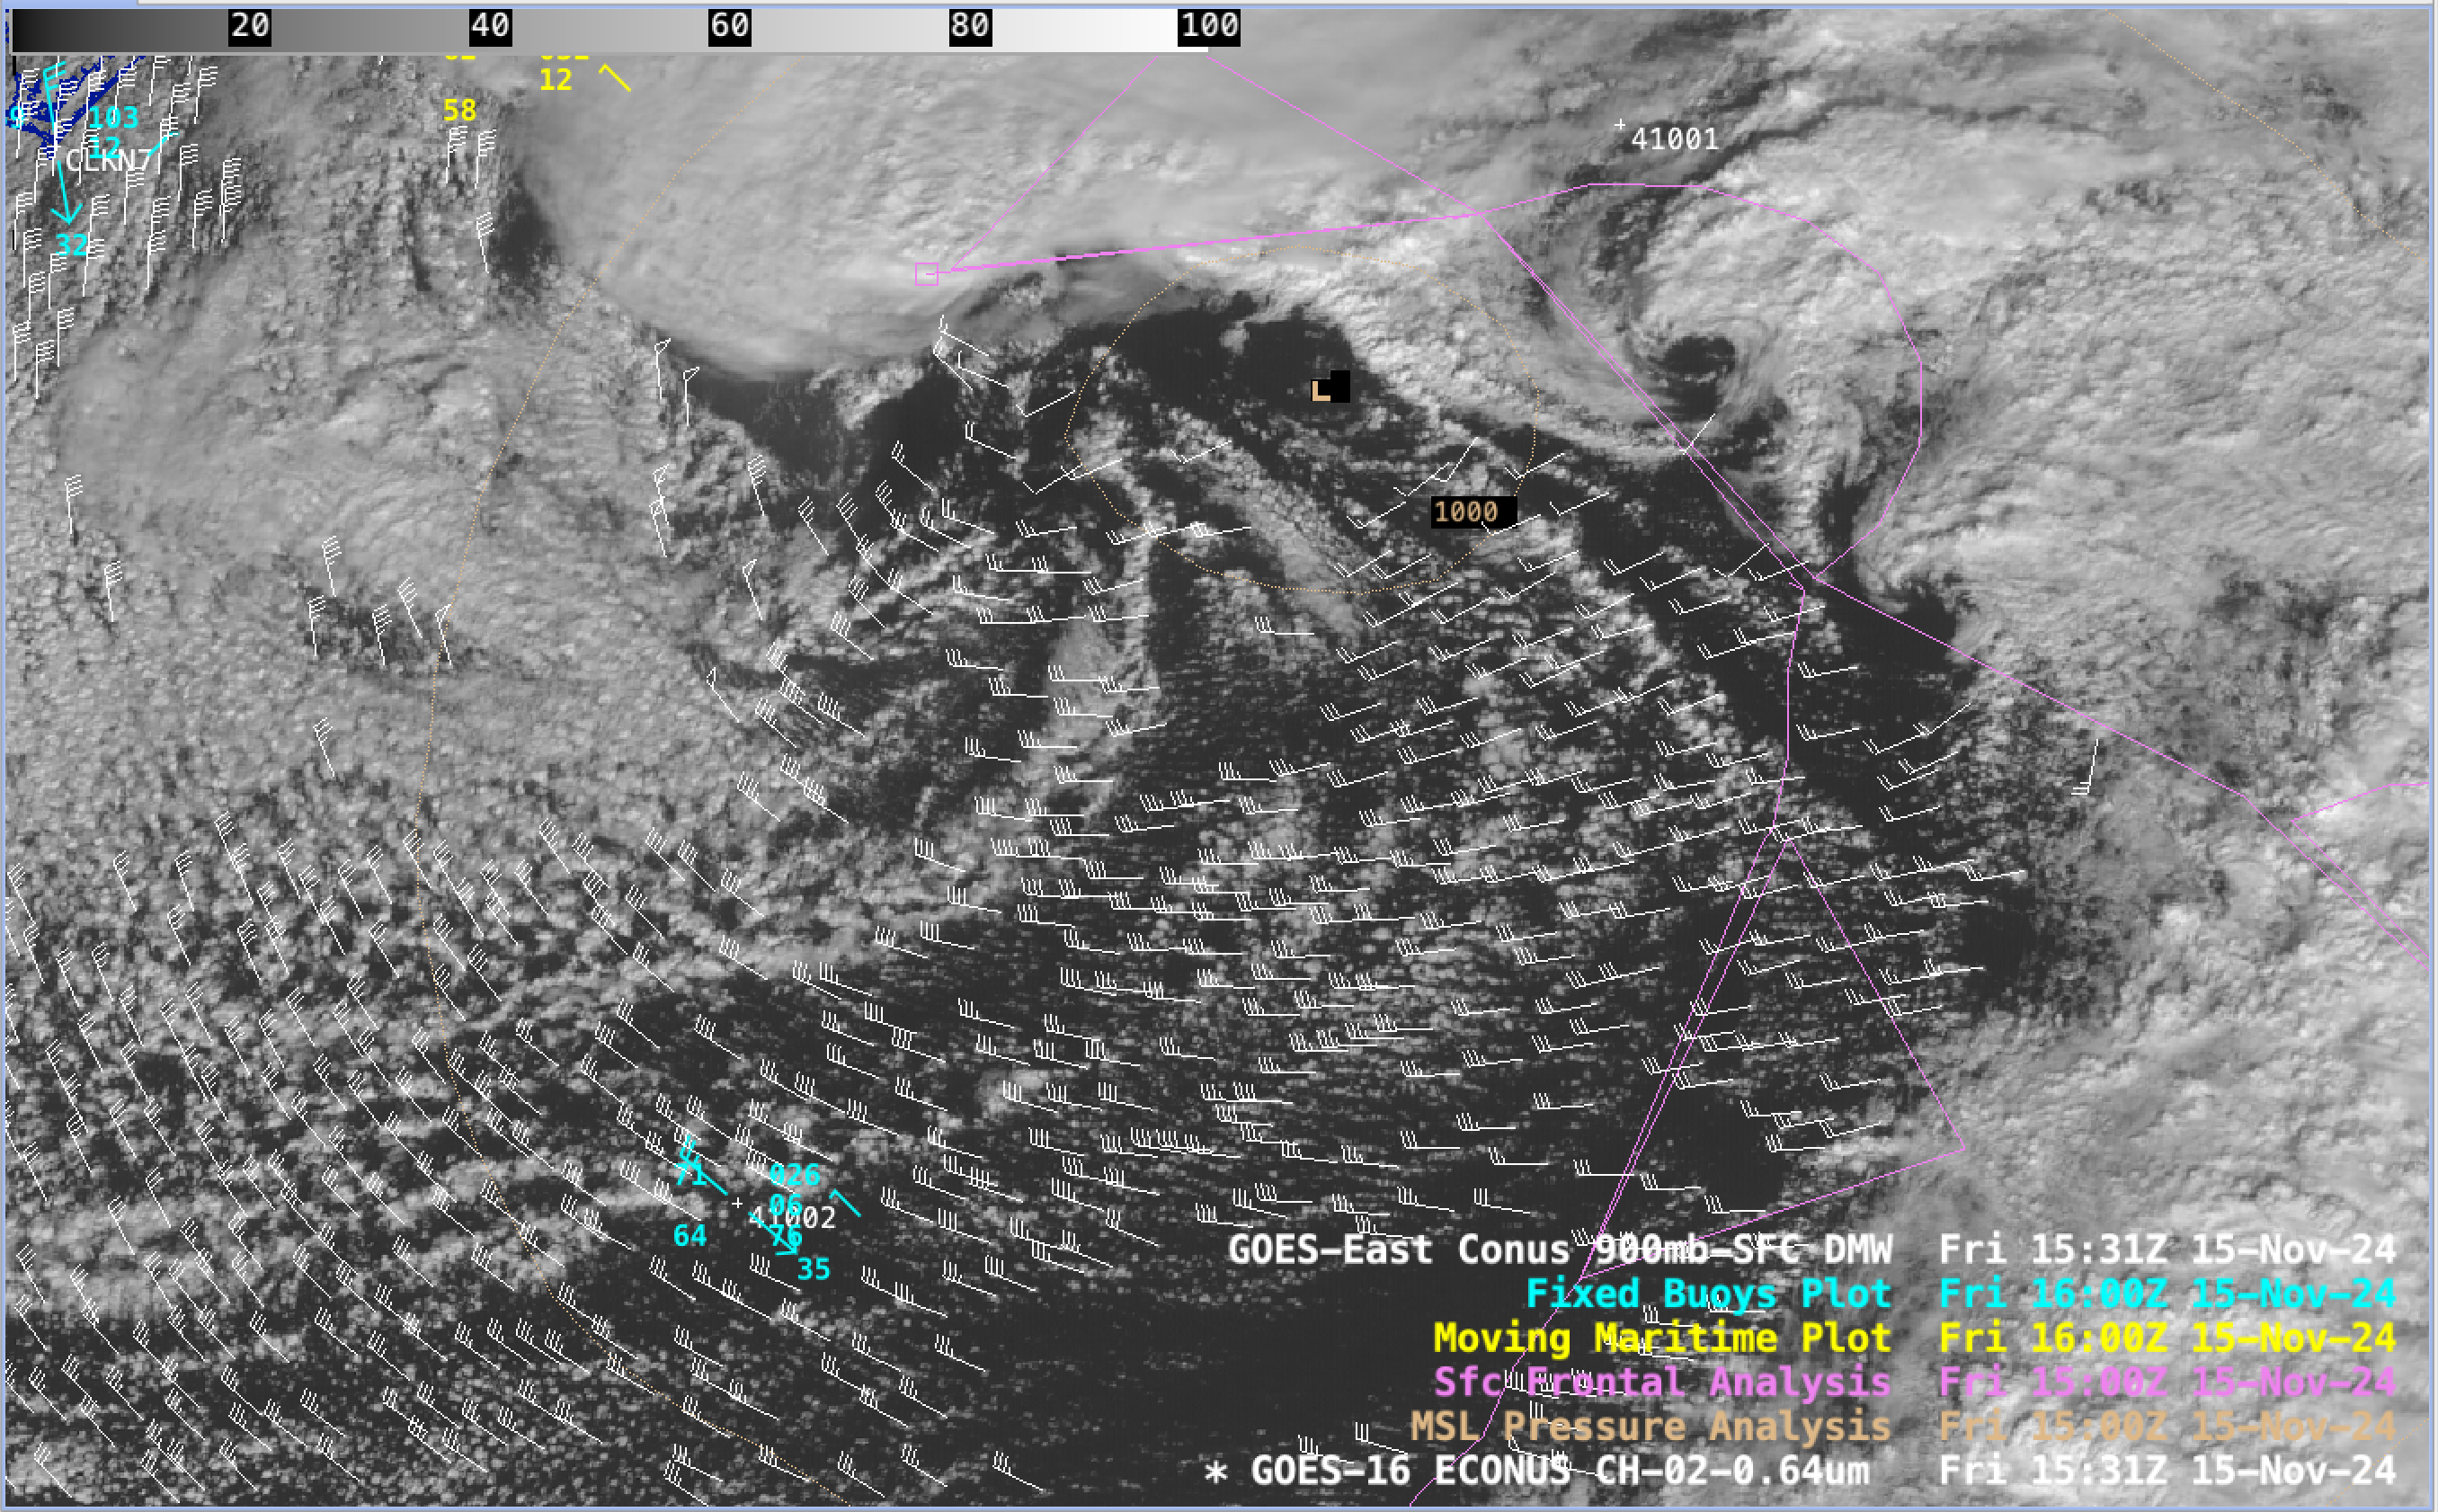
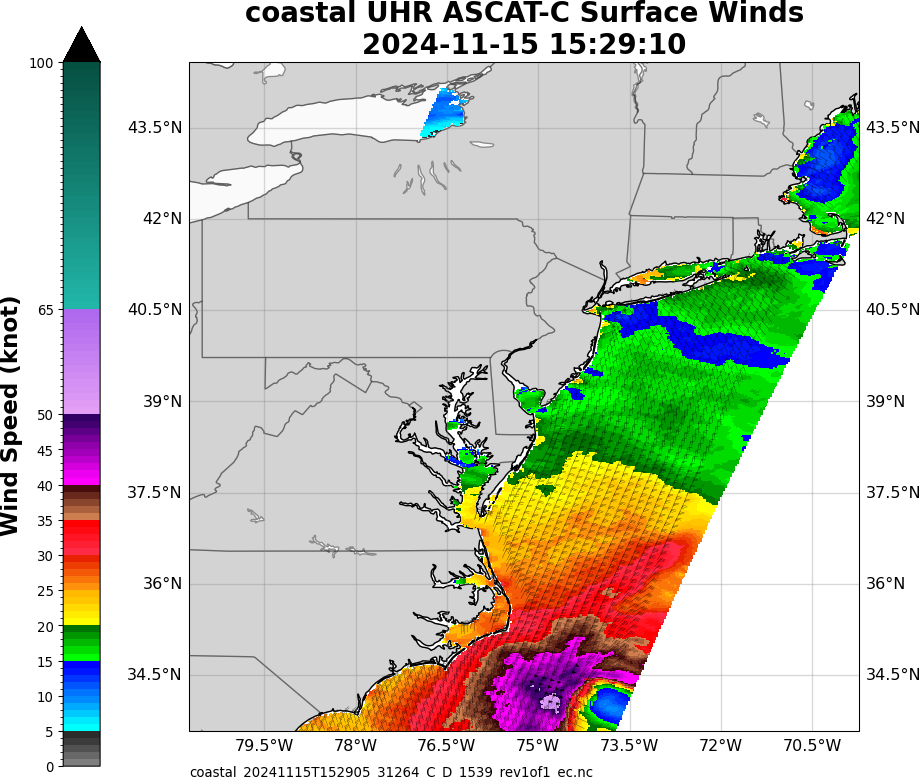
Metop-C ASCAT Ultra High Resolution surface winds at 1529 UTC on 15th November
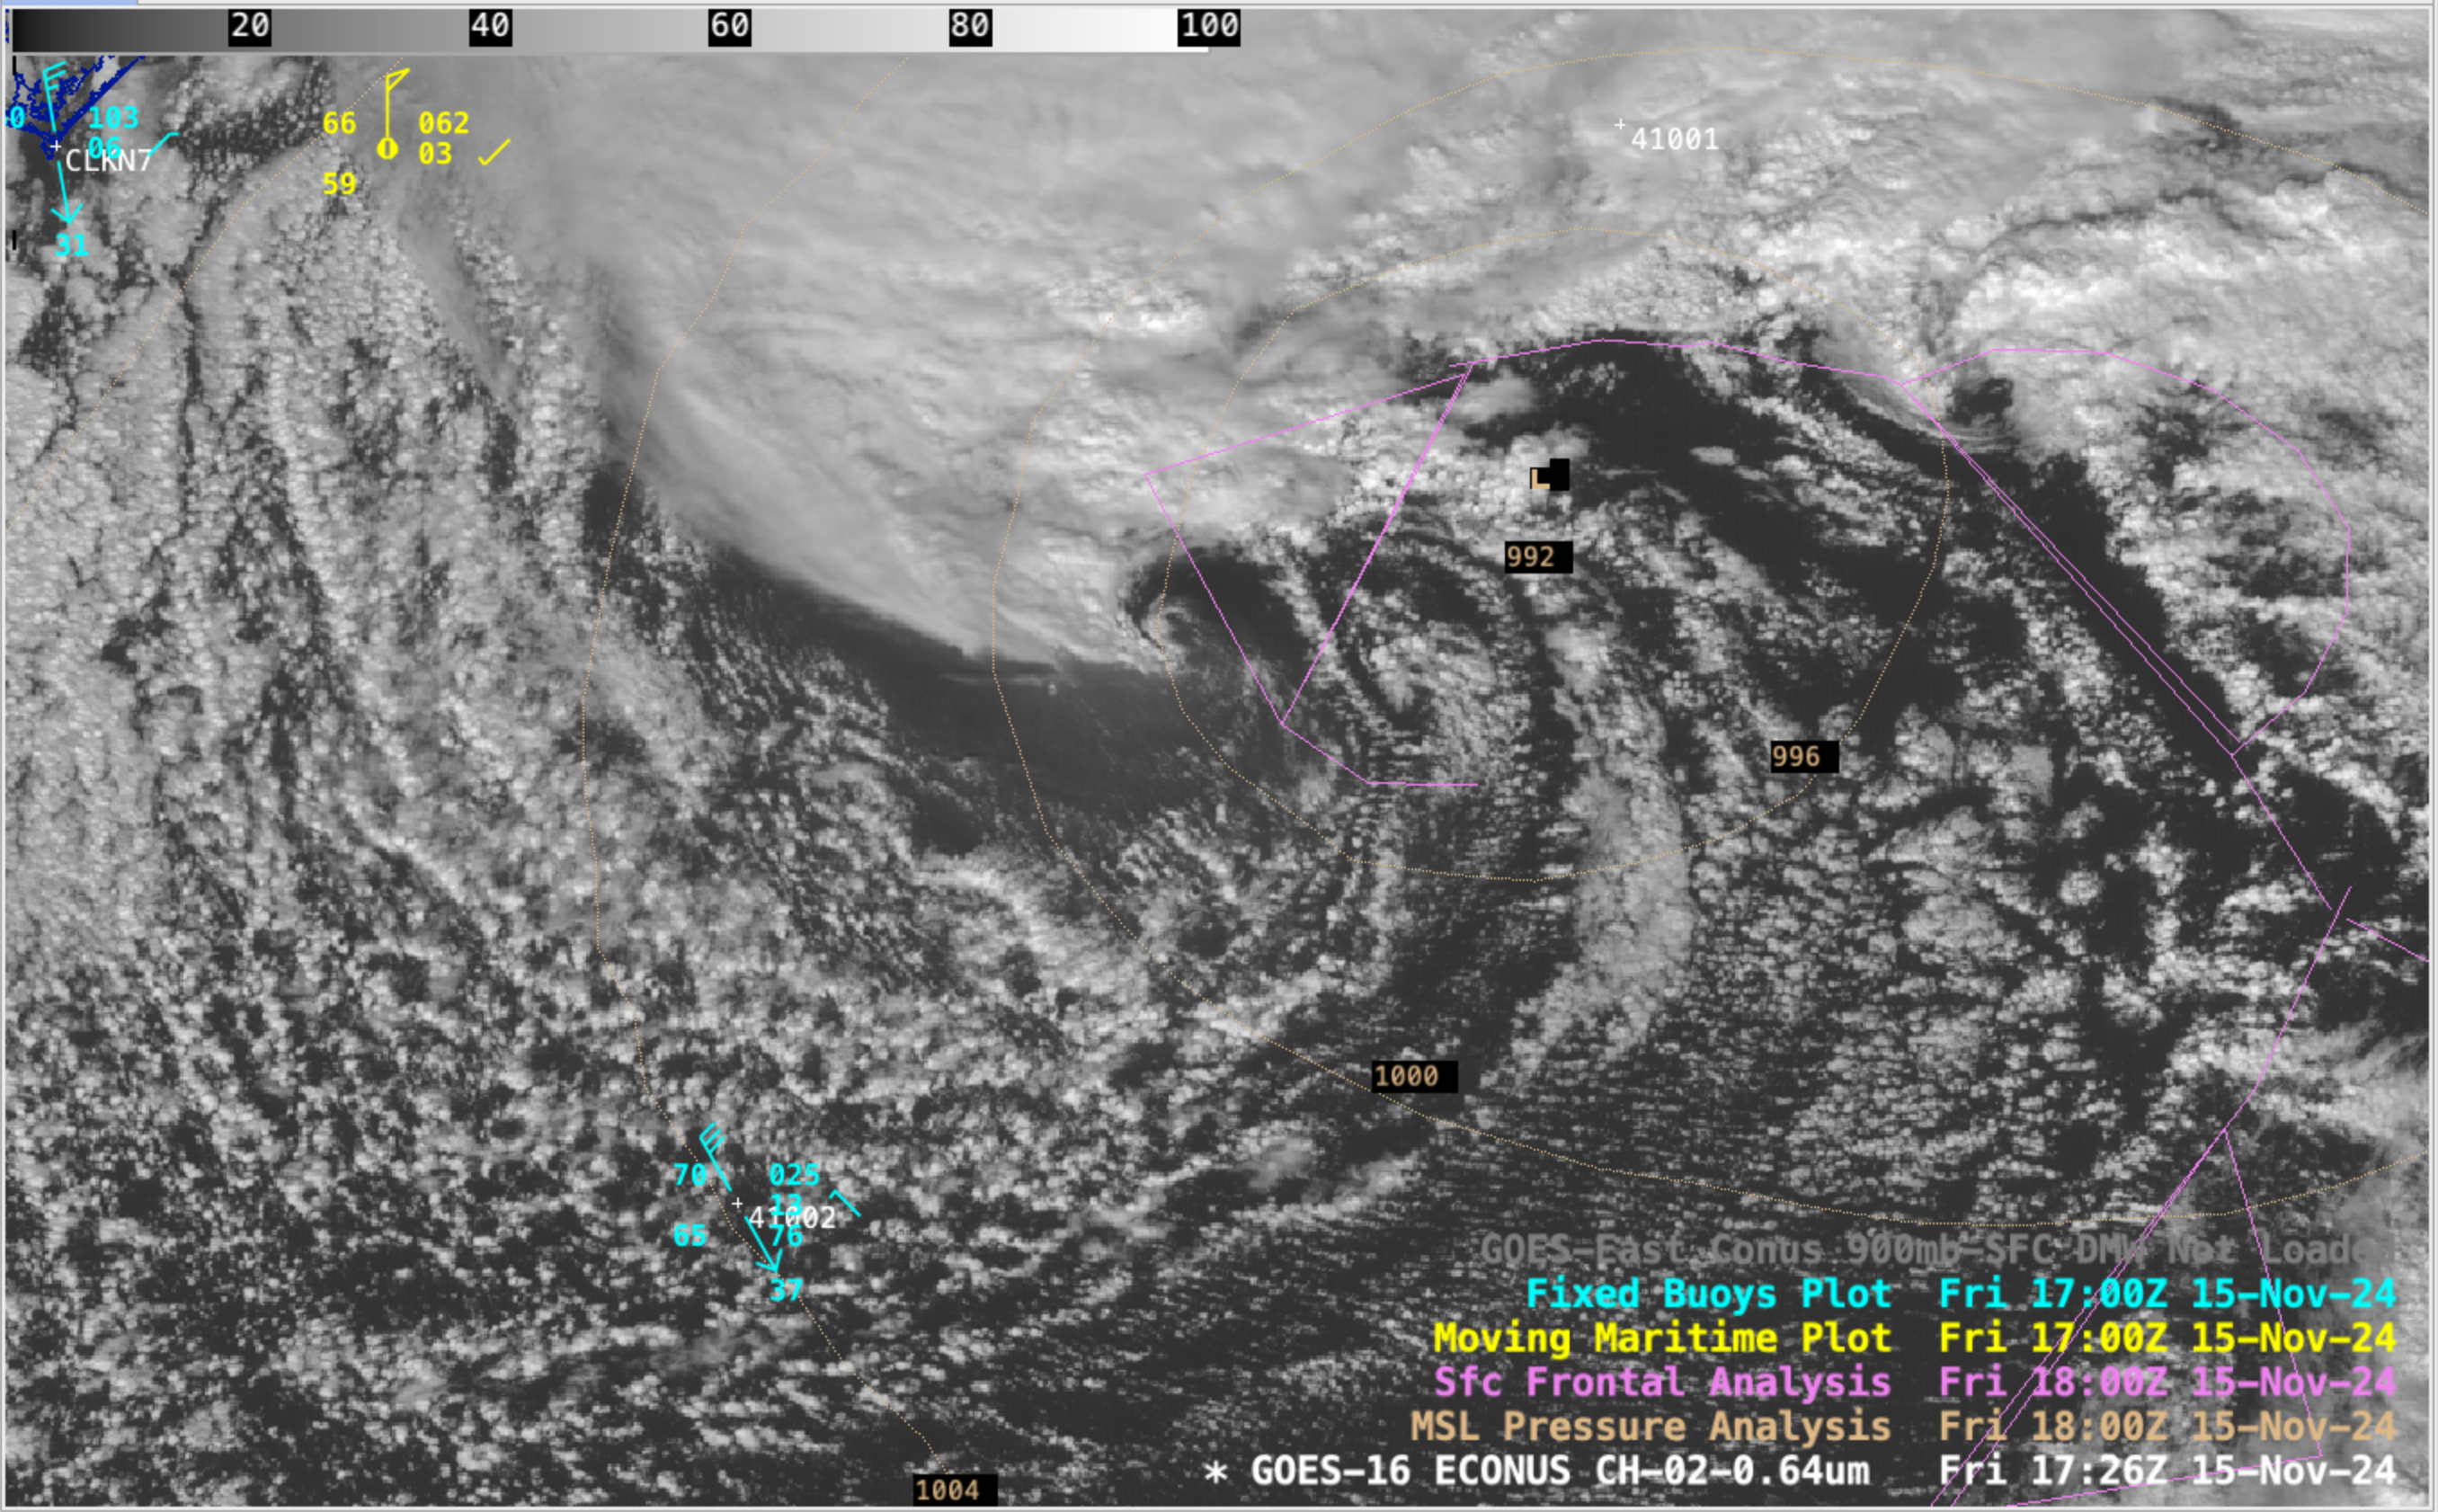
GOES-16 Visible images that included plots of GOES-16 Derived Motion Winds (DMW) within the marine boundary layer (Surface-900 hPa) are shown below — which highlighted cloud-tracked DMW speeds of 63-66 knots (72-76 mph) just south of the hazy-appearing areas of rough seas.
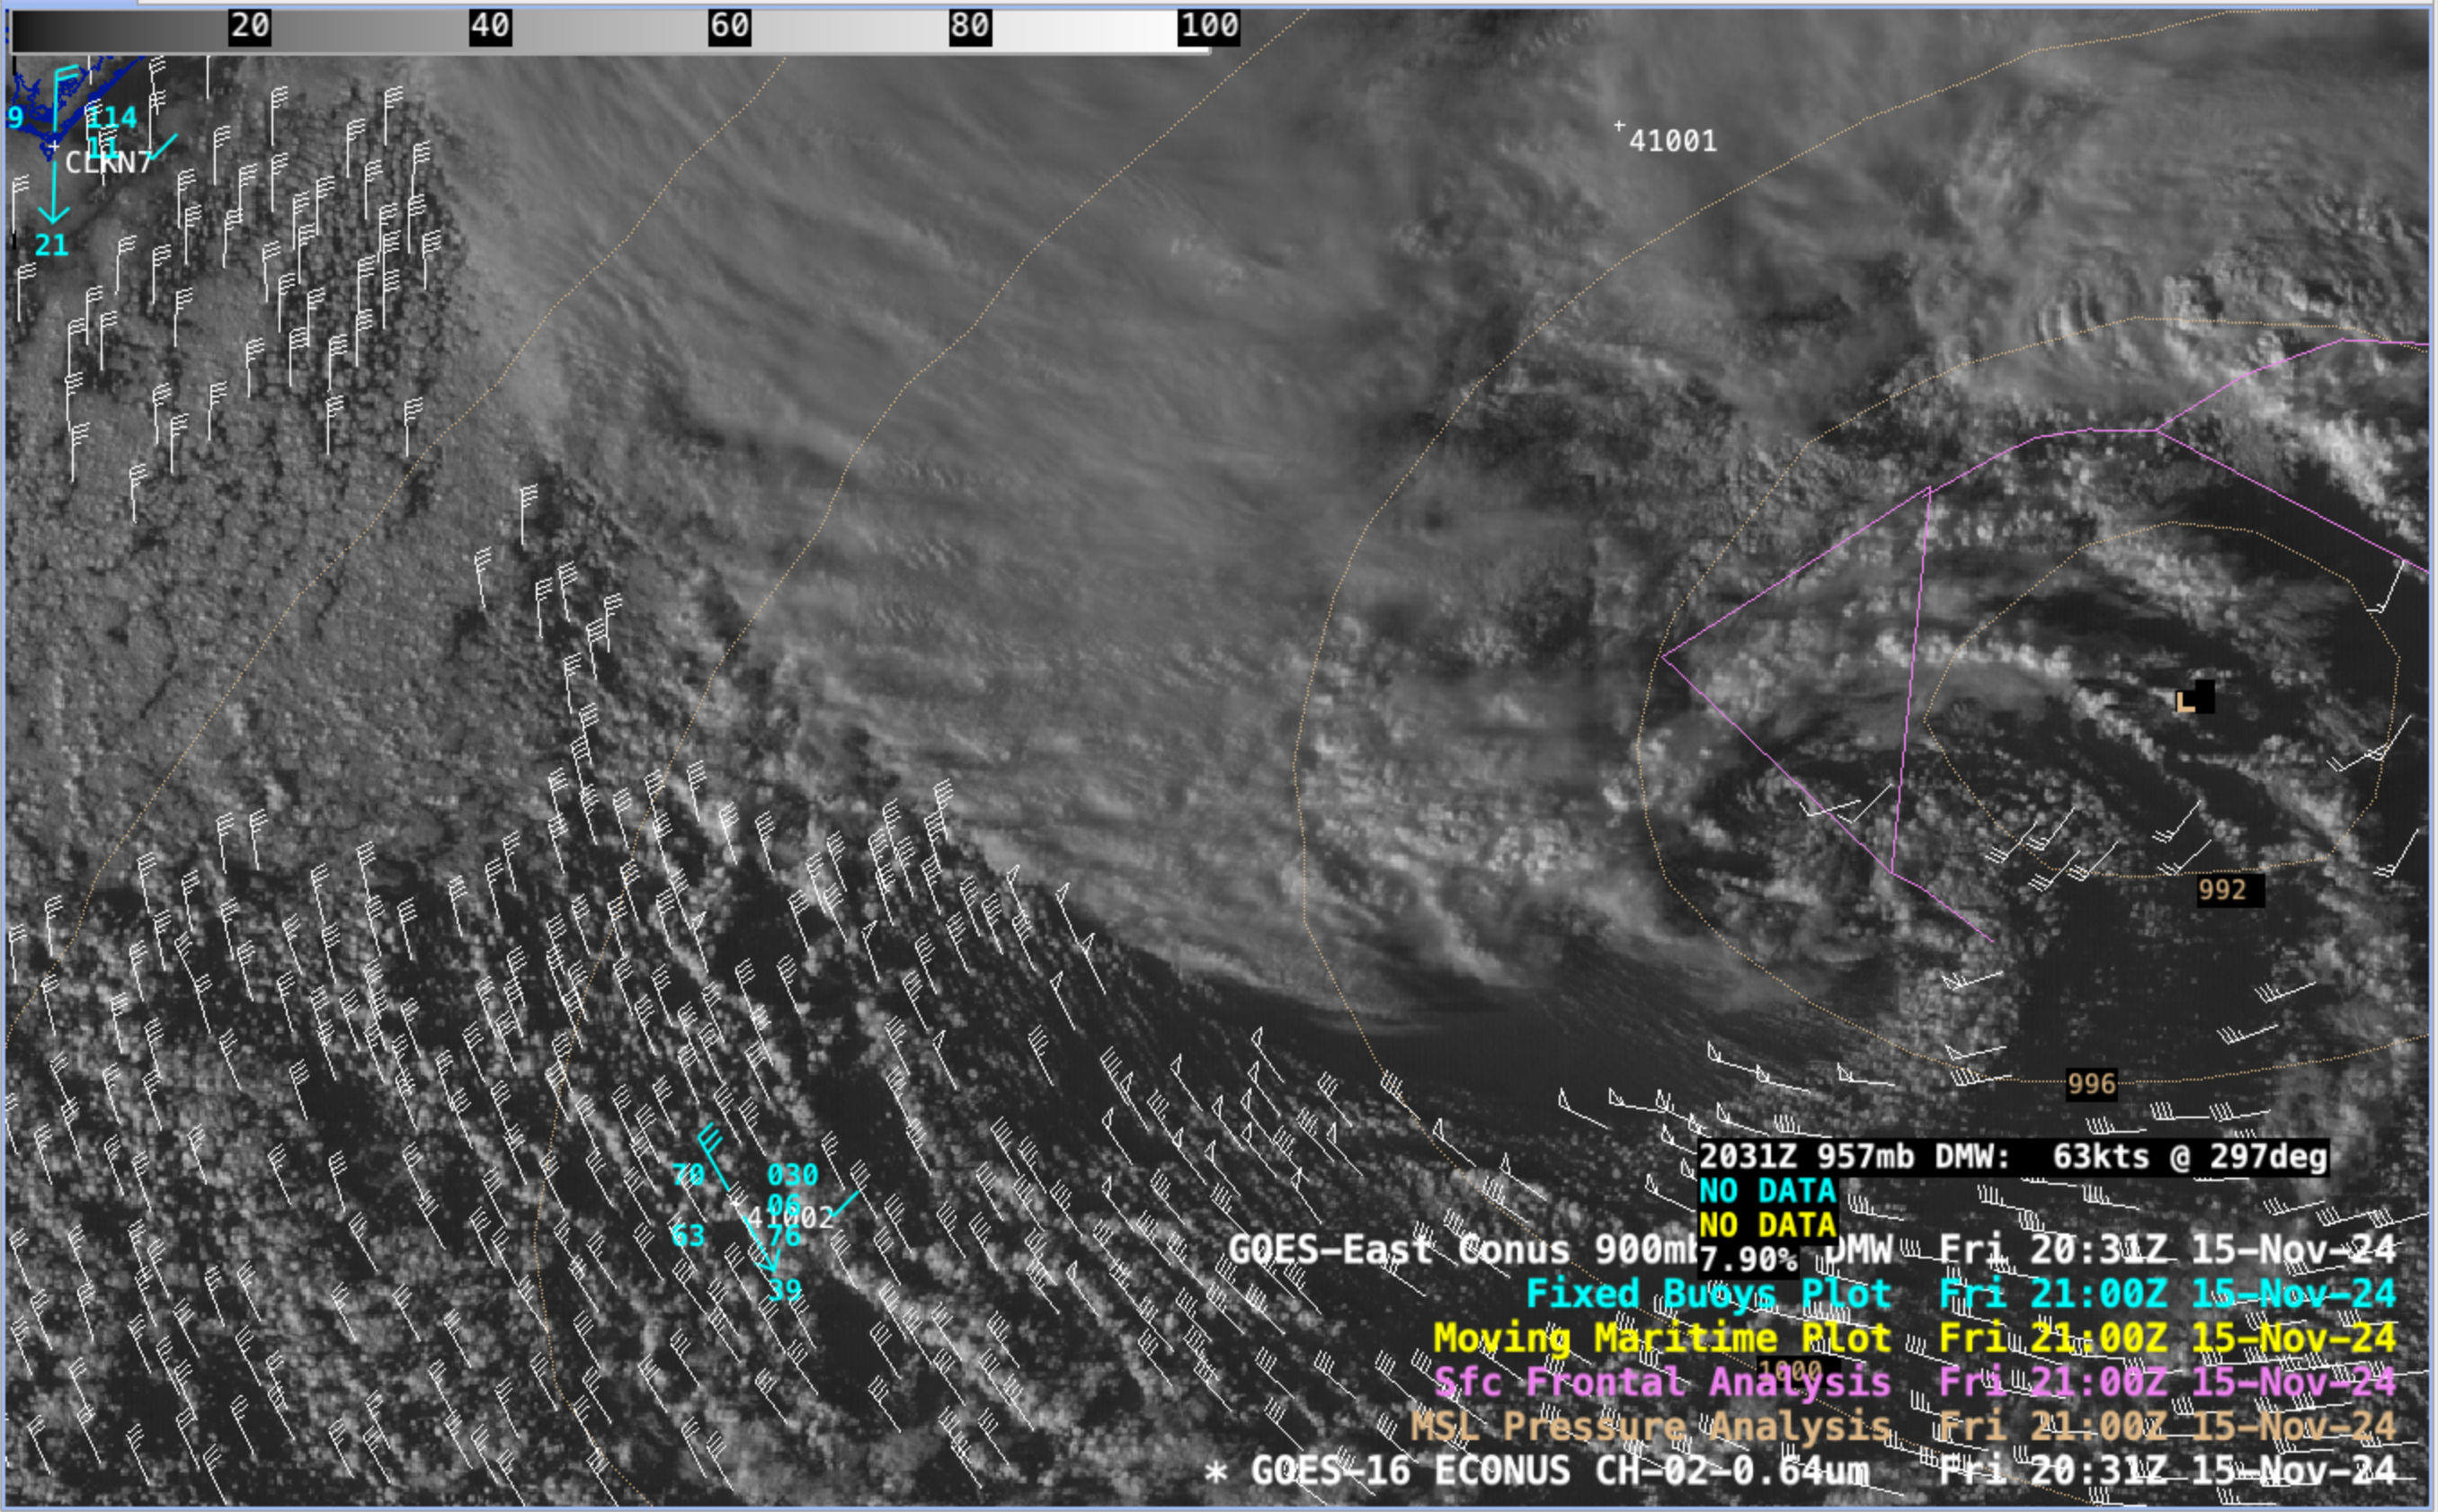
GOES-16 Red Visible (0.64 µm) image at 2031 UTC, with a cursor sample of a marine boundary layer (Surface to 900 hPa) Derived Motion Wind vector having a speed of 63 knots [click to enlarge]
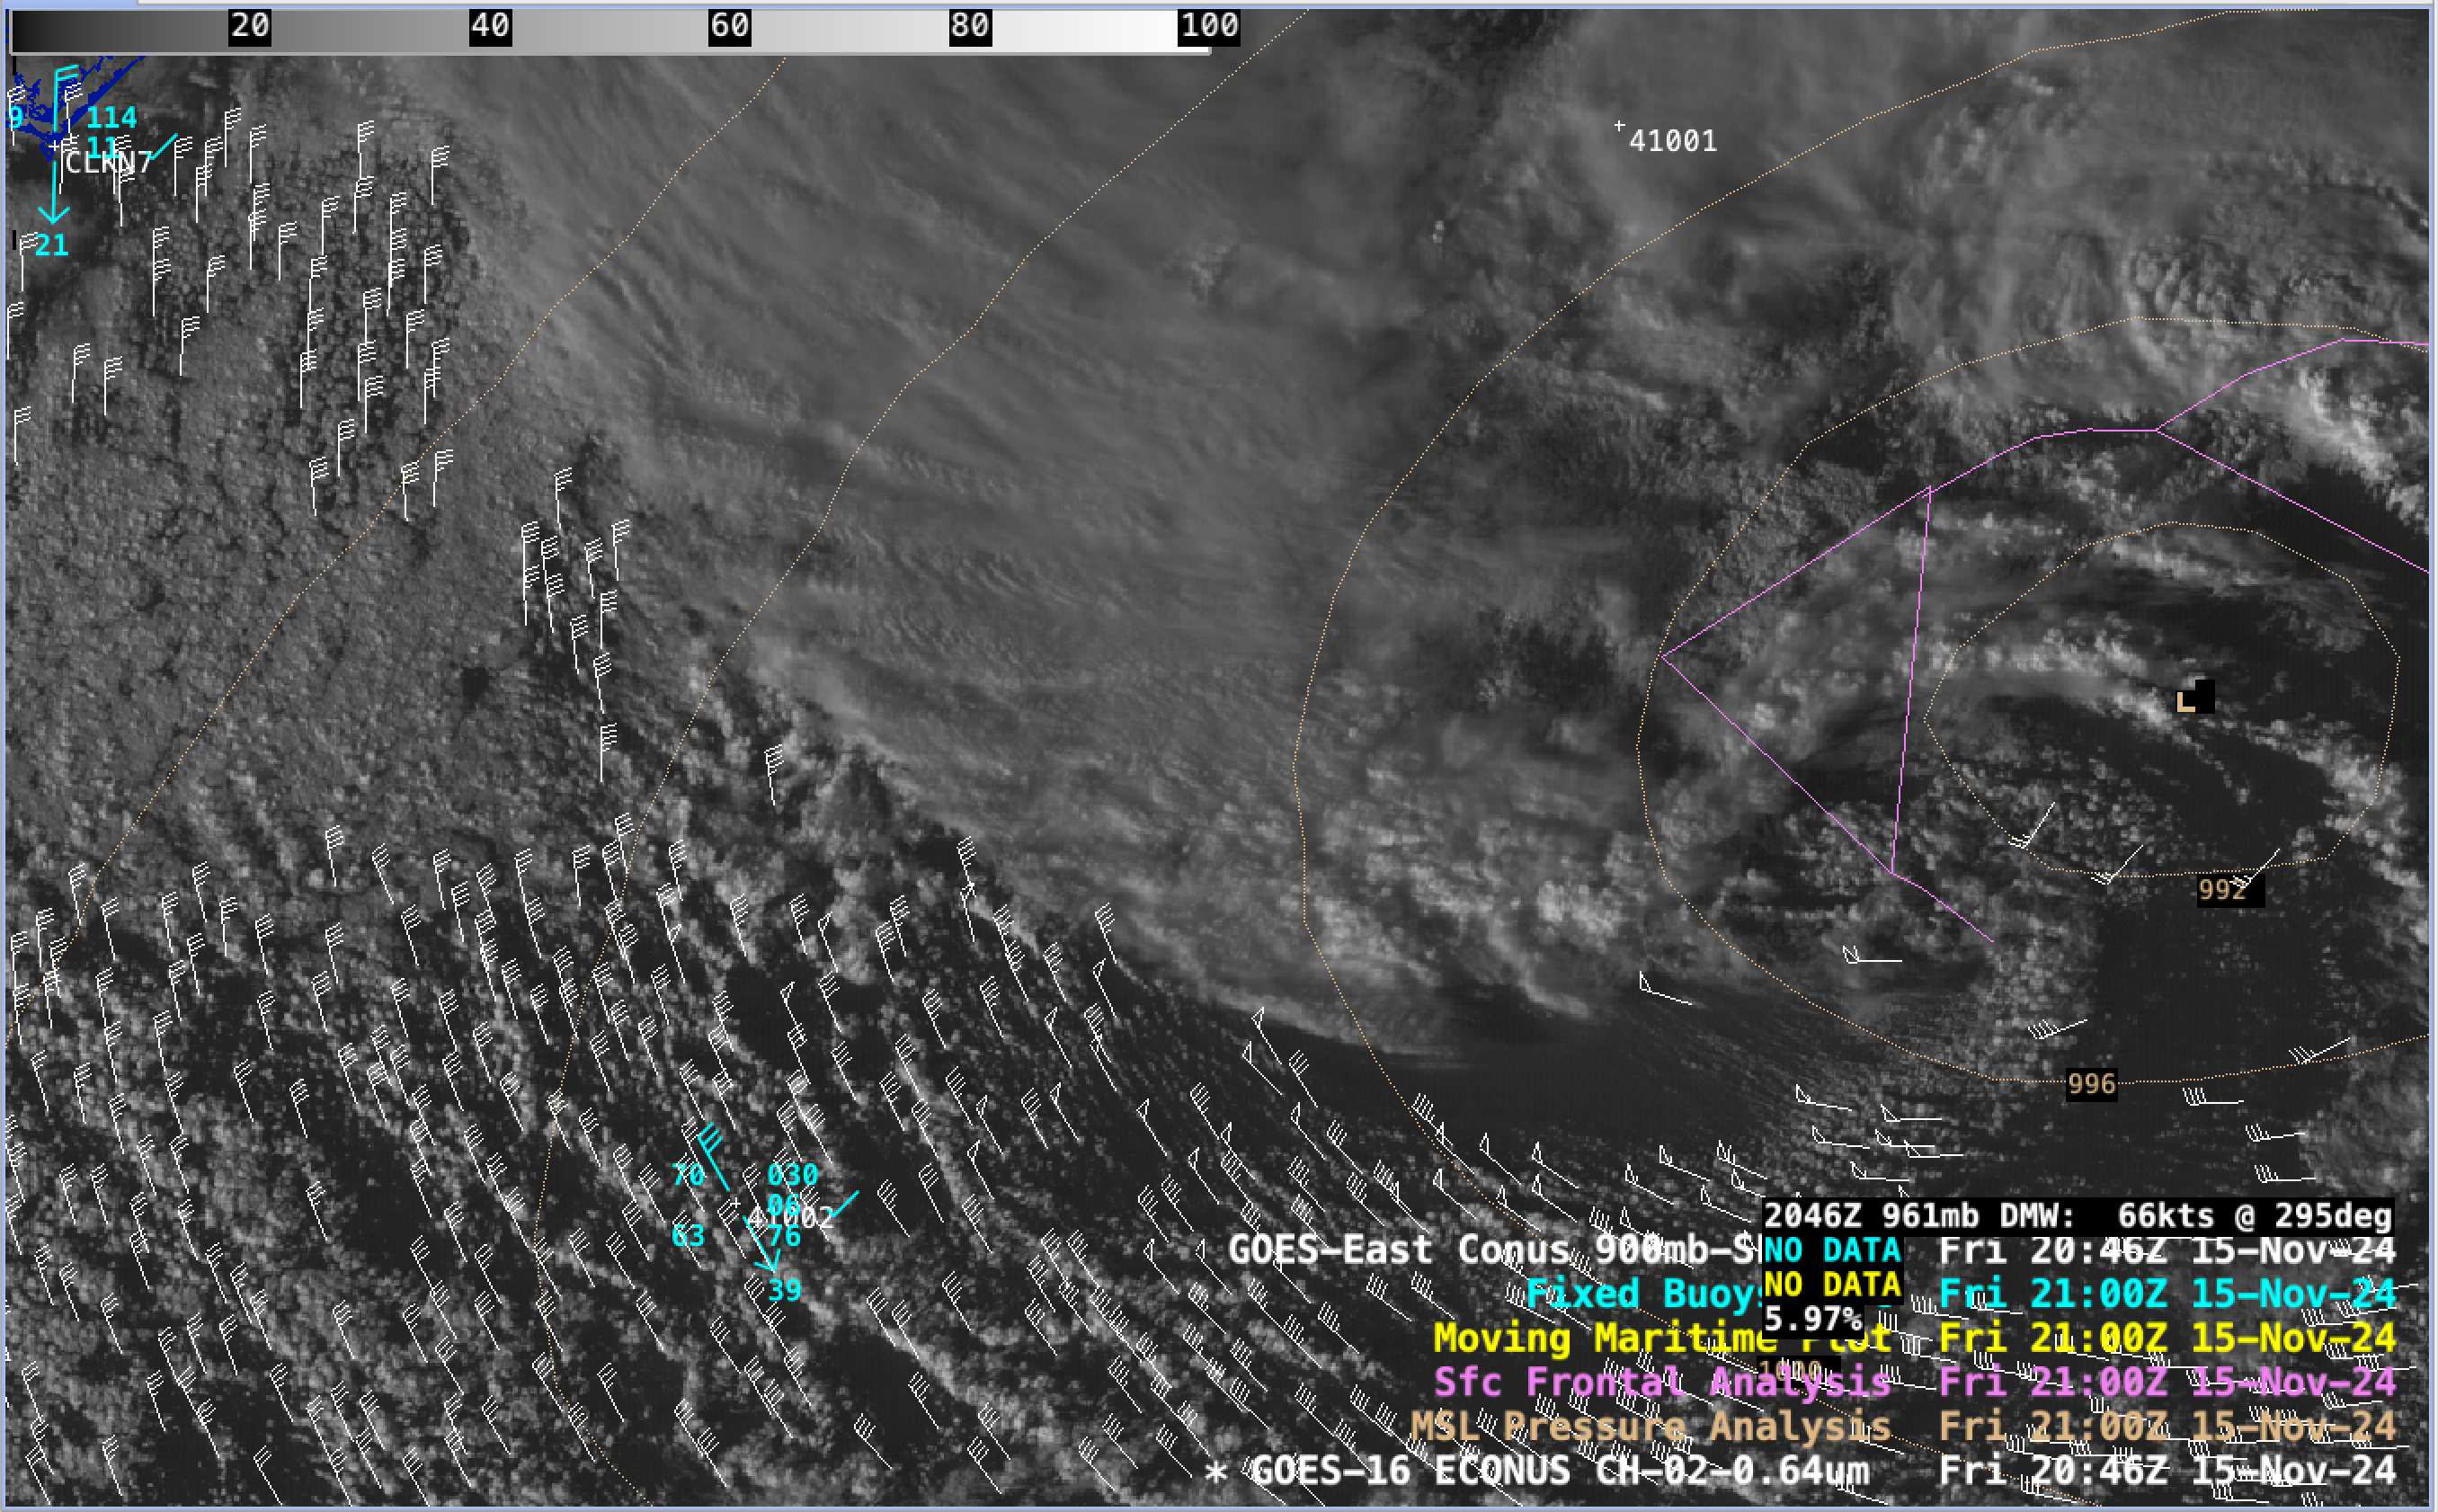
GOES-16 Red Visible (0.64 µm) image at 2046 UTC, with a cursor sample of a marine boundary layer (Surface to 900 hPa) Derived Motion Wind vector having a speed of 66 knots [click to enlarge]
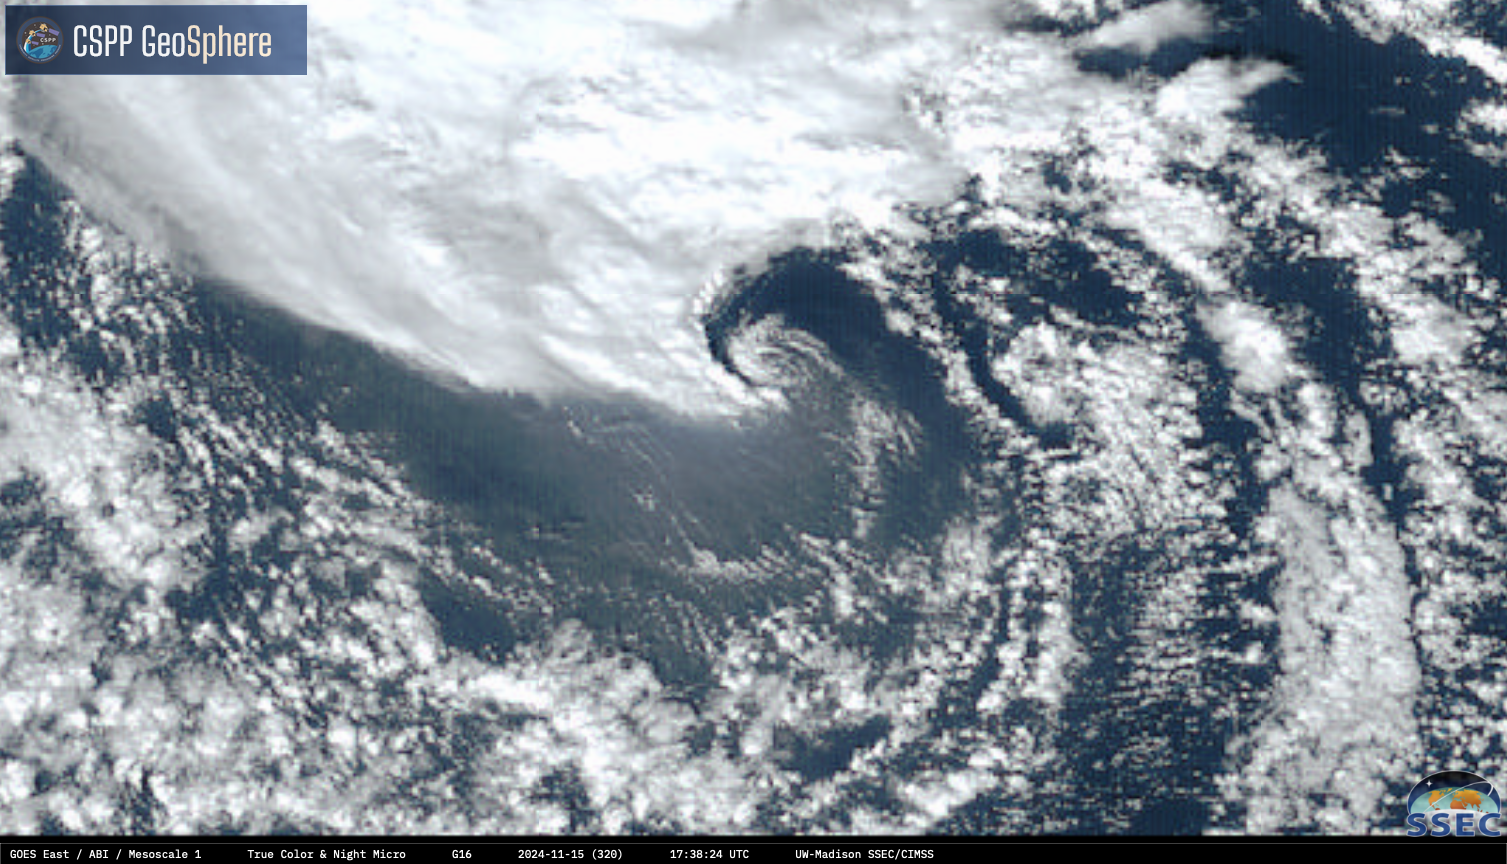
1-minute GOES-16 True Color RGB images, from 1600-2003 UTC on 15th November [click to play MP4 animation]