
VIIRS Today, like MODIS today, subsects the US into 8 sectors of equal size. If you live in central South Carolina, or in the middle of Florida, for example, the Sector 7/Sector 8 seam is right on top of you. Perhaps you want to view the entire Great Lakes in one image, rather than... Read More
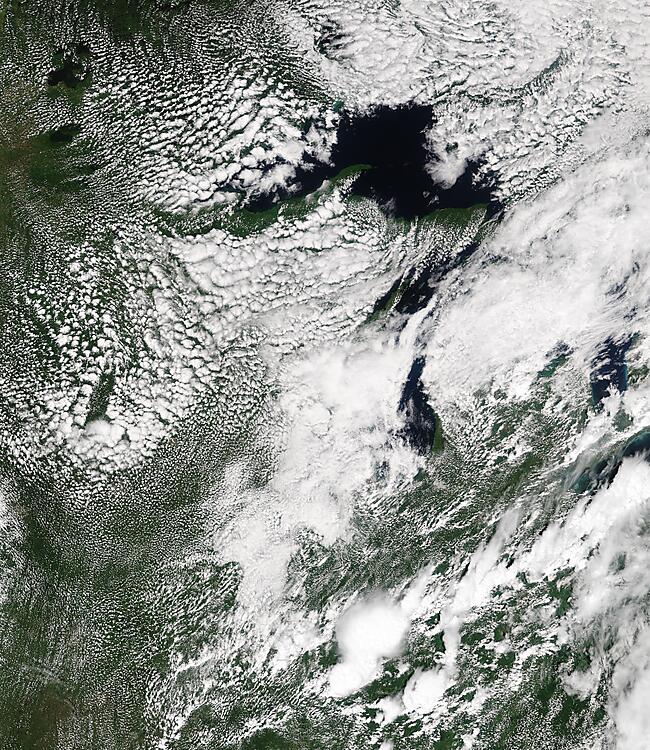
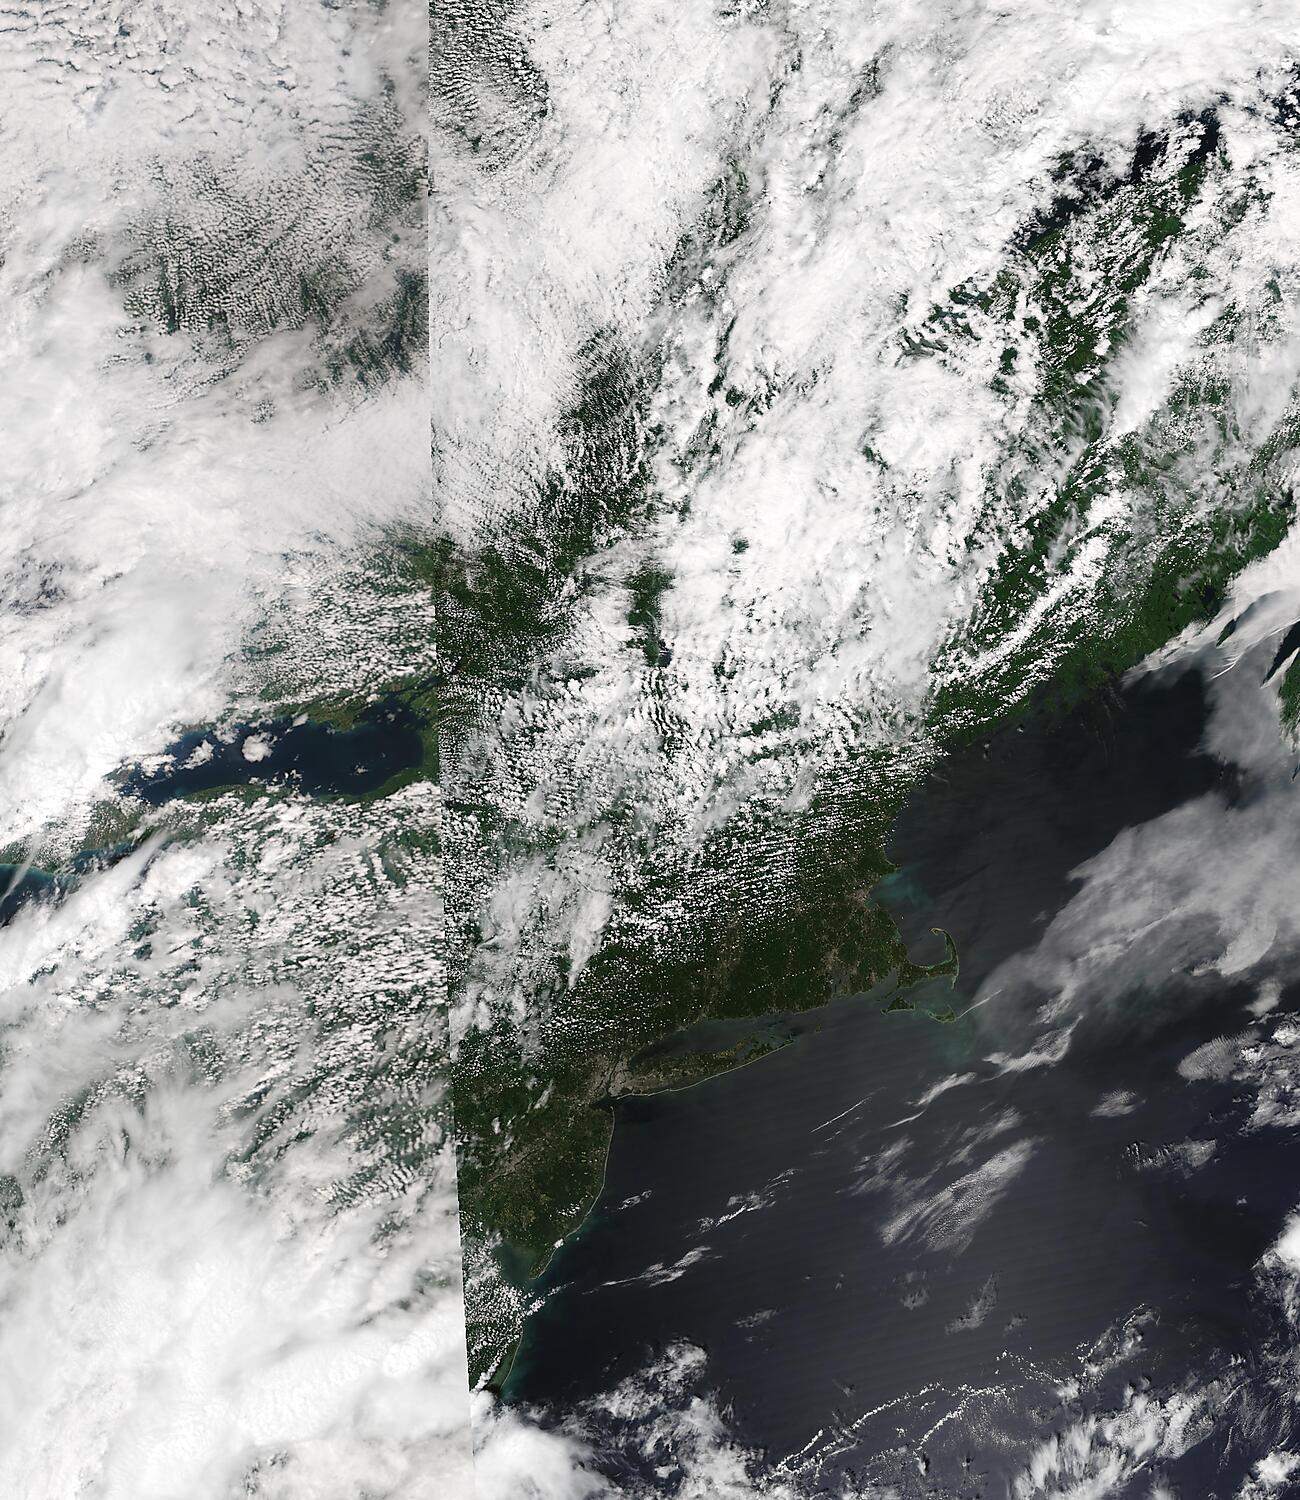
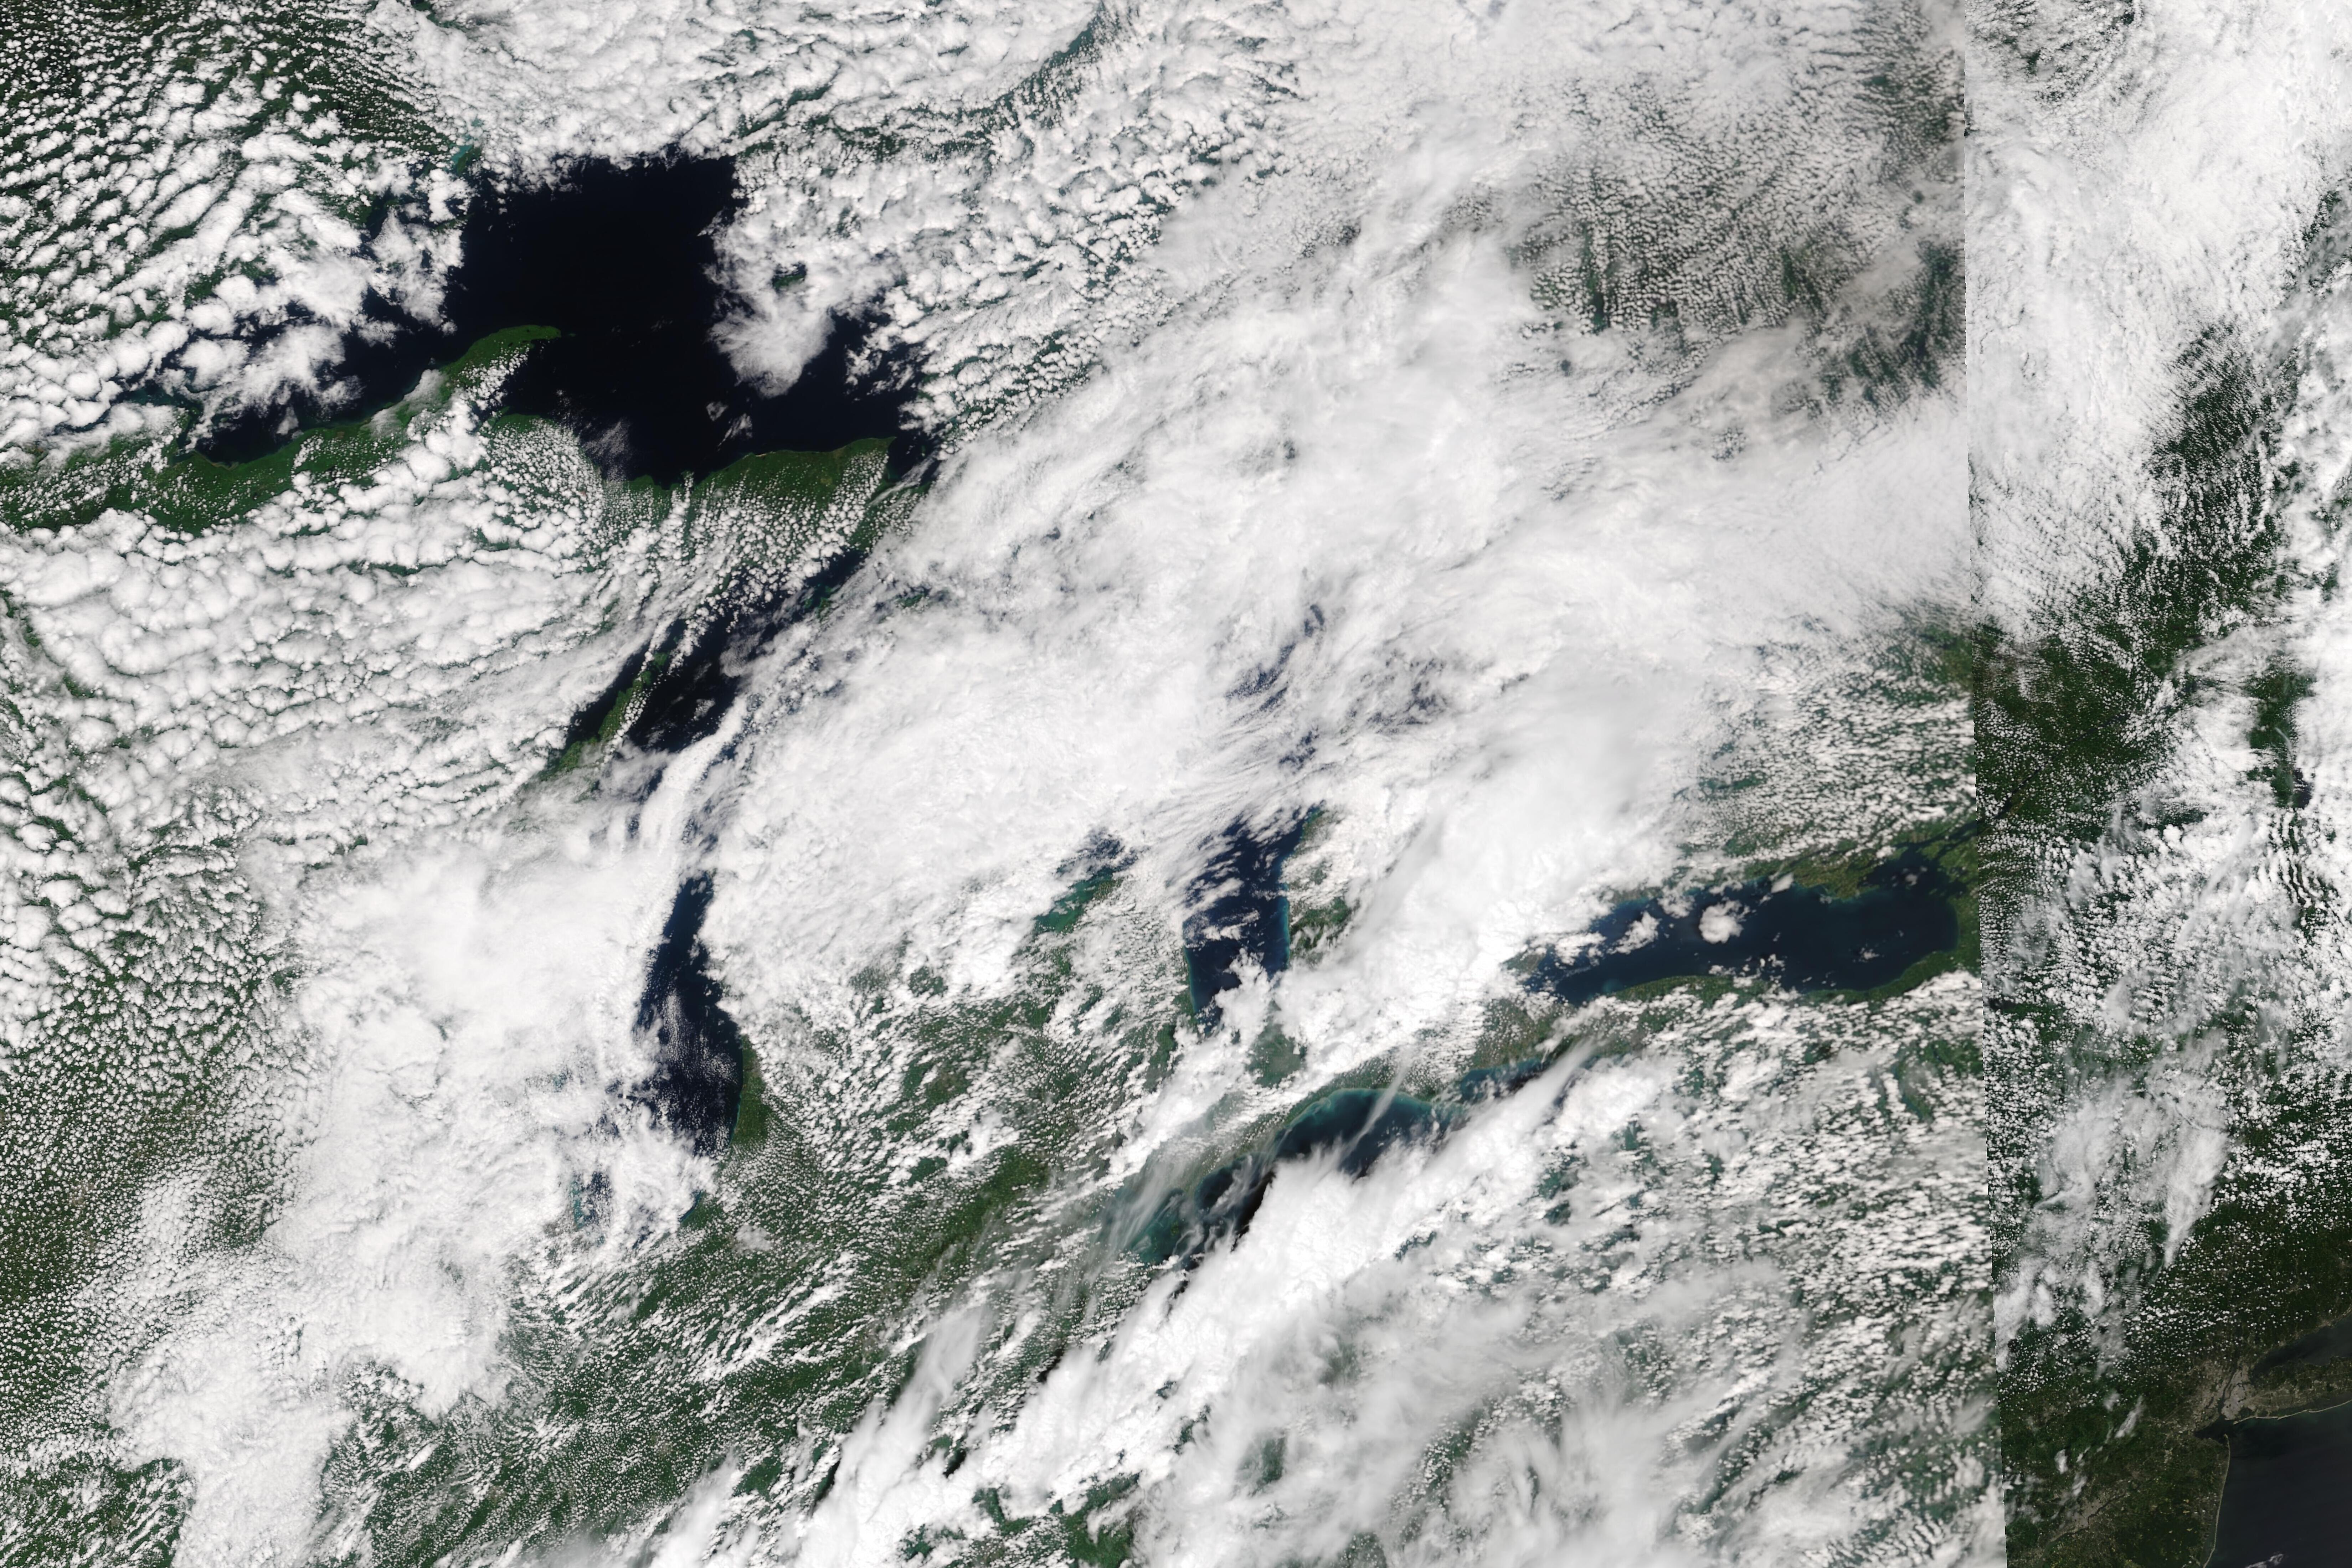
NOAA-20 True-Color Imagery showing all five Great Lakes, 3 August 2020 (Click to enlarge)
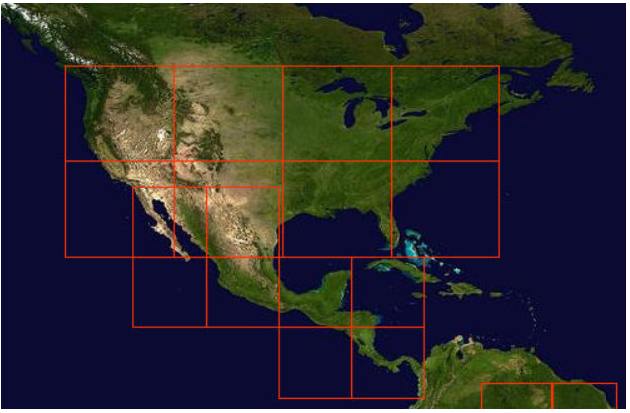
VIIRS Today, like MODIS today, subsects the US into 8 sectors of equal size. If you live in central South Carolina, or in the middle of Florida, for example, the Sector 7/Sector 8 seam is right on top of you. Perhaps you want to view the entire Great Lakes in one image, rather than a split between Sector 3 and Sector 4. (This image, from this website, shows the 8 sectors over the United States). There are easy ways to create seam-spanning imagery.
Because the sectors are of fixed and unchanging locations and sizes (1300×1500 for 1-km resolution, 5200×6000 for 250-m resolution), it’s a simple matter to create a script to access the imagery, cut parts out, and paste them back together. For this task, I use ImageMagick, a useful, scriptable image manipulation package. The two grid sizes (950x1100 for sector USA3, 700x1100 for sector USA4) and offsets (+351+101 for sector USA3,+0+101 for sector USA4) were determined by trial and error that took about 5 minutes.
The first script below is for the 1-km resolution images. The second script below is for 250-m resolution images; it has a multiplication factor of 4 applied. These scripts are on a unix system, and it would be simple enough to put some date-enabling at the front end to make this useful in a cron. That exercise, as they say, is left to the reader.
wget http://ge.ssec.wisc.edu/viirs-today/images/noaa20/true_color/2020_08_03_216/n2.20216.USA3.143.1000m.jpg

wget http://ge.ssec.wisc.edu/viirs-today/images/noaa20/true_color/2020_08_03_216/n2.20216.USA4.143.1000m.jpg

convert -crop 950x1100+351+101 n2.20216.USA3.143.1000m.jpg test1_1000.jpg

convert -crop 700x1100+0+101 n2.20216.USA4.143.1000m.jpg test2_1000.jpg

convert test1_1000.jpg test2_1000.jpg +append n2.20216.GreatLakes.143.1000m.jpg
wget http://ge.ssec.wisc.edu/viirs-today/images/noaa20/true_color/2020_08_03_216/n2.20216.USA3.143.250m.jpg

wget http://ge.ssec.wisc.edu/viirs-today/images/noaa20/true_color/2020_08_03_216/n2.20216.USA4.143.250m.jpg

convert -crop 3800x4400+1401+401 n2.20216.USA3.143.250m.jpg test1_250.jpg

convert -crop 2800x4400+0+401 n2.20216.USA4.143.250m.jpg test2_250.jpg

convert test1_250.jpg test2_250.jpg +append n2.20216.GreatLakes.143.250m.jpg
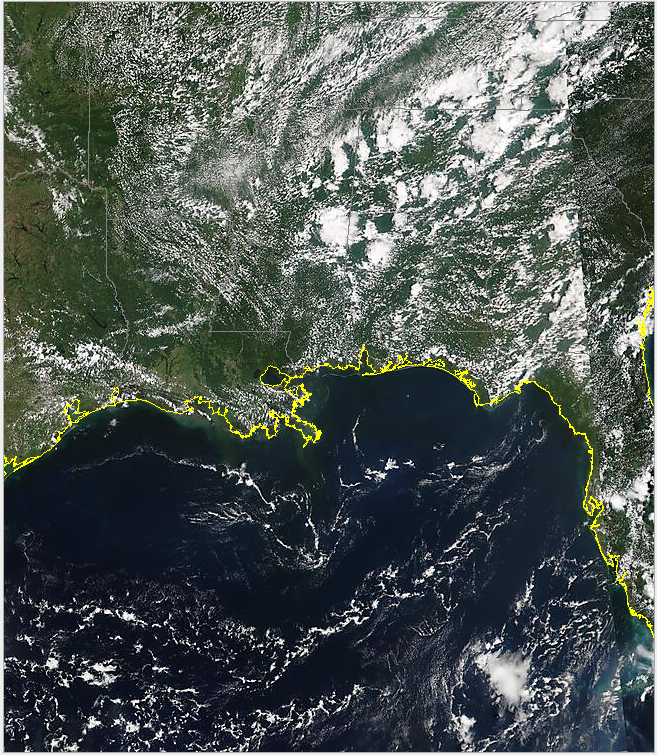
The 1-km resolution True-Color imagery from NOAA-20 (‘n2’ in the file name; ‘n1’ is Suomi-NPP) for the Great Lakes on day 216 of the years 2020 (i.e., 3 August 2016, represented as 20216 in the url) is shown above; it spans sectors USA3 and USA4. The 250-m resolution image is here.
From an email received from South Carolina: Our area is always split between USA7 and USA8, making it hard to use the sectorized imagery.
A script for that region, in this case for Day Night Band imagery, is below. This script accesses both Suomi-NPP and NOAA-20 data.
wget http://ge.ssec.wisc.edu/viirs-today/images/noaa20/night_dynamic/2020_08_05_218/n2.20218.USA8.DNBD.1000m.jpg

wget http://ge.ssec.wisc.edu/viirs-today/images/noaa20/night_dynamic/2020_08_05_218/n2.20218.USA7.DNBD.1000m.jpg

convert -crop 800x750+501+0  n2.20218.USA7.DNBD.1000m.jpg test1_1000.jpg

convert -crop 800x750+0+0 n2.20218.USA8.DNBD.1000m.jpg test2_1000.jpg

convert test1_1000.jpg test2_1000.jpg +append n2.20218.SOUTHCAROLINA.DNBD.1000m.jpg

wget http://ge.ssec.wisc.edu/viirs-today/images/snpp/night_dynamic/2020_08_05_218/n1.20218.USA8.DNBD.1000m.jpg

wget http://ge.ssec.wisc.edu/viirs-today/images/snpp/night_dynamic/2020_08_05_218/n1.20218.USA7.DNBD.1000m.jpg

convert -crop 800x750+501+0  n1.20218.USA7.DNBD.1000m.jpg test1_1000.jpg

convert -crop 800x750+0+0 n1.20218.USA8.DNBD.1000m.jpg test2_1000.jpg

convert test1_1000.jpg test2_1000.jpg +append n1.20218.SOUTHCAROLINA.DNBD.1000m.jpg
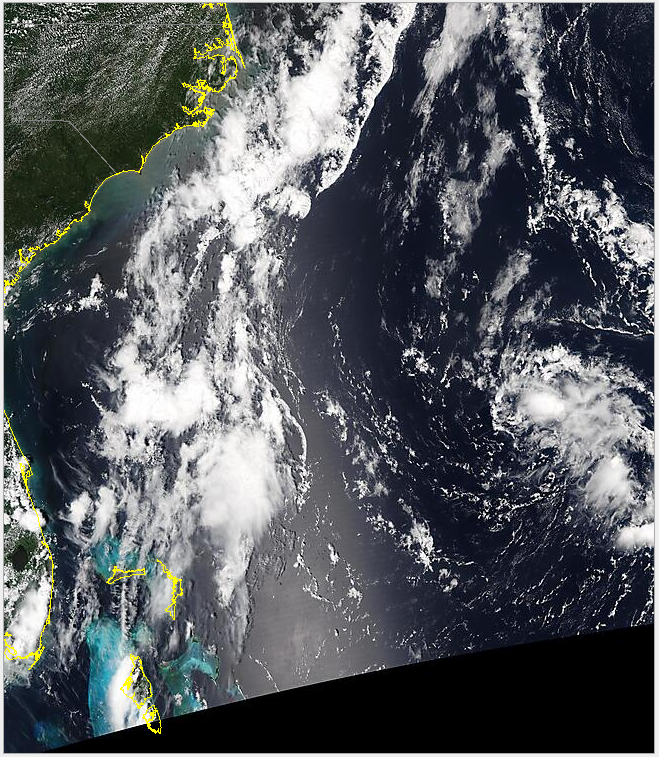
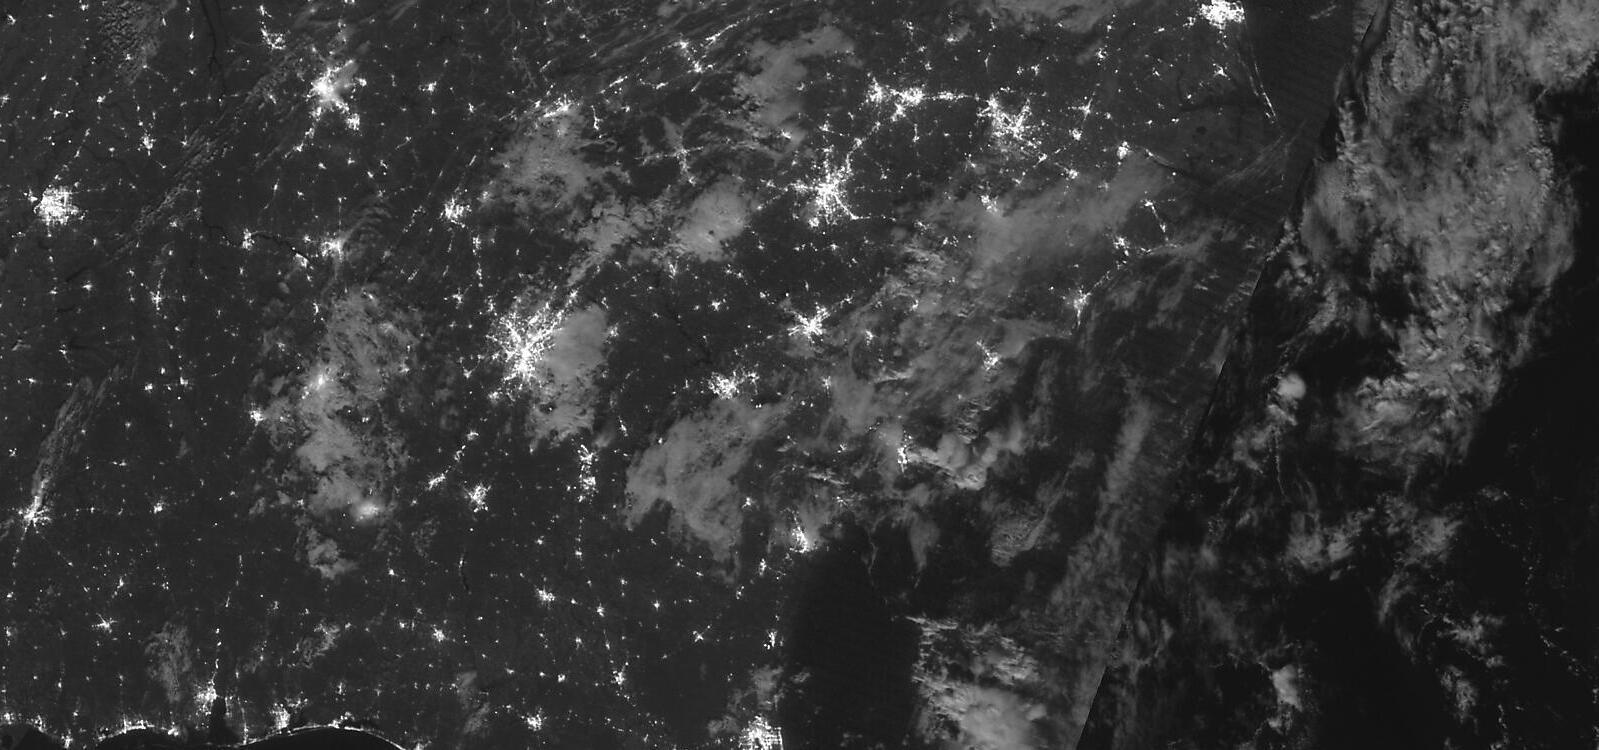
The Day Night Band Composite from NOAA-20 is shown below. Click here to see the Suomi-NPP image.
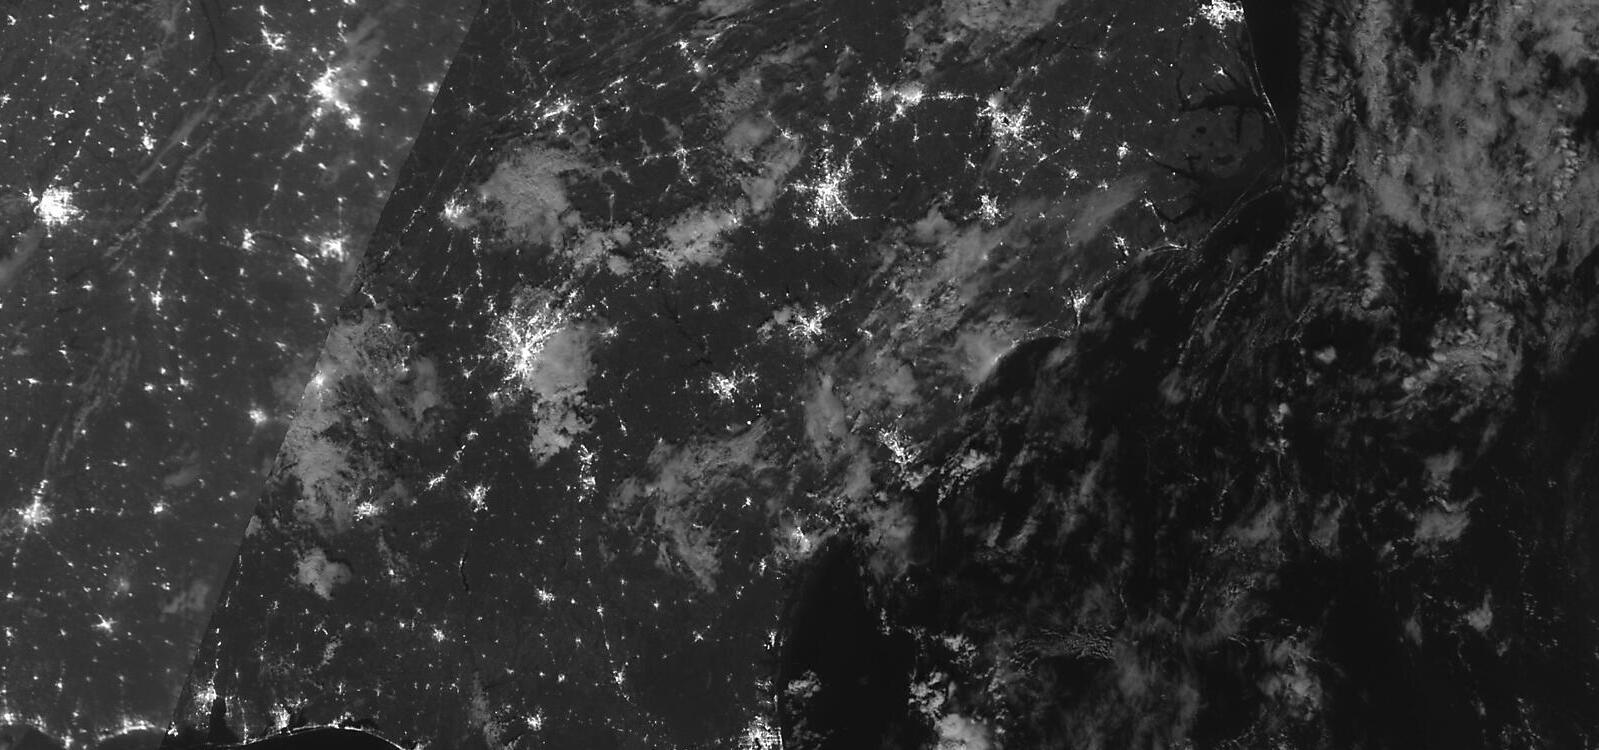
NOAA-20 Day Night Band composite, 5 August 2020 (Click to enlarge)
This technique would work with MODIS Today imagery as well.
View only this post
Read Less
![GOES-16 “Red” Visible (0.64 µm) and “Clean” Infrared Window (10.35 µm) images [click to play animation | MP4]](https://cimss.ssec.wisc.edu/satellite-blog/images/2020/08/200808_goes16_visible_infrared_MN_severe_anim.gif)
![GOES-16 “Red” Visible (0.64 µm) images, with SPC Storm Reports plotted in red [click to play animation | MP4]](https://cimss.ssec.wisc.edu/satellite-blog/images/2020/08/200808_goes16_visible_spcStormReports_MN_anim.gif)
![GOES-16 “Clean” Infrared Window (10.35 µm) images, with SPC Storm Reports plotted in cyan [click to play animation | MP4]](https://cimss.ssec.wisc.edu/satellite-blog/images/2020/08/200808_goes16_infrared_spcStormReports_MN_anim.gif)
![NOAA-20 VIIRS Infrared Window (11.45 µm) and GOES-16 “Clean” Infrared Window (10.35 µm) images [click to enlarge]](https://cimss.ssec.wisc.edu/satellite-blog/images/2020/08/200808_1918utc_noaa20_goes16_infrared_MN_anim.gif)
![GOES-16 Infrared image, with parallax displacement vectors (green) and magnitudes (red, in km) [click to enlarge]](https://cimss.ssec.wisc.edu/satellite-blog/images/2020/08/200808_goes16_parallax.png)
![VIIRS True Color RGB images from Suomi NPP and NOAA-20 [click to enlarge]](https://cimss.ssec.wisc.edu/satellite-blog/images/2020/08/200807_suomiNPP_noaa20_viirs_trueColorRGB_Africa_blowing_dust_anim.gif)
![Meteosat-11 Visible (0.6 µm) images [click to play animation | MP4]](https://cimss.ssec.wisc.edu/satellite-blog/images/2020/08/200807_meteosat11_visible_Africa_anim.gif)
![Plot of surface data from Luderitz, Namibia [click to enlarge]](https://cimss.ssec.wisc.edu/satellite-blog/images/2020/08/200807_FYLZ_SFCMG.GIF)
