![Plot of rawinsonde data from Anchorage, Alaska [click to enlarge]](https://cimss.ssec.wisc.edu/satellite-blog/wp-content/uploads/sites/5/2019/08/190814_00UTC_PANC_RAOB.GIF)
Plot of rawinsonde data from Anchorage, Alaska [click to enlarge]
![Plot of rawinsonde data from Fairbanks, Alaska [click to enlarge]](https://cimss.ssec.wisc.edu/satellite-blog/wp-content/uploads/sites/5/2019/08/190814_00UTC_PAFA_RAOB.GIF)
Plot of rawinsonde data from Fairbanks, Alaska [click to enlarge]
The 0 UTC upper air sounding for Anchorage had a precipitable water value of 1.76″. This easily exceeds the previous all-time record of 1.67″ Aug 26, 1990. @AlaskaWx
— Brian Brettschneider (@Climatologist49) August 14, 2019
The 0 UTC upper air sounding for Fairbanks had a precipitable water value of 1.59″. This exceeds the previous all-time record of 1.57″ July 13, 1971. @AlaskaWx
— Brian Brettschneider (@Climatologist49) August 14, 2019
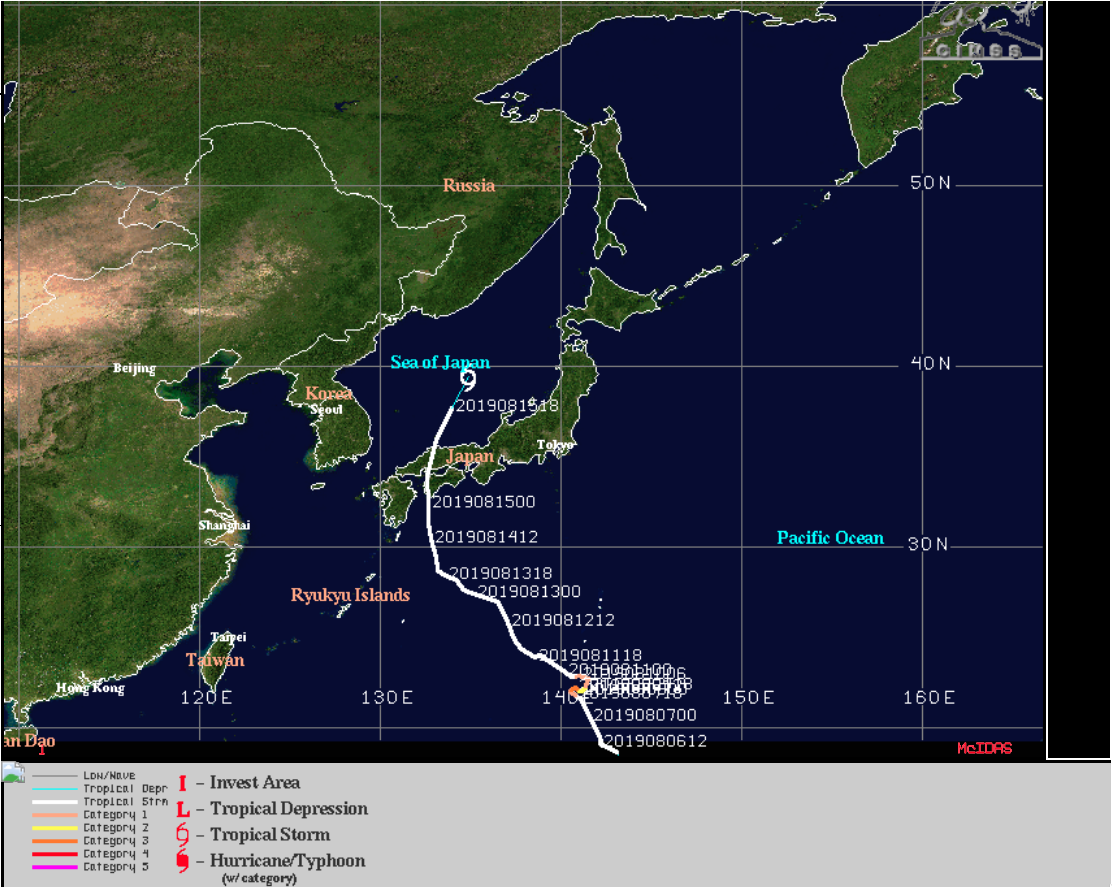
The microwave-based MIMIC TPW product (below) showed an atmospheric river of moisture moving northeastward toward Alaska during the 2 days leading up to the record-setting TPW values on the Anchorage and Fairbanks soundings. The global view suggested that some of this moisture may have originated from the northern periphery of the TPW reservoir associated with slow-moving Typhoon Krosa in the West Pacific Ocean, being transported eastward then northeastward by a series of frontal waves (surface analyses).
![MIMIC Total Precipitable Water [click to play animation | MP4]](https://cimss.ssec.wisc.edu/satellite-blog/wp-content/uploads/sites/5/2019/08/190811_190814_mimicTPW_global_anim.gif)
MIMIC Total Precipitable Water [click to play animation | MP4]
![MIMIC Total Precipitable Water [click to play animation | MP4]](https://cimss.ssec.wisc.edu/satellite-blog/wp-content/uploads/sites/5/2019/08/190811_190814_mimicTPW_AK_anim.gif)
MIMIC Total Precipitable Water [click to play animation | MP4]
View only this post Read Less
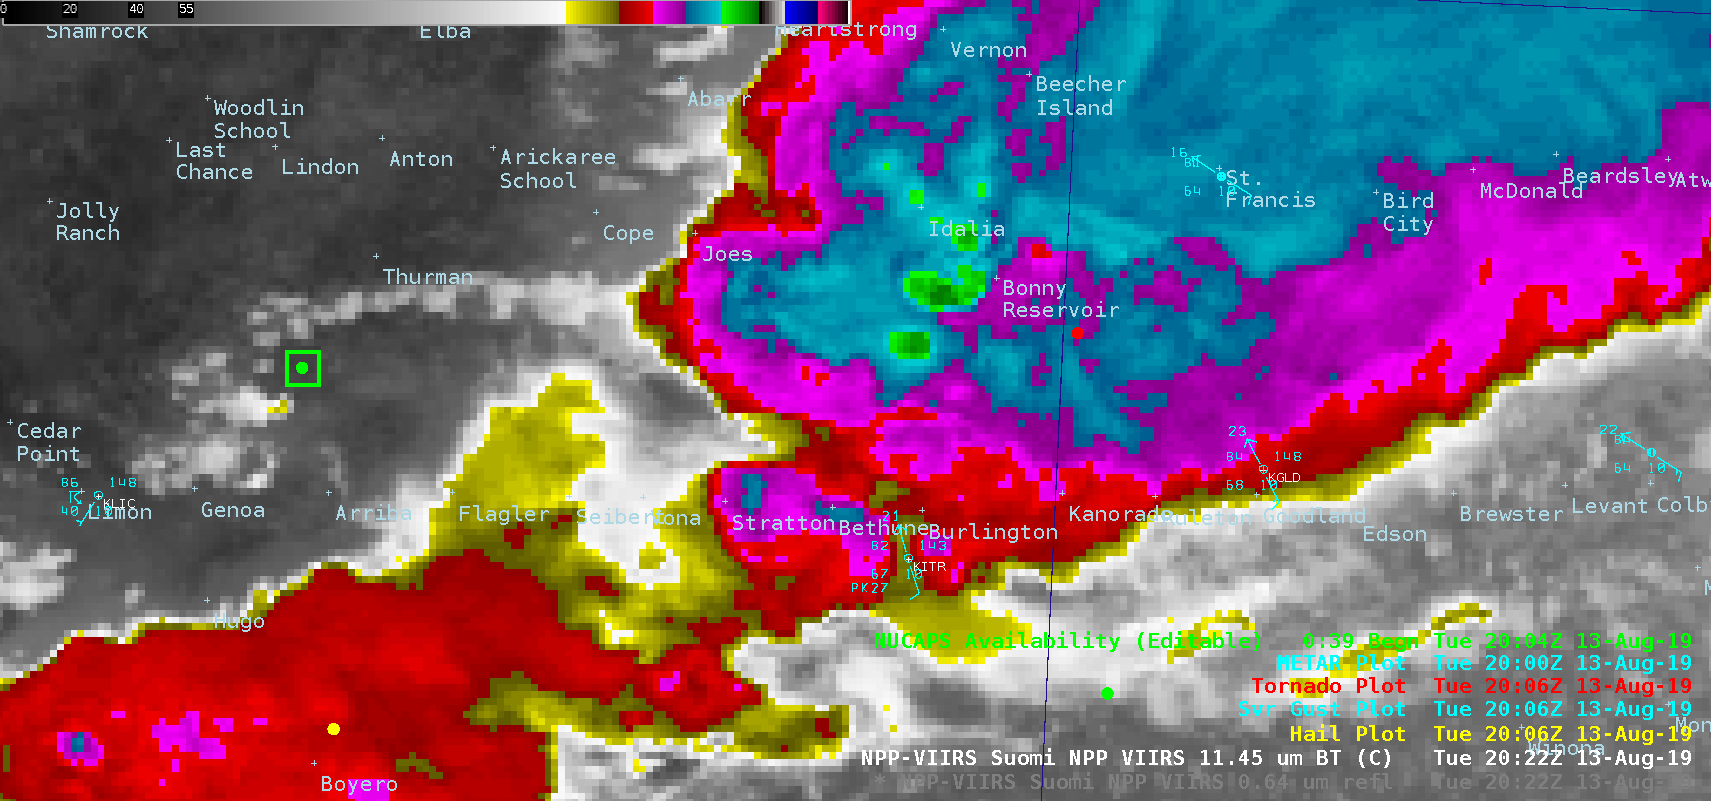
![NOAA-20 Visible (0.64 µm) and Infrared Window (11.45 µm) images, with NUCAPS sounding locations and surface reports [click to enlarge]](https://cimss.ssec.wisc.edu/satellite-blog/wp-content/uploads/sites/5/2019/08/190813_2022utc_noaa20_viirs_visible_infrared_nucaps_CO_KS_anim.gif)
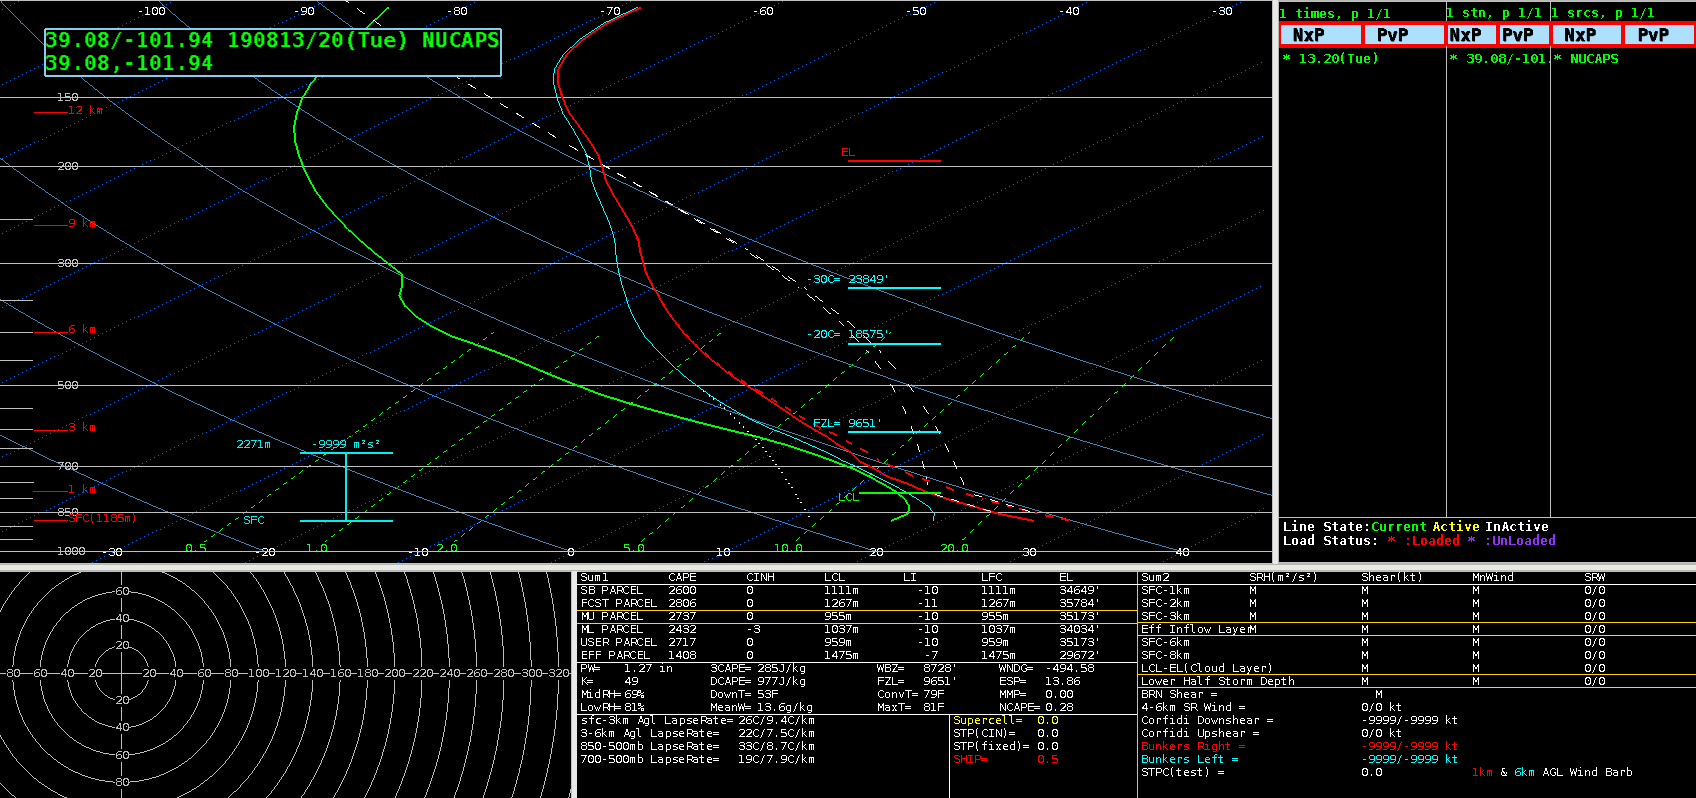
![NOAA-20 NUCAPS profile in eastern Colorado [click to enlarge]](https://cimss.ssec.wisc.edu/satellite-blog/wp-content/uploads/sites/5/2019/08/190813_20utc_co_nucaps_profile_orig.png)
![NOAA-19 AVHRR Visible (0.63 µm) and Infrared Window (10.8 µm) images [click to enlarge]](https://cimss.ssec.wisc.edu/satellite-blog/wp-content/uploads/sites/5/2019/08/190810_2315utc_noaa15_190811_0113utc_noaa19_0243utc_noaa15_visible_infrared_Arctic_lightning_anim.gif)
![VIIRS True Color RGB and Infrared Window (11.45 µm) images from Suomi NPP and NOAA-20 [click to enlarge]](https://cimss.ssec.wisc.edu/satellite-blog/wp-content/uploads/sites/5/2019/08/190808_suomiNPP_noaa20_trueColor_infraredWindow_Typhoon_Lekima_anim.gif)
![Himawari-8 Infrared (10.4 µm) images [click to play animation| MP4]](https://cimss.ssec.wisc.edu/satellite-blog/wp-content/uploads/sites/5/2019/08/190807_190808_himawari8_infrared_Typhoon_Lekima_anim.gif)
![Himawari-8 "Clean" Infrared Window (10.4 µm) images, with contours and streamlines of deep-layer wind shear at 15 UTC [click to play animation]](https://cimss.ssec.wisc.edu/satellite-blog/wp-content/uploads/sites/5/2019/08/190808_himawari8_infrared_deepLayerWindShear_Lekima_anim.gif.gif)
