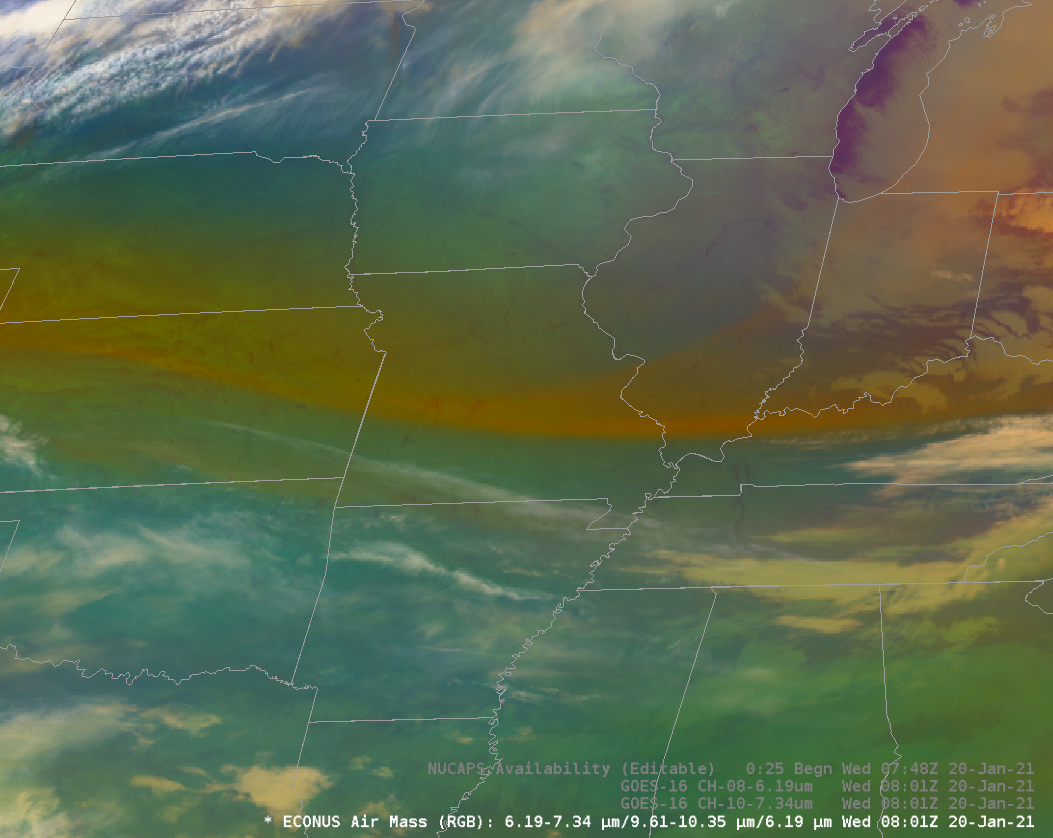

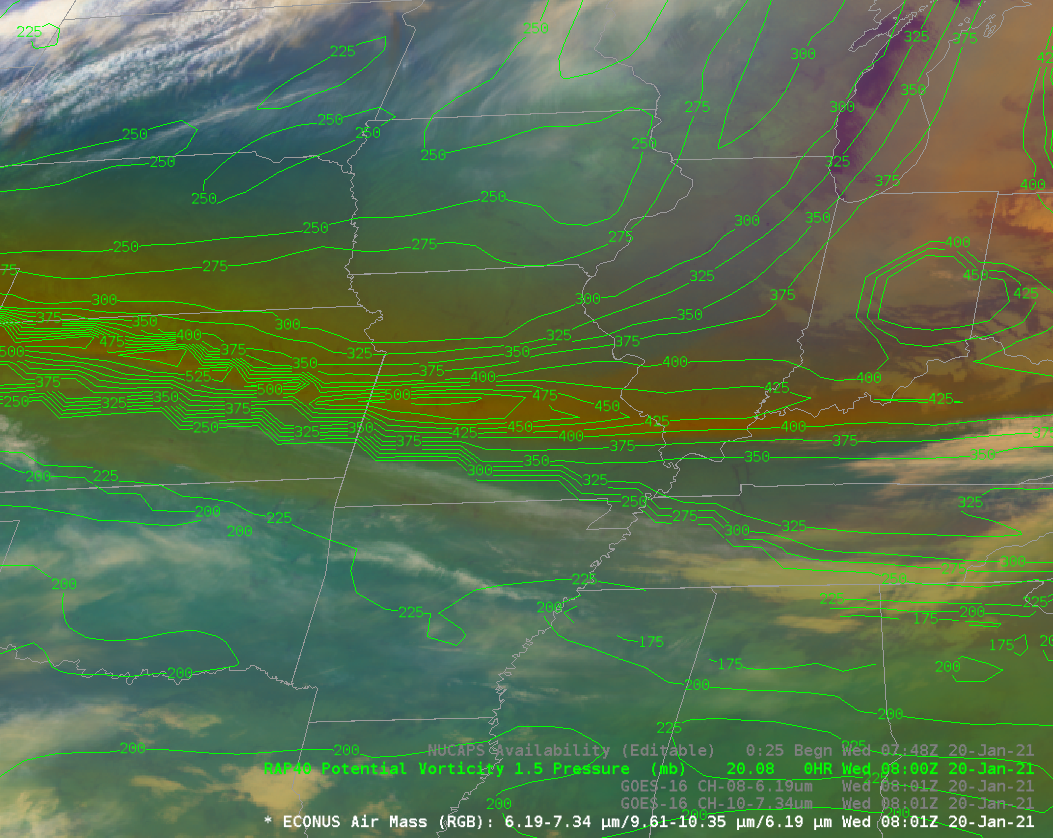
GOES-16 ABI Airmass RGB, Band 10 and Band 8 (7.34 µm and 6.19 µm, respectively), and GOES-16 Airmass RGB overlain with NUCAPS sounding availability plots, 0801 UTC oni 20 January 2021 (click to enlarge)
The AirMass RGB from GOES-16 at 0800 UTC on 20 January 2021 showed a distinct color change across central Missouri, from red to green. The enhanced red coloring suggests a large difference in water vapor brightness temperatures. The toggle above (including an image with NUCAPS* sounding points), shows structures in the water vapor imagery consistent with an upper tropospheric front.
Water Vapor and Airmass RGB imagery fields are useful because they be compared to model fields of the tropopause, and similarities in model fields and satellite imagery lend credence to the idea that the model initialization is accurate. Compare the Airmass RGB and the Rapid Refresh mapping of the pressure on the 1.5 PVU surface below. There is good spatial correlation between model and satellite fields.

GOES-16 Airmass RGB and Rapid Refresh model field of Pressure on the 1.5 PVU surface, 0800 UTC 20 January 2021 (Click to enlarge)
How do vertical profiles from NUCAPS vary across the tropopause fold? The animation below shows six different profile in Missouri and Arkansas, spanning the reddish region of the airmass RGB.
GOES-16 Airmass RGB image with selected NUCAPS profiles, as indicated. (Click to enlarge)
A more efficient way to view information from NUCAPS is to view gridded fields. Polar2Grid is used to transform the vertical profile to horizontal fields at the individual NUCAPS pressure levels (and then vertical interpolation moves those fields to standard levels). The animations below show gridded values that are all in agreement with the presence of a tropopause fold where the Airmass RGB and model fields suggest. Gridded temperature and moisture can be combined in many ways. Gridded Ozone is also available in AWIPS (some of these fields were created using the Product Browser).
Ozone from NUCAPS, below, does show an enhancement, as expected, in the region where the tropopause fold is suggested by the airmass RGB.
NUCAPS-derived ozone anomalies, ca. 0800 UTC on 20 January 2021 (Click to enlarge)
The gridded NUCAPS tropopause level, shown below, can also be inferred from the individual profiles shown above.
Gridded NUCAPS Tropopause level, ca. 0800 UTC on 20 January 2021 (click to enlarge)
Note how the lapse rates show relatively less stable air (in the mid-troposphere) in the region of the tropopause fold.

Gridded 500-700 mb Lapse rates, ca. 0800 UTC on 20 January 2021 (click to enlarge)
Mixing ratio shows dry mid- and upper-tropospheric air, in the region of the tropopause fold, as might be expected from the GOES-16 water vapor imagery.
Gridded NUCAPS esimates of 300-700 mb mixing ratio, ca. 0800 UTC on 20 January 2021 (Click to enlarge)
In general, NUCAPS data can be used to augment other satellite and model data to better understand the thermodynamic structure of the atmosphere. For more information on NUCAPS profiles, refer to this training video.
*The careful reader will note that the timestamp of the NUCAPS Sounding Availability plot, 0753 UTC, is different from the GOES-16 imagery. Why? The NUCAPS Sounding Availability plot is timestamped (approximately) when NOAA-20 initially overflies North American airspace. NOAA-20 was flying over Missouri shortly after 0800 UTC, as shown in this plot (from this website). Gridded NUCAPS fields are timestamped when NOAA-20 is overhead.
View only this post Read Less
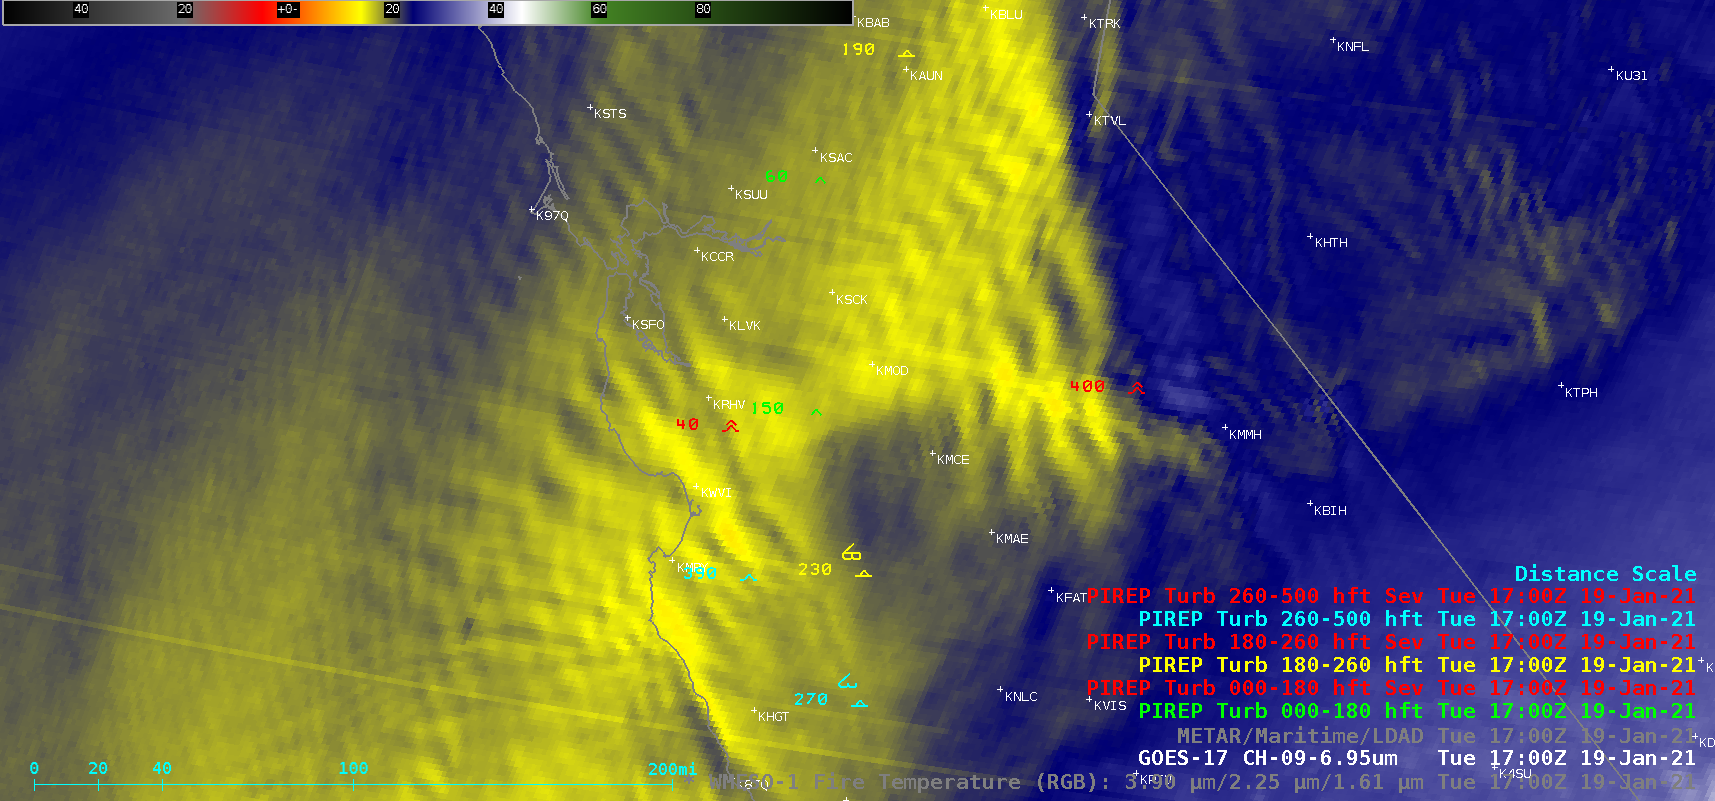
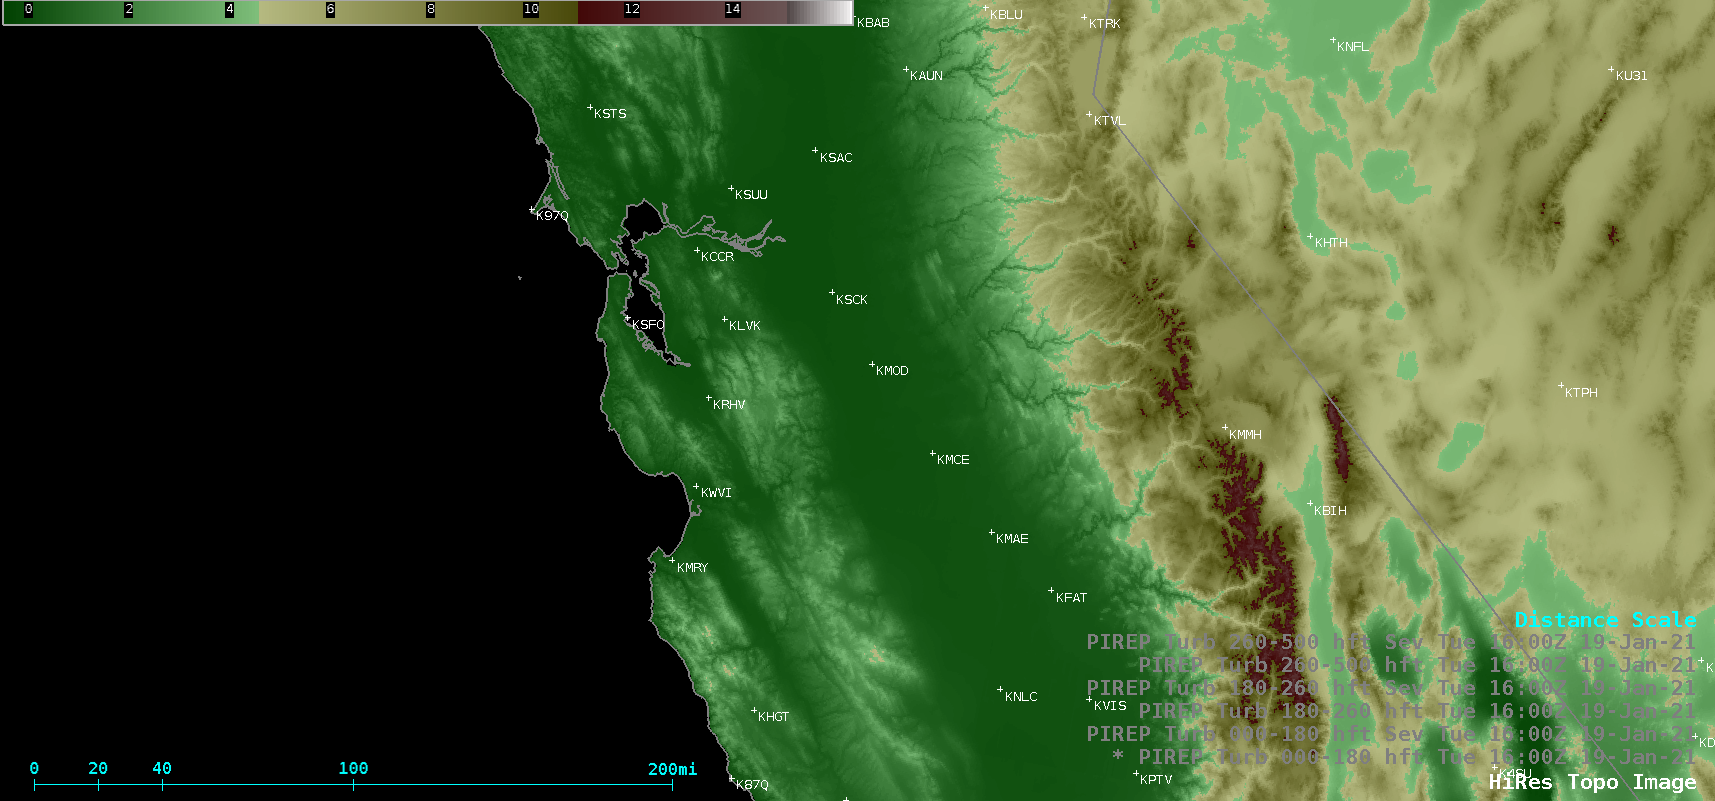
![GOES-17 Mid-level Water Vapor (6.9 µm) images, with Pilot Reports of turbulence [click to play animation | MP4]](https://cimss.ssec.wisc.edu/satellite-blog/images/2021/01/210119_goes17_waterVapor_pireps_CA_anim.gif)
![GOES-17 Mid-level Water Vapor (6.9 µm) images, with plots of NAM40 model 500 hPa wind streamlines/isotachs at 18 UTC and 00 UTC [click to enlarge]](https://cimss.ssec.wisc.edu/satellite-blog/images/2021/01/210119_goes17_waterVapor_500hPaWinds_CA_anim.gif)
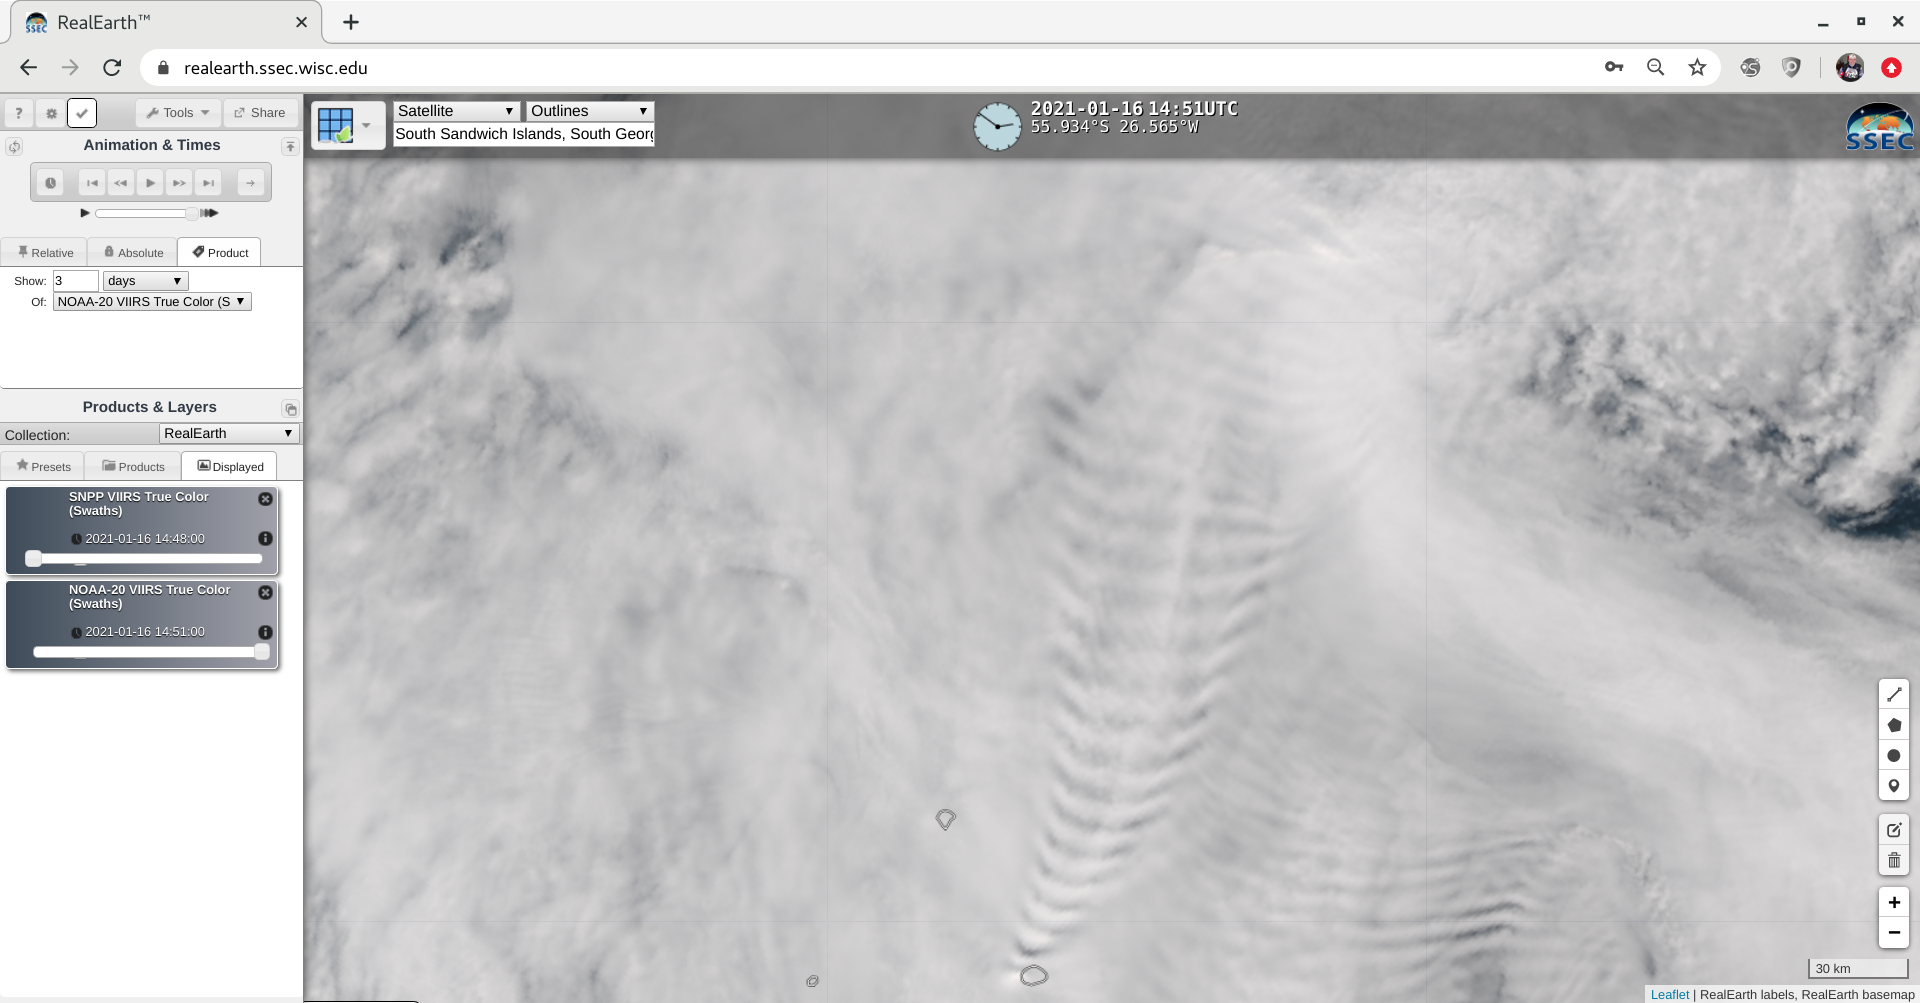
![GOES-16 "Red" Visible (0.64 µm) images [click to play animation | MP4]](https://cimss.ssec.wisc.edu/satellite-blog/images/2021/01/210116_goes16_visible_South_Sandwich_Islands_lee_waves_anim.gif)
![NOAA-20 VIIRS True Color RGB images [click to enlarge]](https://cimss.ssec.wisc.edu/satellite-blog/images/2021/01/210116_noaa20_viirs_trueColorRGB_South_Sandwich_Islands_lee_waves_anim.gif)
![NOAA-20 VIIRS True Color RGB images [click to enlarge]](https://cimss.ssec.wisc.edu/satellite-blog/images/2021/01/210116_noaa20_viirs_trueColorRGB_South_Sandwich_Islands_lee_waves_zoom_anim.gif)
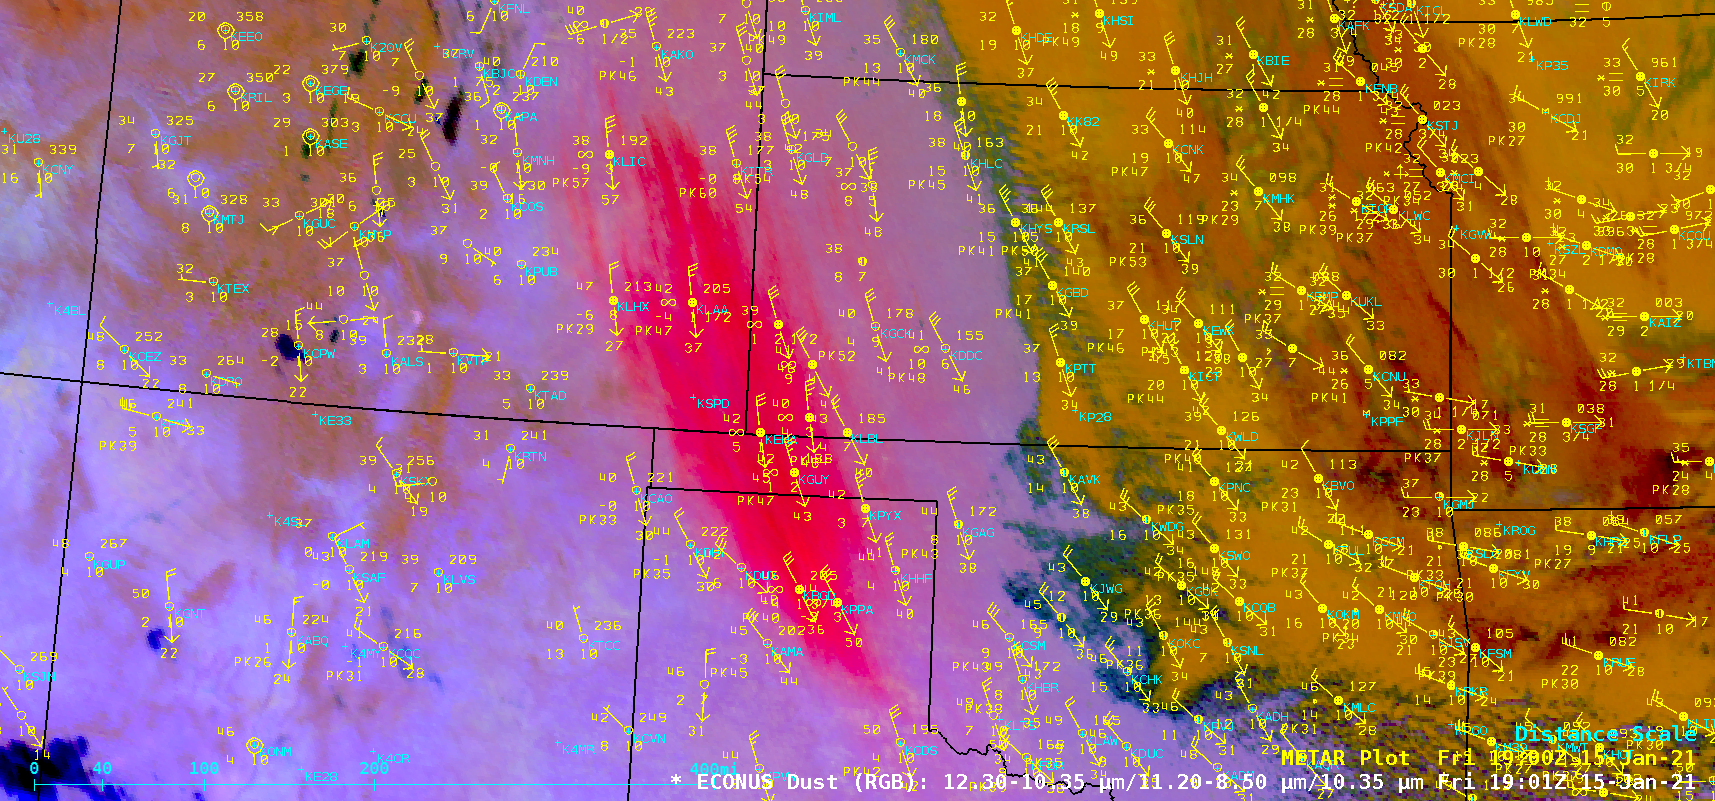
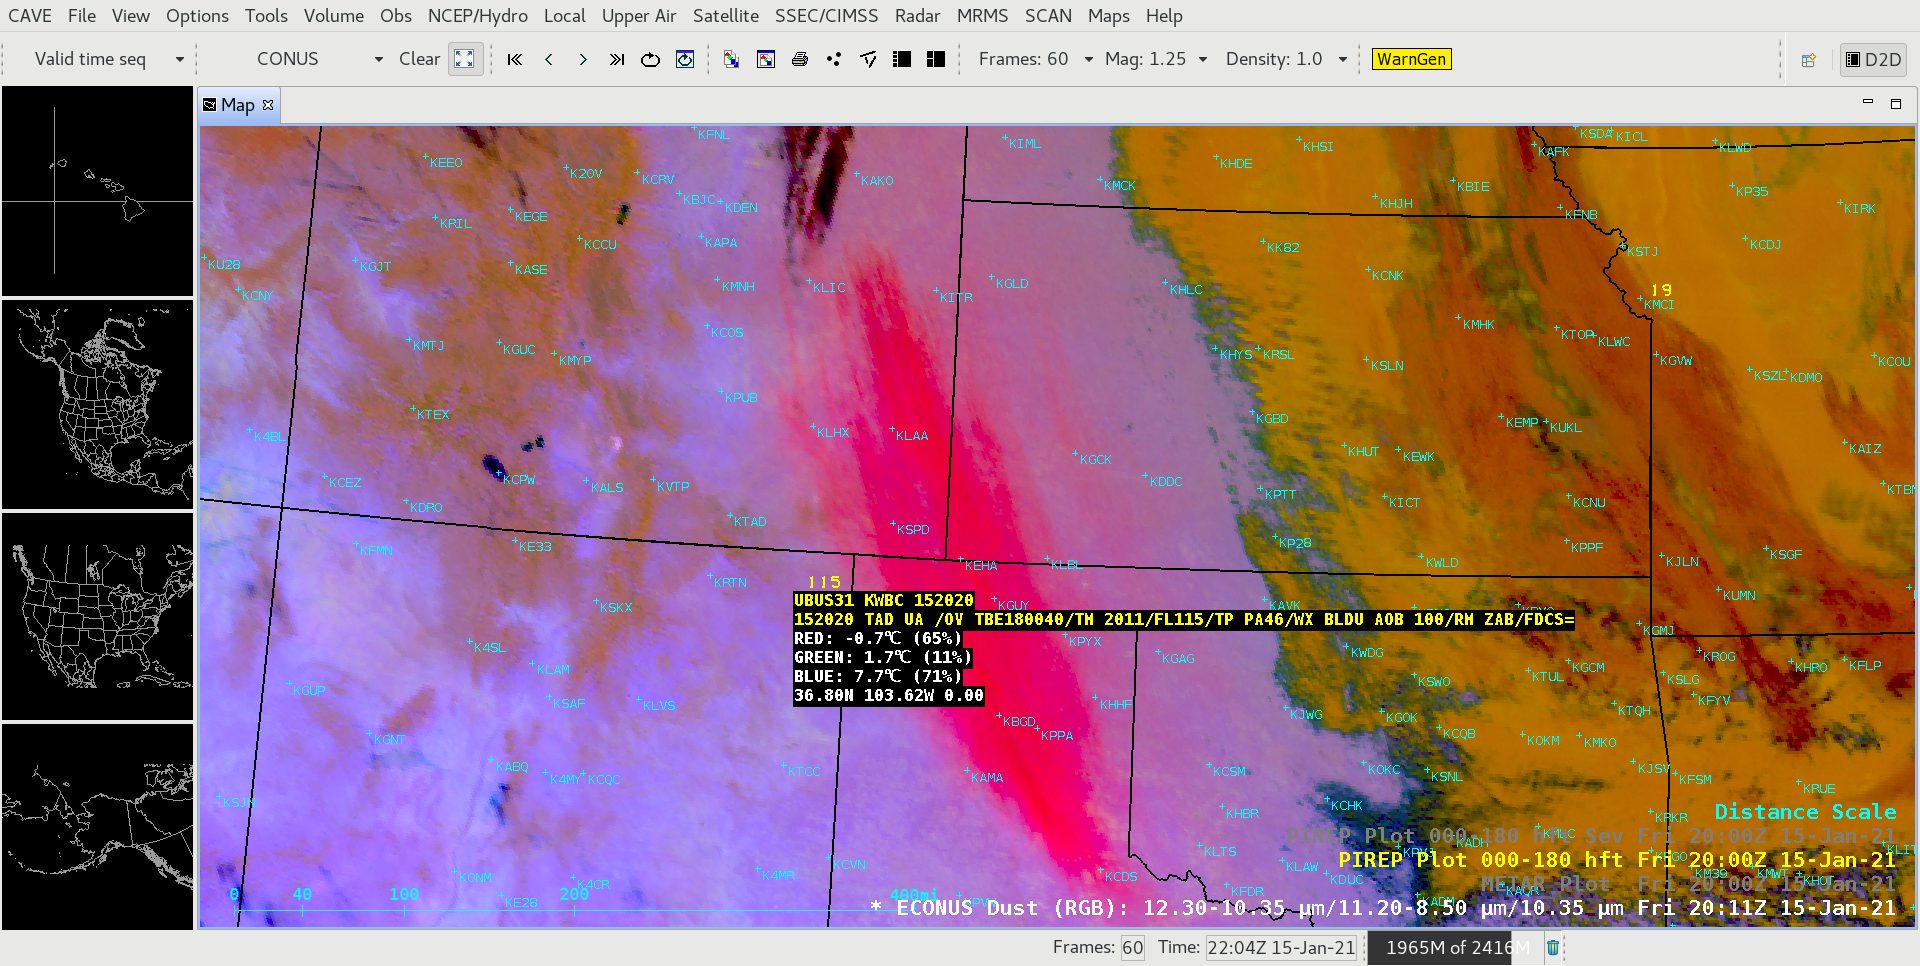
![GOES-16 Dust RGB images, with and without hourly surface reports [click to play animation | MP4]](https://cimss.ssec.wisc.edu/satellite-blog/images/2021/01/210115_goes16_dustRGB_CO_KS_OK_TX_anim.gif)
![GOES-16 Dust RGB and True Color RGB images [click to play animation | MP4]](https://cimss.ssec.wisc.edu/satellite-blog/images/2021/01/210115_goes16_trueColorRGB_dustRGB_Plains_blowing_dust_anim.gif)

![GOES-16 Dust RGB images, with and without hourly surface reports [click to play animation | MP4]](https://cimss.ssec.wisc.edu/satellite-blog/images/2021/01/210115_goes16_dustRGB_3_CO_KS_OK_TX_anim.gif)
![GOES-16 Dust RGB and True Color RGB images [click to play animation | MP4]](https://cimss.ssec.wisc.edu/satellite-blog/images/2021/01/210116_goes16_dustRGB_trueColorRGB_TX_Gulf_of_Mexico_dust_plume_anim.gif)
![GOES-16 Natural Color RGB images, with plots of Ceiling and Visibility [click to play animation| MP4]](https://cimss.ssec.wisc.edu/satellite-blog/images/2021/01/210116_goes16_cimssNaturalColorGB_TX_Gulf_of_Mexico_dust_plume_anim.gif)
![VIIRS True Color and False Color RGB images from Suomi NPP [click to enlarge]](https://cimss.ssec.wisc.edu/satellite-blog/images/2021/01/210116_1911utc_suomiNPP_viirs_trueColorRGB_falseColorGB_TX_Gulf_of_Mexico_blowing_dust_anim.gif)
