Just one week after a deadly tornado outbreak across the Deep South, 1-minute Mesoscale Domain Sector GOES-16 (GOES-East) “Red” Visible (0.64 µm) and “Clean” Infrared Window (10.35 µm) with time-matched plots of SPC Storm Reports (above) showed the development of thunderstorms over Louisiana that crossed the Mississippi border and went on to produce a long-track tornado that produced... Read More
GOES-16 “Red” Visible (0.64 µm, top) and “Clean” Infrared Window (10.35 µm, bottom), with plots of SPC Storm Reports [click to play animation | MP4]
Just one week after a
deadly tornado outbreak across the Deep South, 1-minute
Mesoscale Domain Sector GOES-16
(GOES-East) “Red” Visible (
0.64 µm) and “Clean” Infrared Window (
10.35 µm) with time-matched plots of
SPC Storm Reports (above) showed the development of thunderstorms over Louisiana that crossed the Mississippi border and went on to produce a long-track tornado that produced EF-4 damage on
19 April 2020. Pulsing updraft behavior and the appearance of an
Above-Anvil Cirrus Plume was observed with 2 of the thunderstorms as they moved across far southern Mississippi.
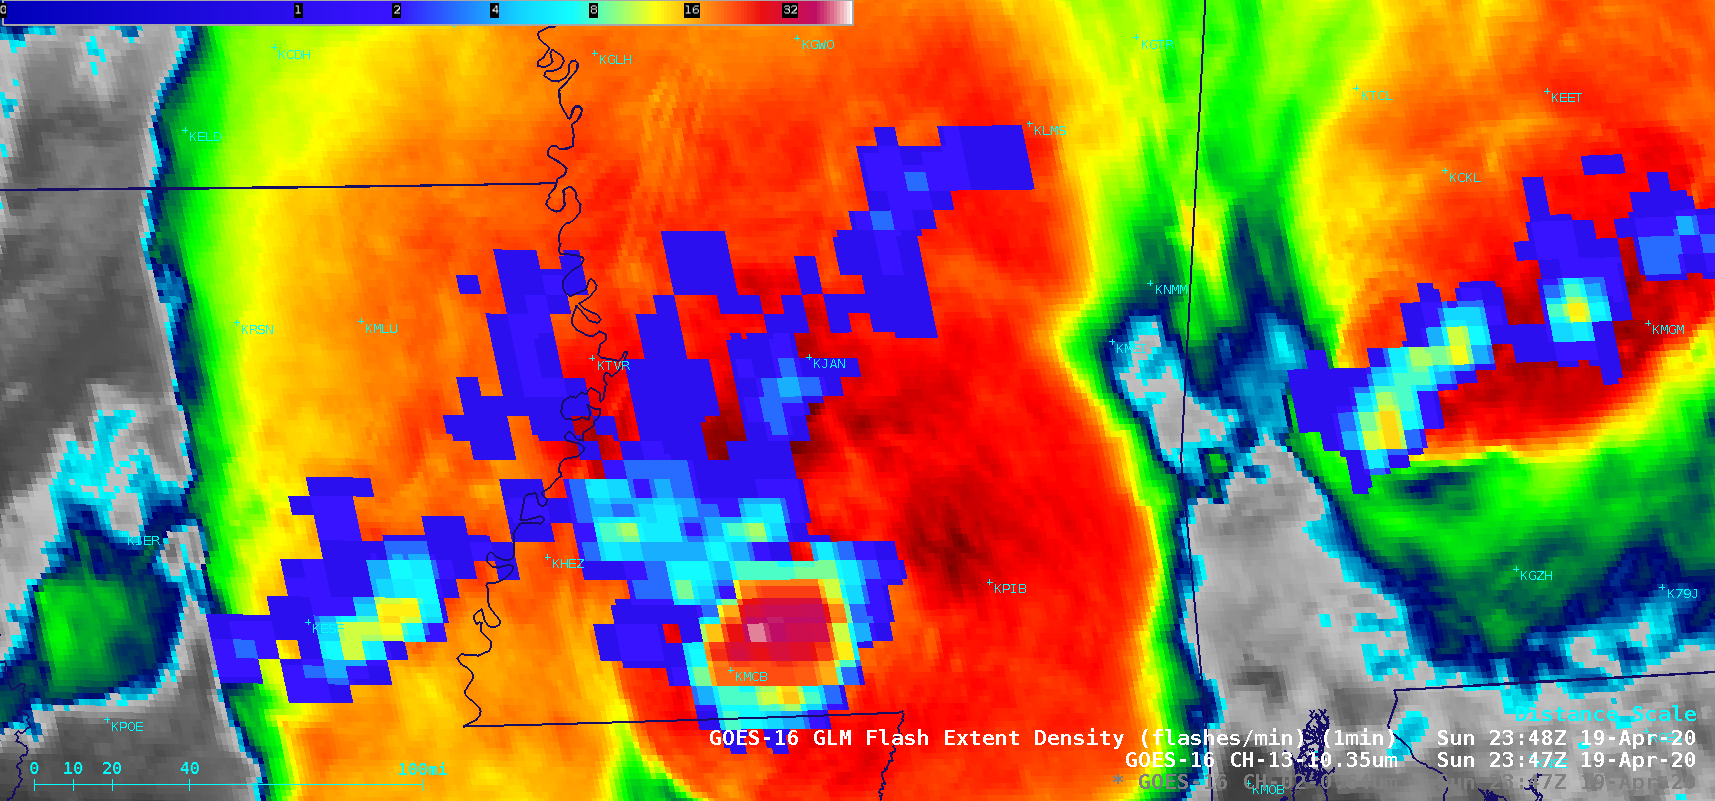
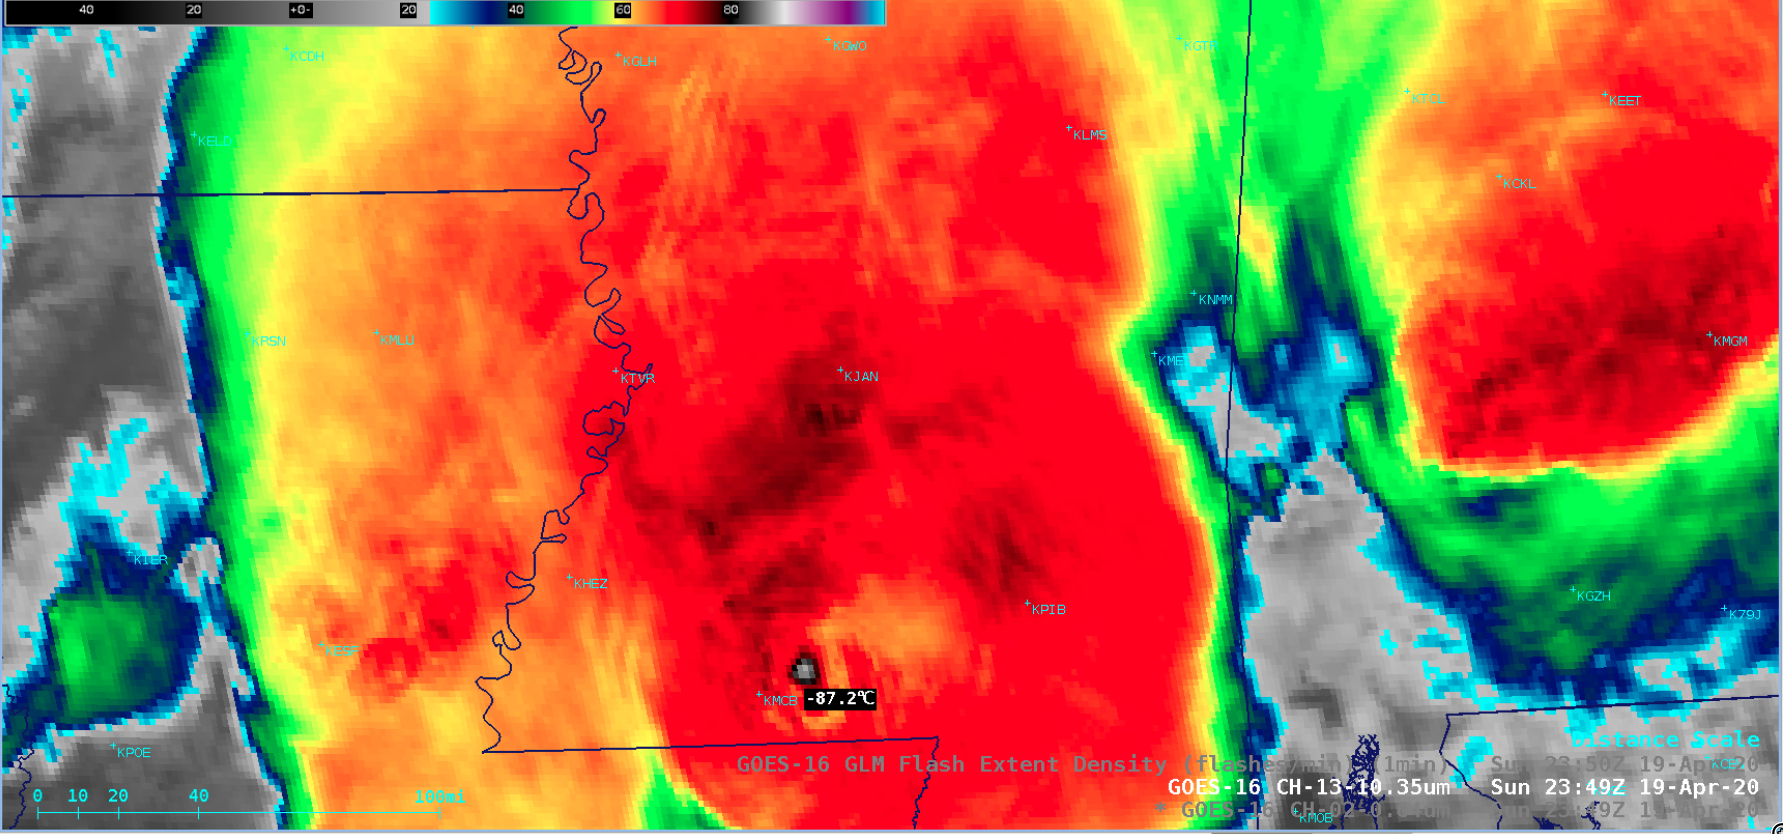
Focusing on the 10-minute period 2340-2350 UTC, a sequence of GOES-16 Visible, Infrared and GLM Flash Extent Density (below) revealed a well-defined overshooting top turret which exhibited a minimum infrared brightness temperature of -87.2ºC at 2349 UTC — and a lightning jump where the FED increased to 44 flashes per minute at 2348 UTC. The long-track tornado began about 20 minutes later, at 0010 UTC on 20 April.
![GOES-16 "Red" Visible (0.64 µm), "Clean" Infrared Window (10.35 µm) and GLM Flash Extent Density [click to play animation | MP4]](https://cimss.ssec.wisc.edu/satellite-blog/images/2020/04/msv_ir2_fed-20200419_234751.png)
GOES-16 “Red” Visible (0.64 µm), “Clean” Infrared Window (10.35 µm) and GLM Flash Extent Density [click to play animation | MP4]
View only this post
Read Less
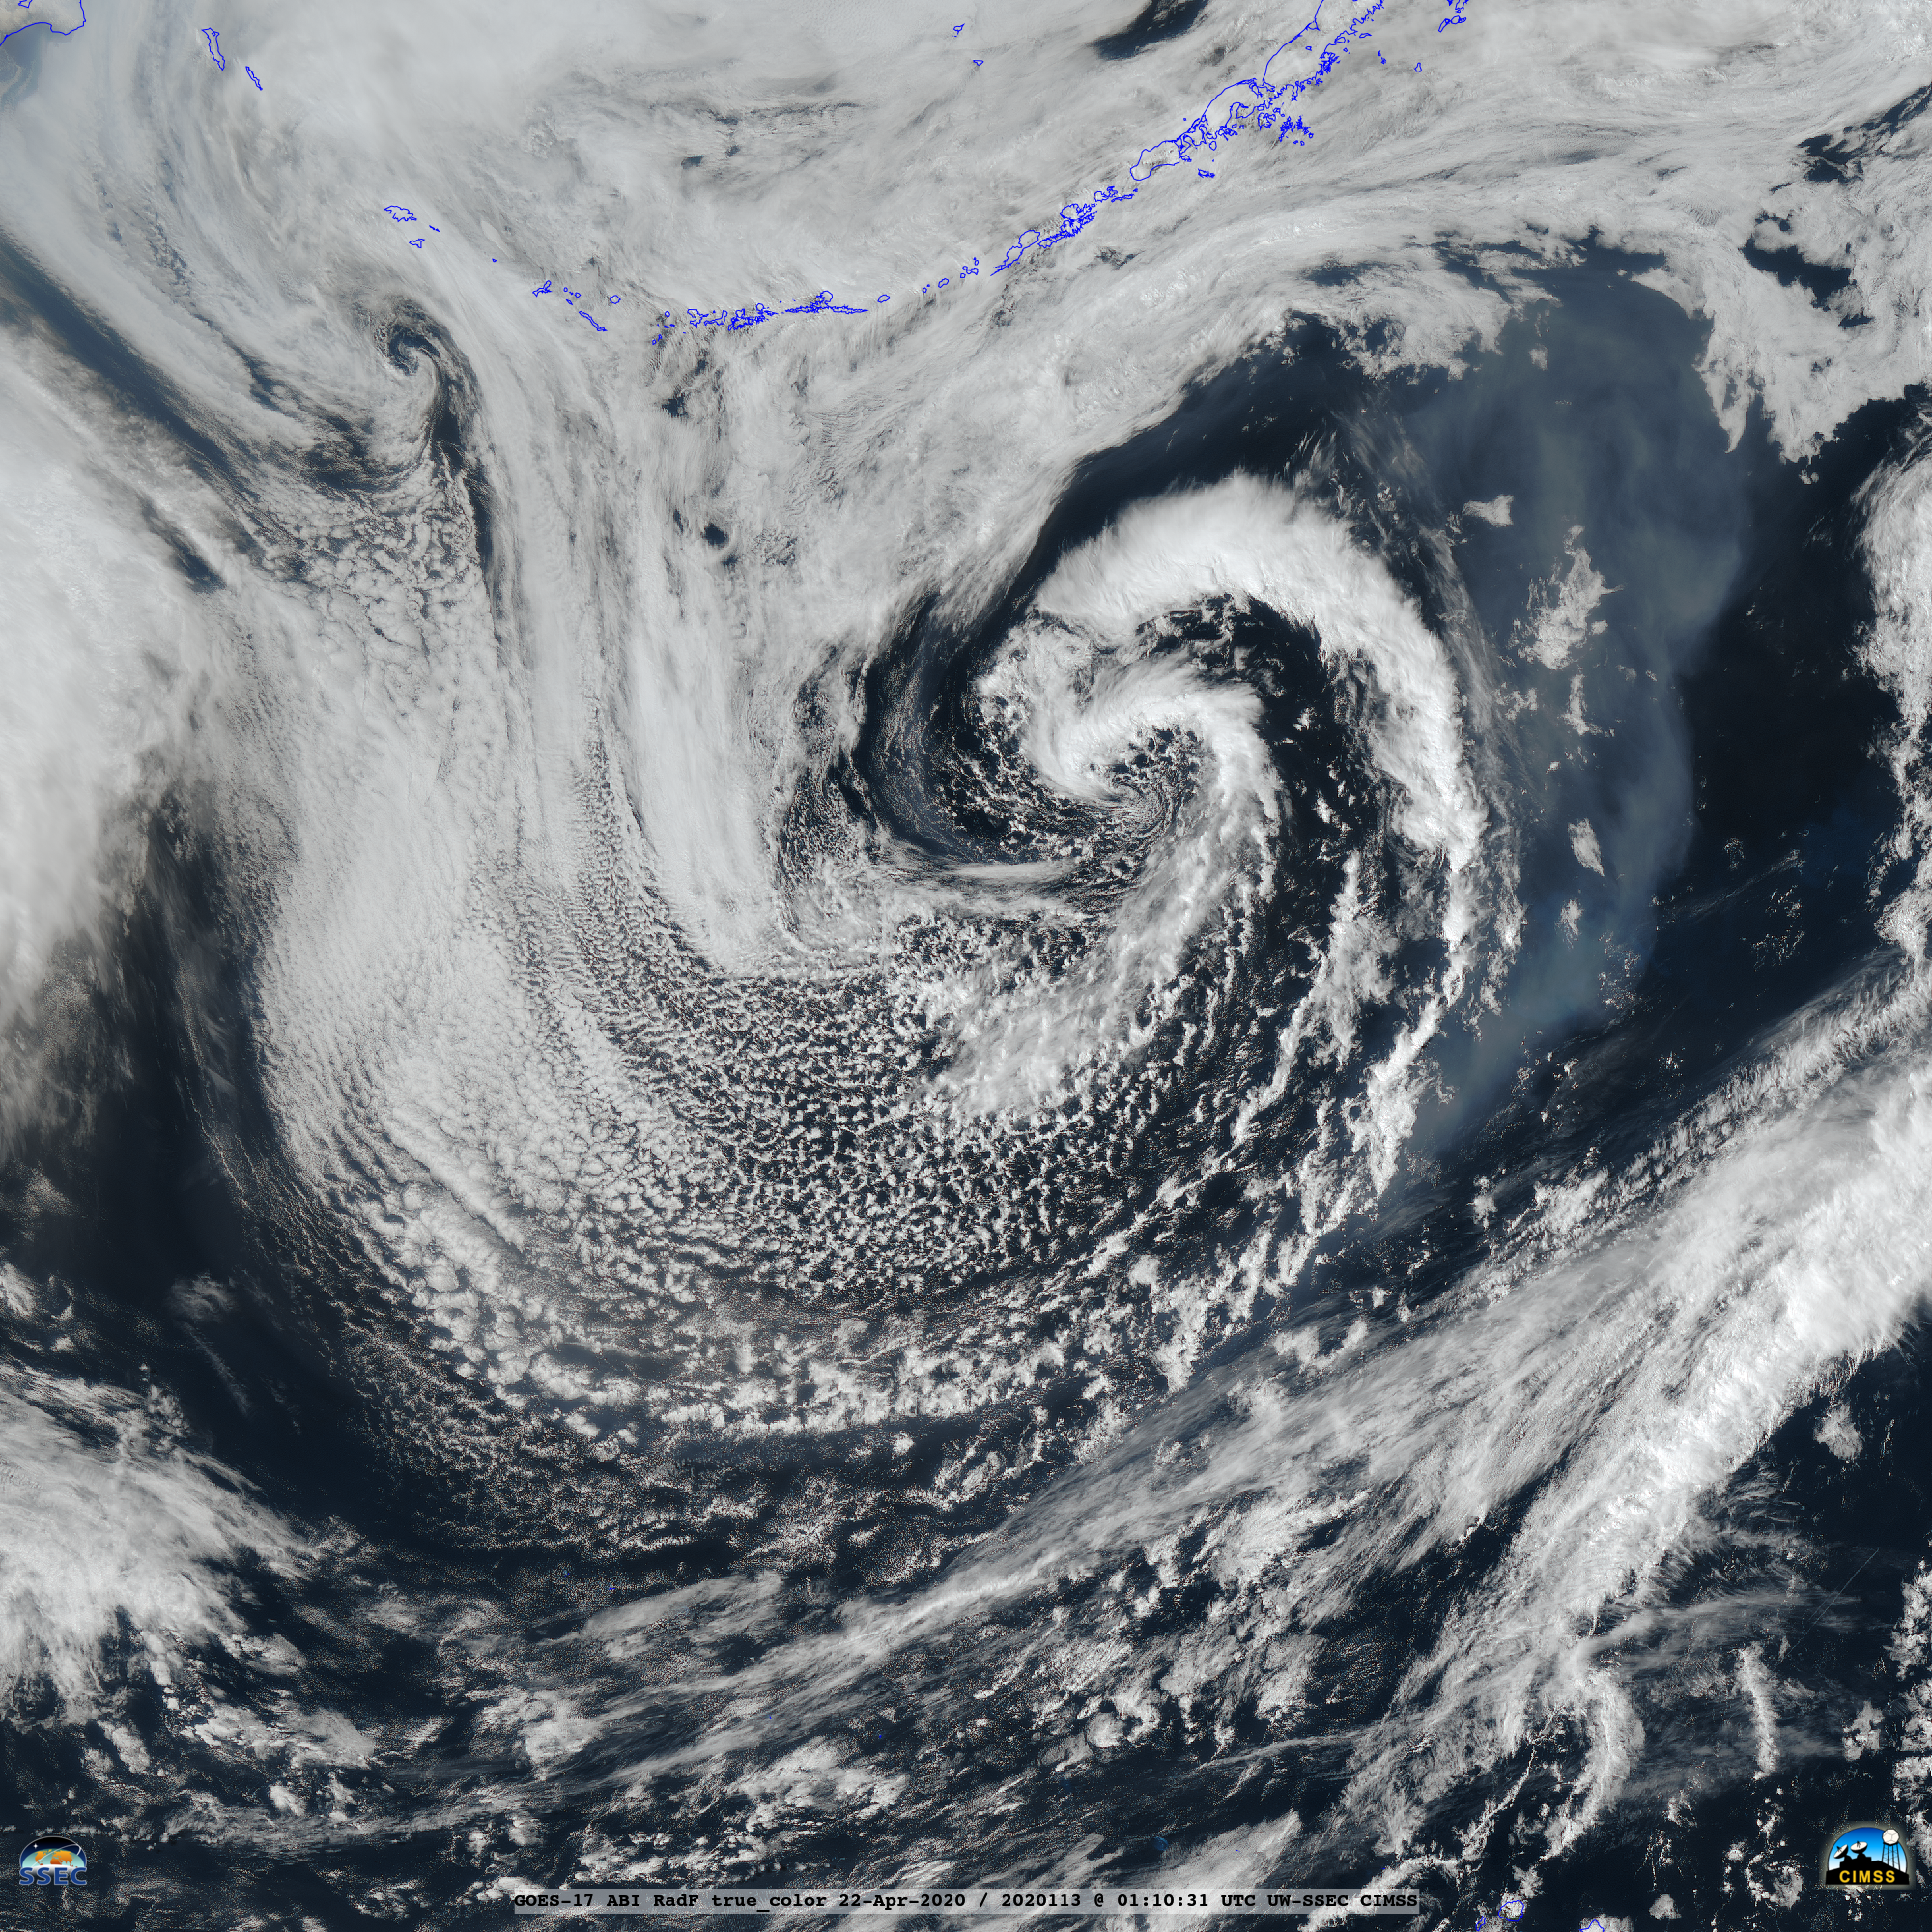
![GOES-17 True Color RGB images [click to play animation | MP4]](https://cimss.ssec.wisc.edu/satellite-blog/images/2020/04/200421_goes17_trueColorRGB_North_Pacific_anim.gif)
![GOES-17 Dust RGB images [click to play animation | MP4]](https://cimss.ssec.wisc.edu/satellite-blog/images/2020/04/200421_goes17_dustRGB_North_Pacific_anim.gif)
![Comparison of GOES-17 True Color RGB and Dust RGB images at 0110 UTC {click to enlarge]](https://cimss.ssec.wisc.edu/satellite-blog/images/2020/04/200422_0110utc_goes17_trueColorRGB_dustRGB_North_Pacific_anim.gif)
![GOES-16 "Red" Visible (0.64 µm), "Clean" Infrared Window (10.35 µm) and GLM Flash Extent Density [click to play animation | MP4]](https://cimss.ssec.wisc.edu/satellite-blog/images/2020/04/200419_goes16_visible_infrared_glmFlashExtentDensity_MS_OT_anim.gif)
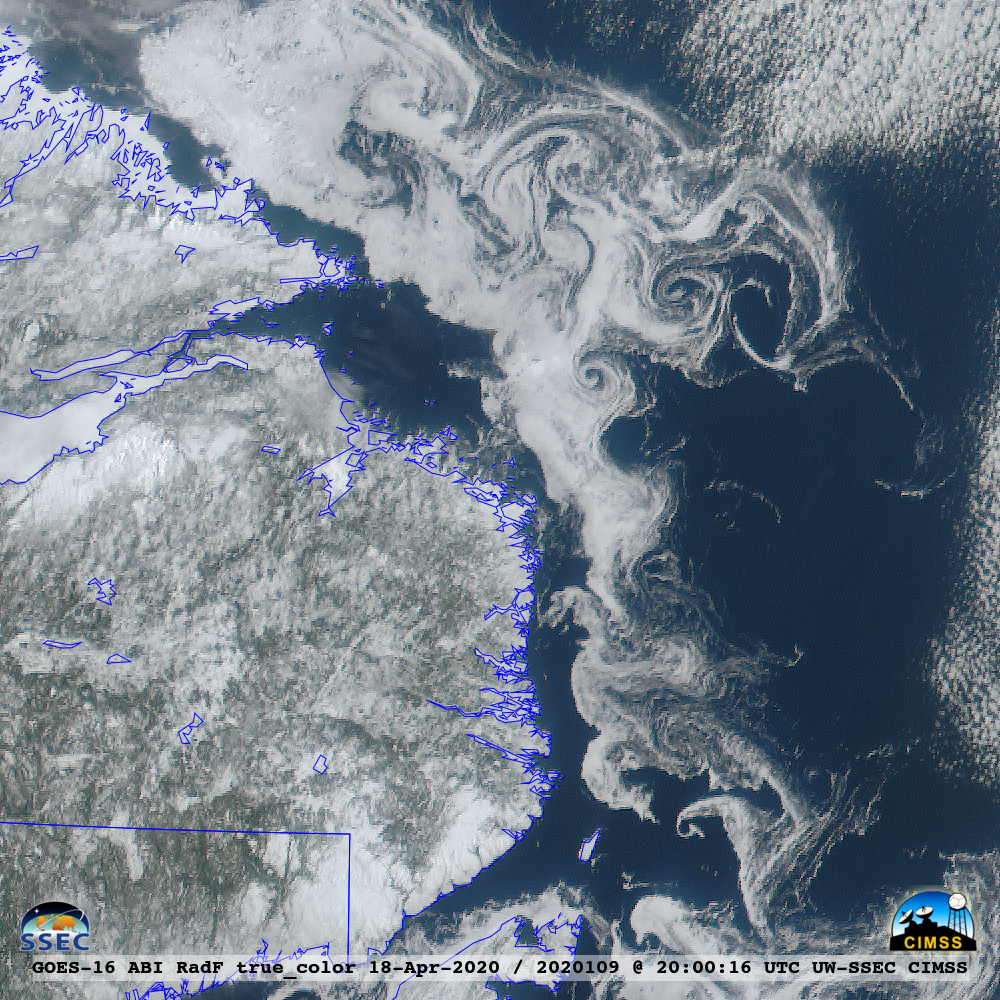
![GOES-16 True Color RGB images [click to play animation | MP4]](https://cimss.ssec.wisc.edu/satellite-blog/images/2020/04/200418_goes16_trueColorRGB_Labrador_Sea_ice_anim.gif)
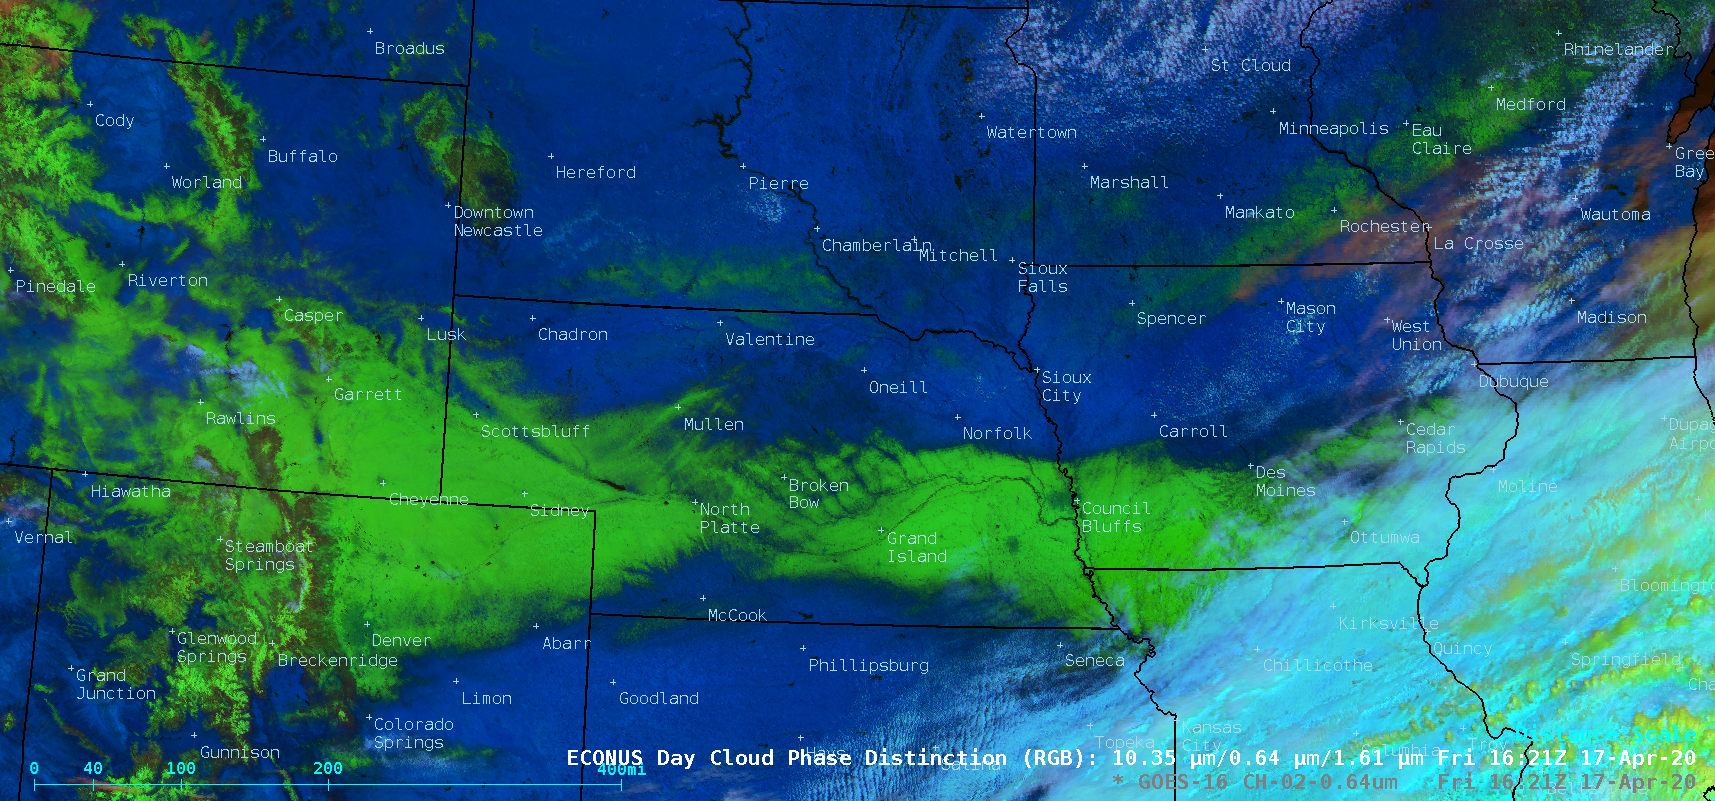

![GOES-16 Day Cloud Phase Distinction RGB images [click to play animation | MP4]](https://cimss.ssec.wisc.edu/satellite-blog/images/2020/04/200417_goes16_dayCloudPhaseDistinctionRGB_NE_KS_IA_MO_snowmelt_anim.gif)
