As a follow-on to this blog post, we will examine the period following convective initiation and take a closer look at the isolated supercell thunderstorm as it produced a long swath of large hail across far northern Texas on 07 May 2020. 1-minute Mesoscale Domain Sector GOES-16 (GOES-East) “Red” Visible (0.64 µm) images with plots of time-matched... Read More
GOES-16 “Red” Visible (0.64 µm) images, with time-matched SPC Storm Reports plotted in red [click to play animation | MP4]
As a follow-on to
this blog post, we will examine the period following convective initiation and take a closer look at the isolated supercell thunderstorm as it produced a long swath of large hail across far northern Texas on
07 May 2020. 1-minute
Mesoscale Domain Sector GOES-16
(GOES-East) “Red” Visible (
0.64 µm) images with plots of time-matched
SPC Storm Reports (above) revealed pulsing overshooting tops as the storm produced hail as large as 3.25 inches in diameter.
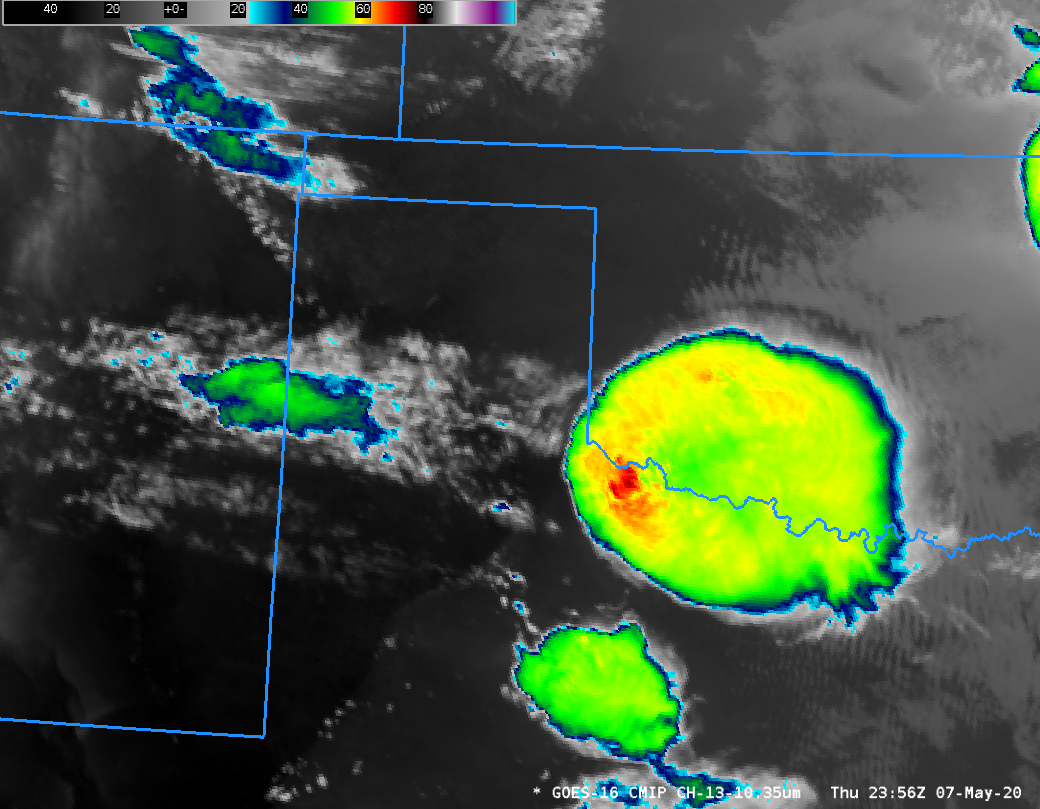
In the corresponding GOES-16 “Clean” Infrared Window (10.35 µm) images (below), the pulsing overshooting tops exhibited infrared brightness temperatures in the -70 to -80ºC range (black to white enhancement).
![GOES-16 "Clean" Infrared Window (10.35 µm) images, with time-matched SPC Storm Reports plotted in cyan [click to play animation | MP4]](https://cimss.ssec.wisc.edu/satellite-blog/images/2020/05/G16_IR_PLAINS_07MAY2020_B13_2020128_224419_GOES-16_0001PANEL_FRAME00074.GIF)
GOES-16 “Clean” Infrared Window (10.35 µm) images, with time-matched SPC Storm Reports plotted in cyan [click to play animation | MP4]
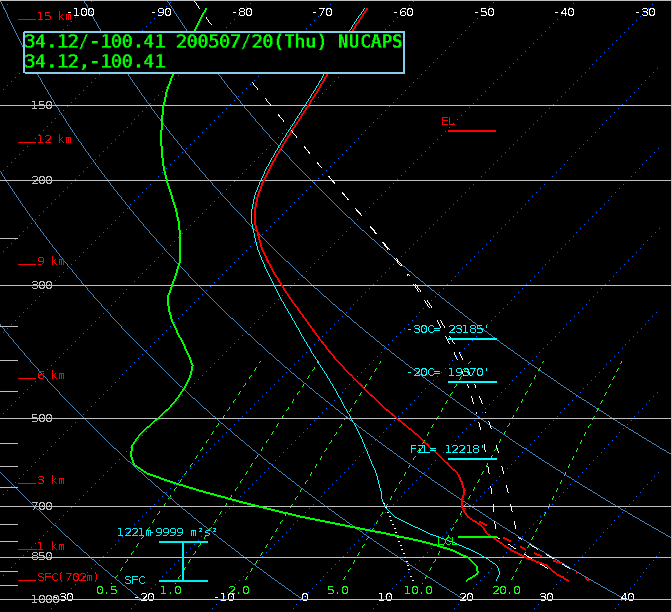
In a plot of 00 UTC rawinsonde data from Amarillo, Texas
(below) the tropopause temperature was -61.7ºC at the 192 hPa (12.4 km) level — warming was seen directly above the tropopause, but then air temperatures cooled to the -60 to -70ºC range within the 122-100 hPa (15.2-16.3 km) layer. Judging from their infrared brightness temperatures, the overshooting tops likely penetrated into those higher levels.
![Plot of 00 UTC rawinsonde data from Amarillo, Texas [click to enlarge]](https://cimss.ssec.wisc.edu/satellite-blog/images/2020/05/200508_00UTC_KAMA_RAOB.GIF)
Plot of 00 UTC rawinsonde data from Amarillo, Texas [click to enlarge]
Slightly longer animations of full-bit-depth GOES-16 Visible and Infrared images from AWIPS
(below) showed the storm-top features in better detail. One low-level feature of interest was the brief formation of inflow feeder bands along the southwest flank of the storm during the 0015-0035 time period (
rocking animation). The gradual north-northwestward flow of hazy, more humid boundary layer air was also apparent (which likely aided and helped to sustain convective development).
![GOES-16 "Red" Visible (0.64 µm) and "Clean" Infrared Window (10.35 µm) images [click to play animation | MP4]](https://cimss.ssec.wisc.edu/satellite-blog/images/2020/05/tx_ir-20200508_001919.png)
GOES-16 “Red” Visible (0.64 µm) and “Clean” Infrared Window (10.35 µm) images [click to play animation | MP4]
A prominent and long-lived
Above-Anvil Cirrus Plume (AACP) was seen with this severe thunderstorm — a toggle between GOES-16 Visible and Infrared images at 0105 UTC is shown below. The AACP appeared to exhibit
colder infrared brightness temperatures, in agreement with the Amarillo rawinsonde profile at the highest altitudes.
![GOES-16 "Red" Visible (0.64 µm) and "Clean" Infrared Window (10.35 µm) images at 0105 UTC [click to enlarge]](https://cimss.ssec.wisc.edu/satellite-blog/images/2020/05/200508_0105utc_goes16_visible_infrared_TX_anim.gif)
GOES-16 “Red” Visible (0.64 µm) and “Clean” Infrared Window (10.35 µm) images at 0105 UTC [click to enlarge]
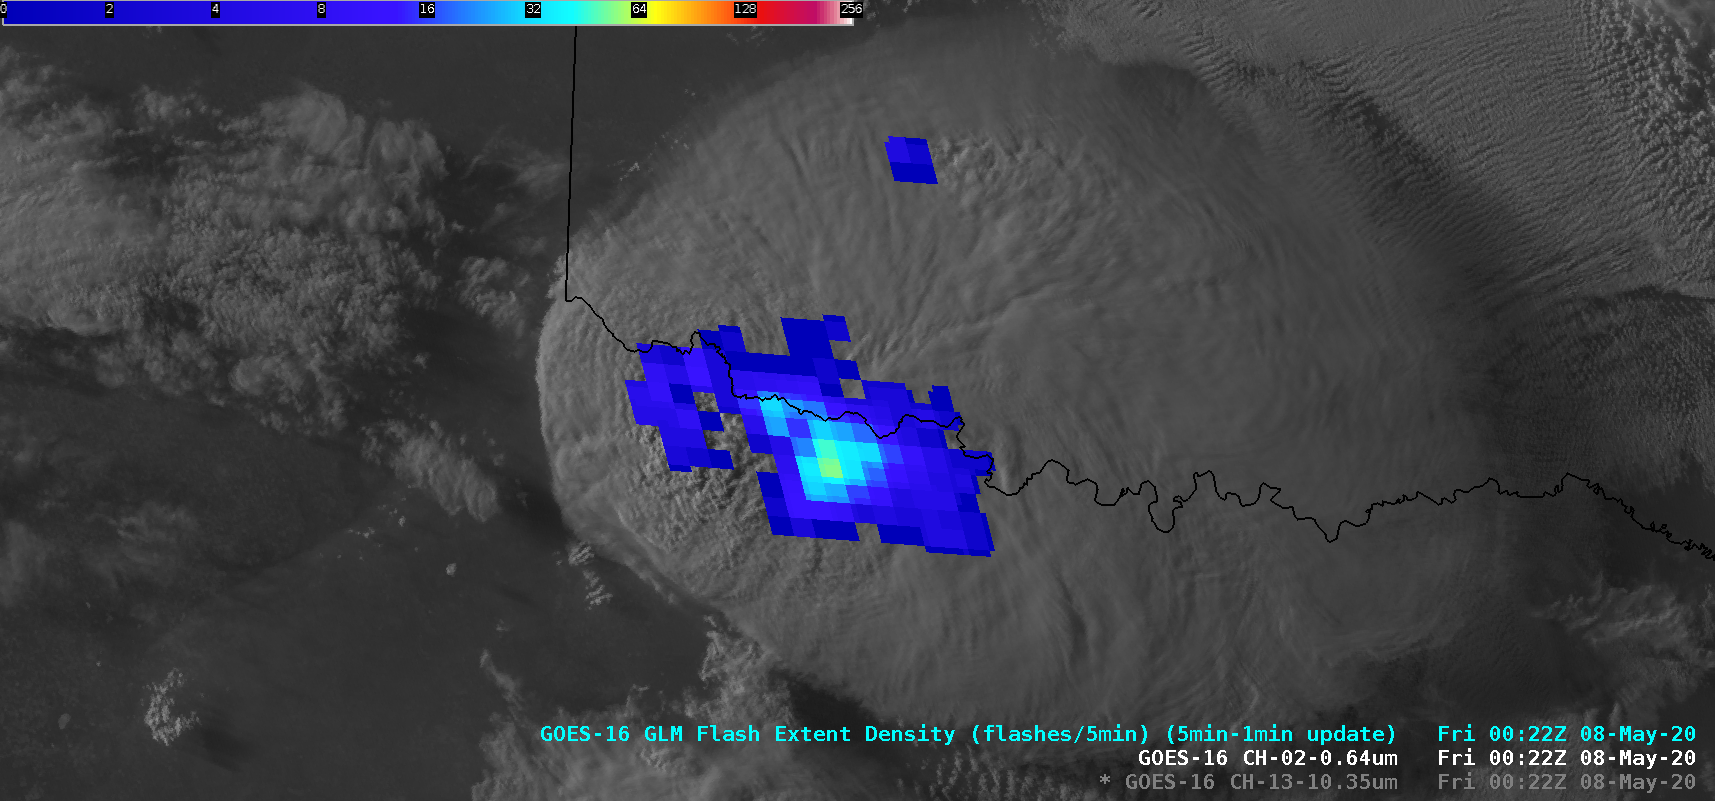
GOES-16 Visible images with and without an overlay of
GLM Flash Extent Density
(below) showed how electrically active the storm was. The lighting activity began at 2134 UTC, 1 minute after the cloud-top infrared brightness temperature first became -60ºC or colder.
![GOES-16 "Red" Visible (0.64 µm) images, with and without an overlay of GLM Flash Extent Density [click to play animation | MP4]](https://cimss.ssec.wisc.edu/satellite-blog/images/2020/05/tx_glm,-20200508_002219.png)
GOES-16 “Red” Visible (0.64 µm) images, with and without an overlay of GLM Flash Extent Density [click to play animation | MP4]
GOES-17 also viewed the storm development, albeit at a 10-minute time increment because west Texas sits outside of GOES-17’s ‘CONUS’ domain. GOES-17’s more oblique view from the allows the satellite to see more structure on the western flank of the system, particularly beneath the cirrus shield! (Click here for a faster animation)

GOES-17 Band 2 (0.64 µm) Visible Imagery, 2000 UTC on 7 May 2020 through 0200 UTC on 8 May 2020 (Click to animate)
View only this post
Read Less
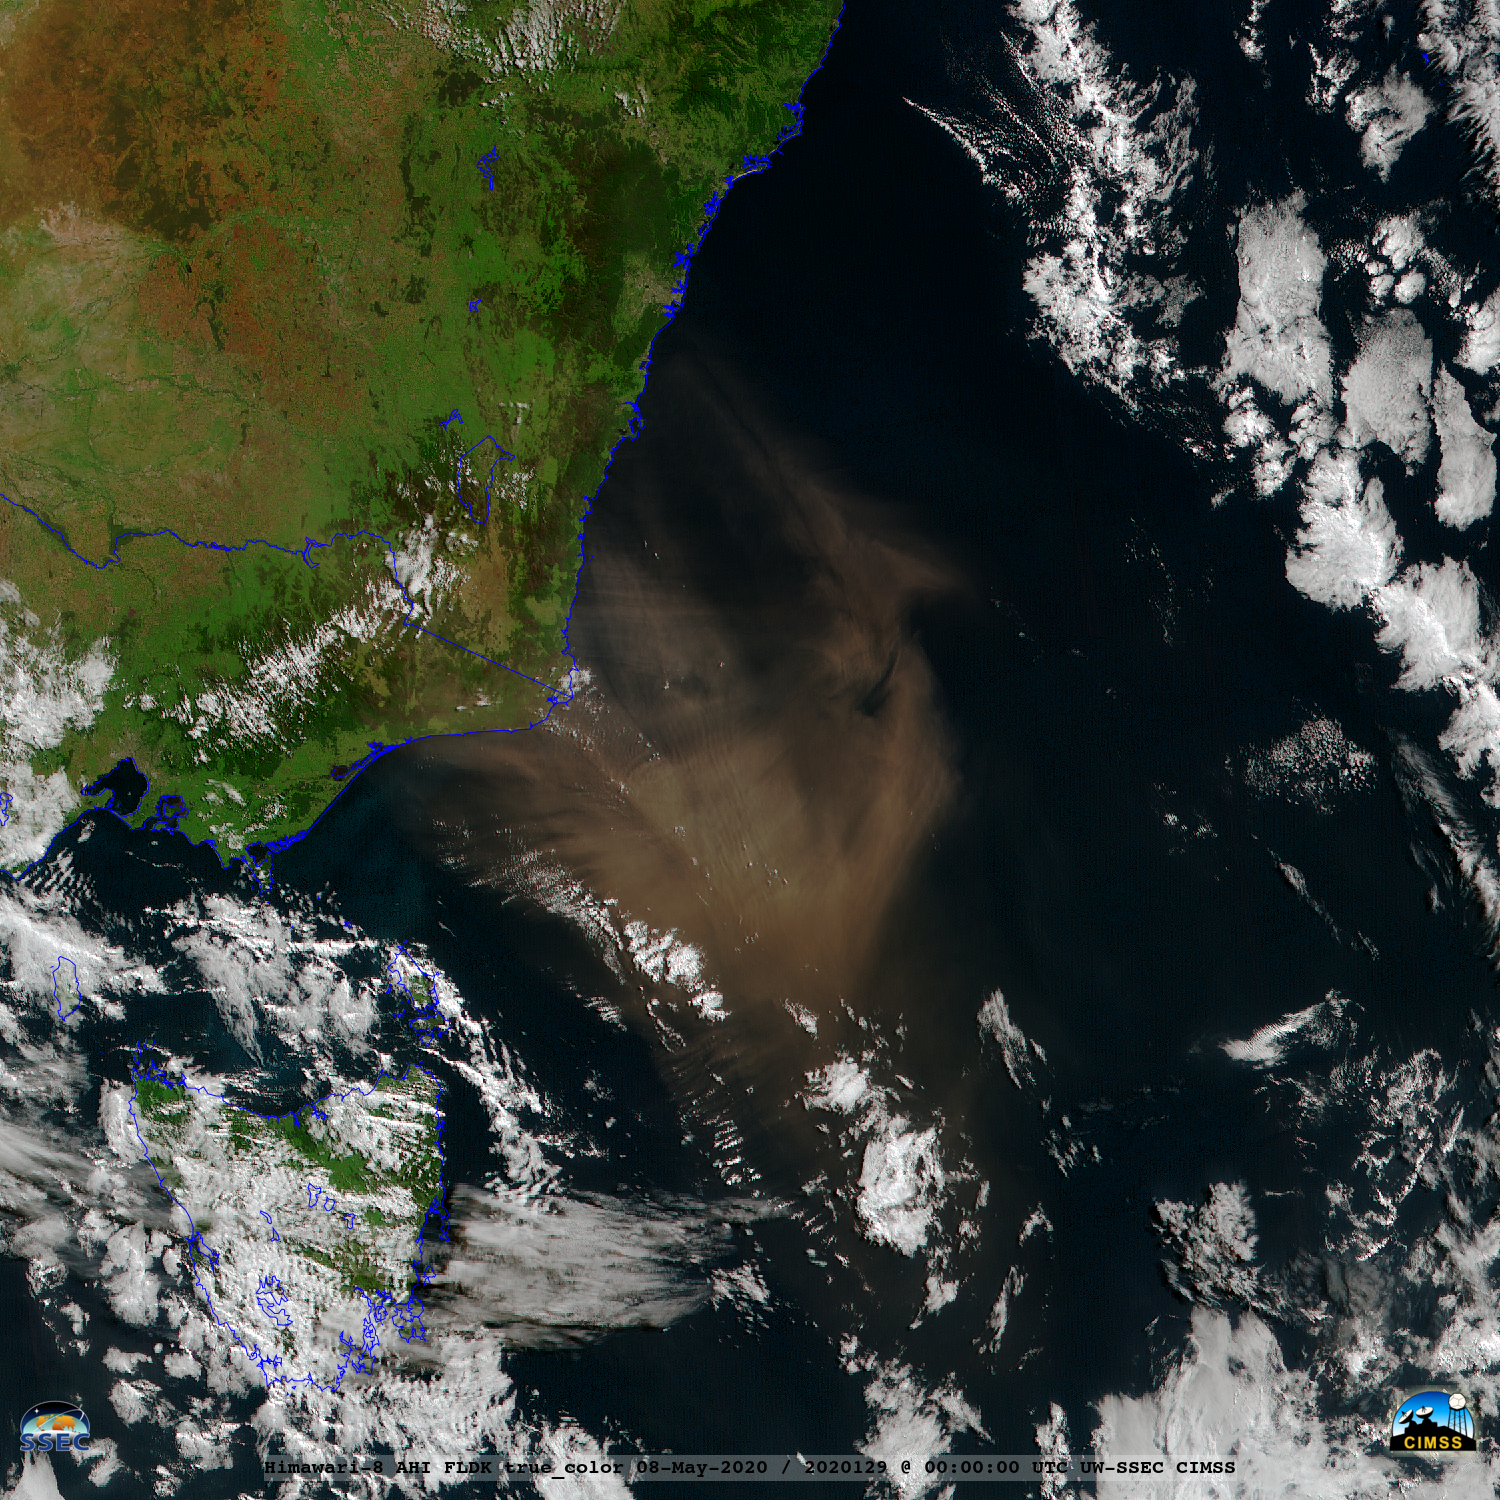
![Himawari-8 True Color RGB images [click to play animation | MP4]](https://cimss.ssec.wisc.edu/satellite-blog/images/2020/05/200508_himawari8_trueColorRGB_Australia_dust_anim.gif)
![Himawari-8 Dust RGB images [click to play animation | MP4]](https://cimss.ssec.wisc.edu/satellite-blog/images/2020/05/200508_himawari8_dustRGB_Australia_anim.gif)
![Suomi NPP VIIRS True Color RGB image [click to enlarge]](https://cimss.ssec.wisc.edu/satellite-blog/images/2020/05/200508_03utc_suomiNPP_viirs_trueColorRGB_Australia.png)
![GOES-16 "Clean" Infrared Window (10.35 µm) images, with time-matched SPC Storm Reports plotted in cyan [click to play animation | MP4]](https://cimss.ssec.wisc.edu/satellite-blog/images/2020/05/200507_goes16_infrared_spcStormReports_TX_anim.gif)
![GOES-16 "Red" Visible (0.64 µm) and "Clean" Infrared Window (10.35 µm) images [click to play animation | MP4]](https://cimss.ssec.wisc.edu/satellite-blog/images/2020/05/200507_goes16_visible_infrared_TX_anim.gif)
![GOES-16 "Red" Visible (0.64 µm) images, with and without an overlay of GLM Flash Extent Density [click to play animation | MP4]](https://cimss.ssec.wisc.edu/satellite-blog/images/2020/05/200507_goes16_visible_glmFlashExtentDensity_TX_anim.gif)


