The satellites Terra (launched in 1999) and Aqua (launched in 2002) both carry the Moderate-Resolution Imaging Spectroradiometer (MODIS) instrument, an imager with 26 channels at wavelengths that range from 0.41 µm to 14.1 µm. There are simple ways to create useful imagery with this historical data with Polar2Grid software that... Read More

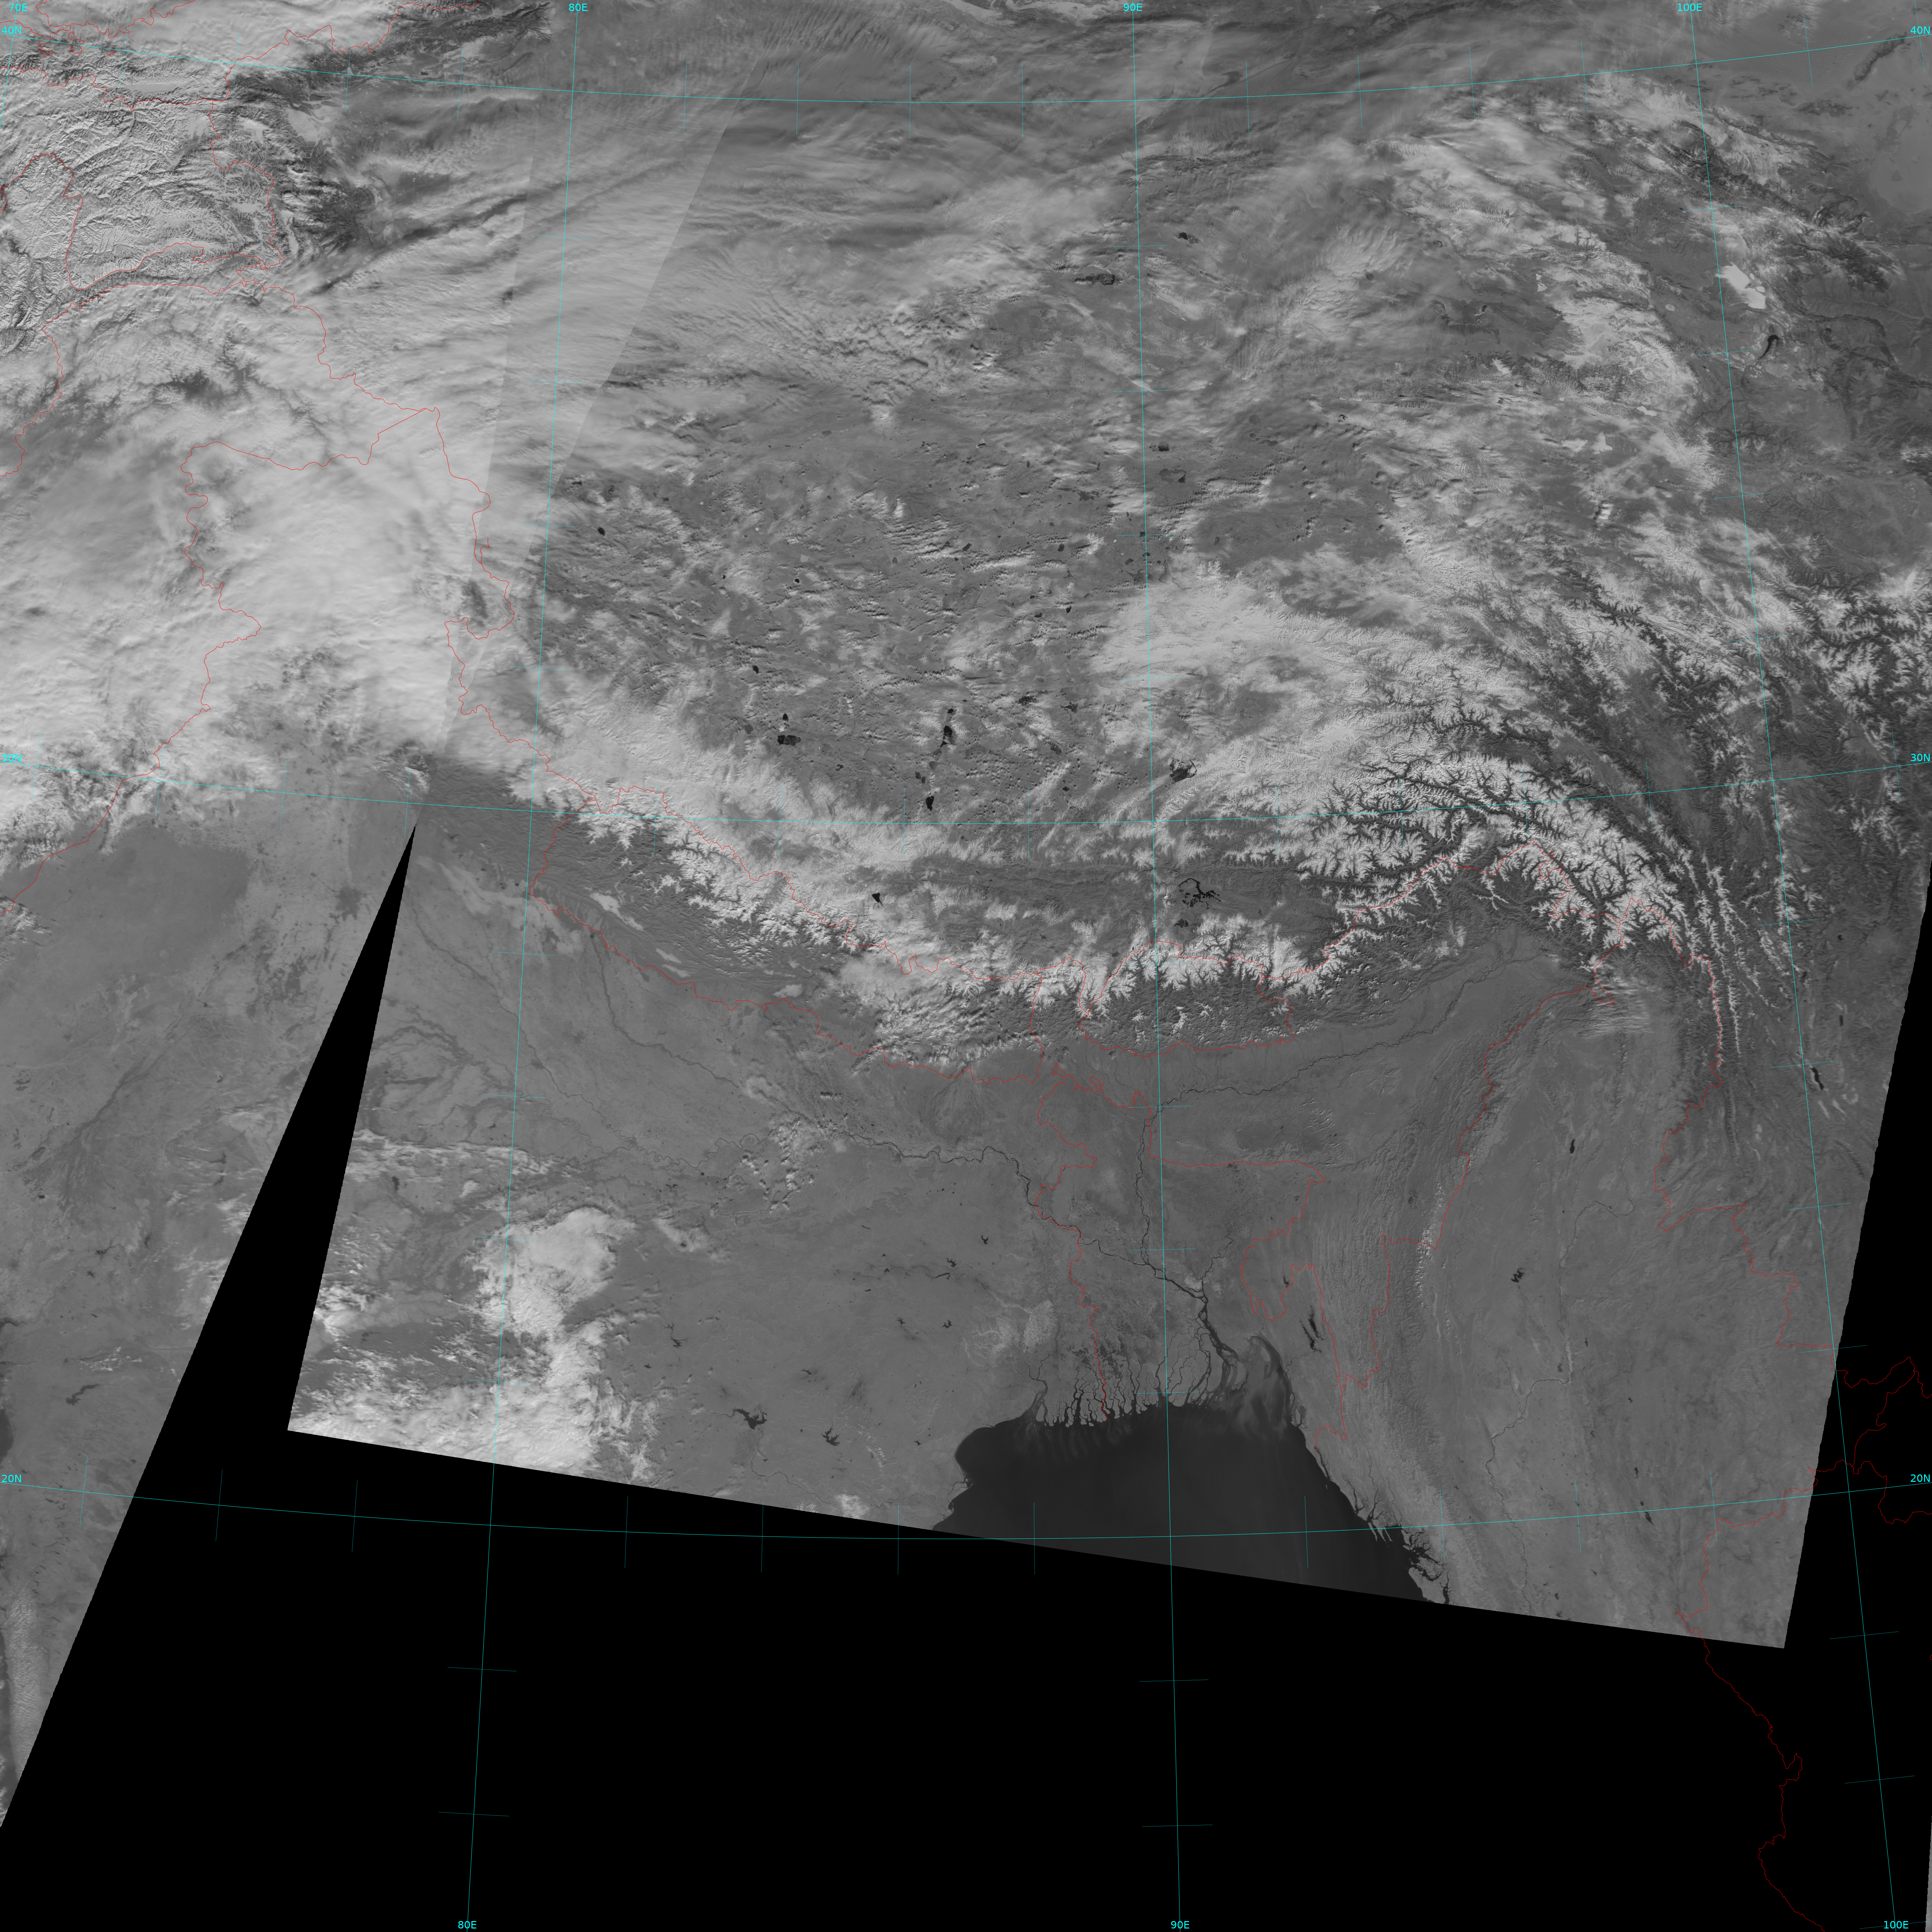
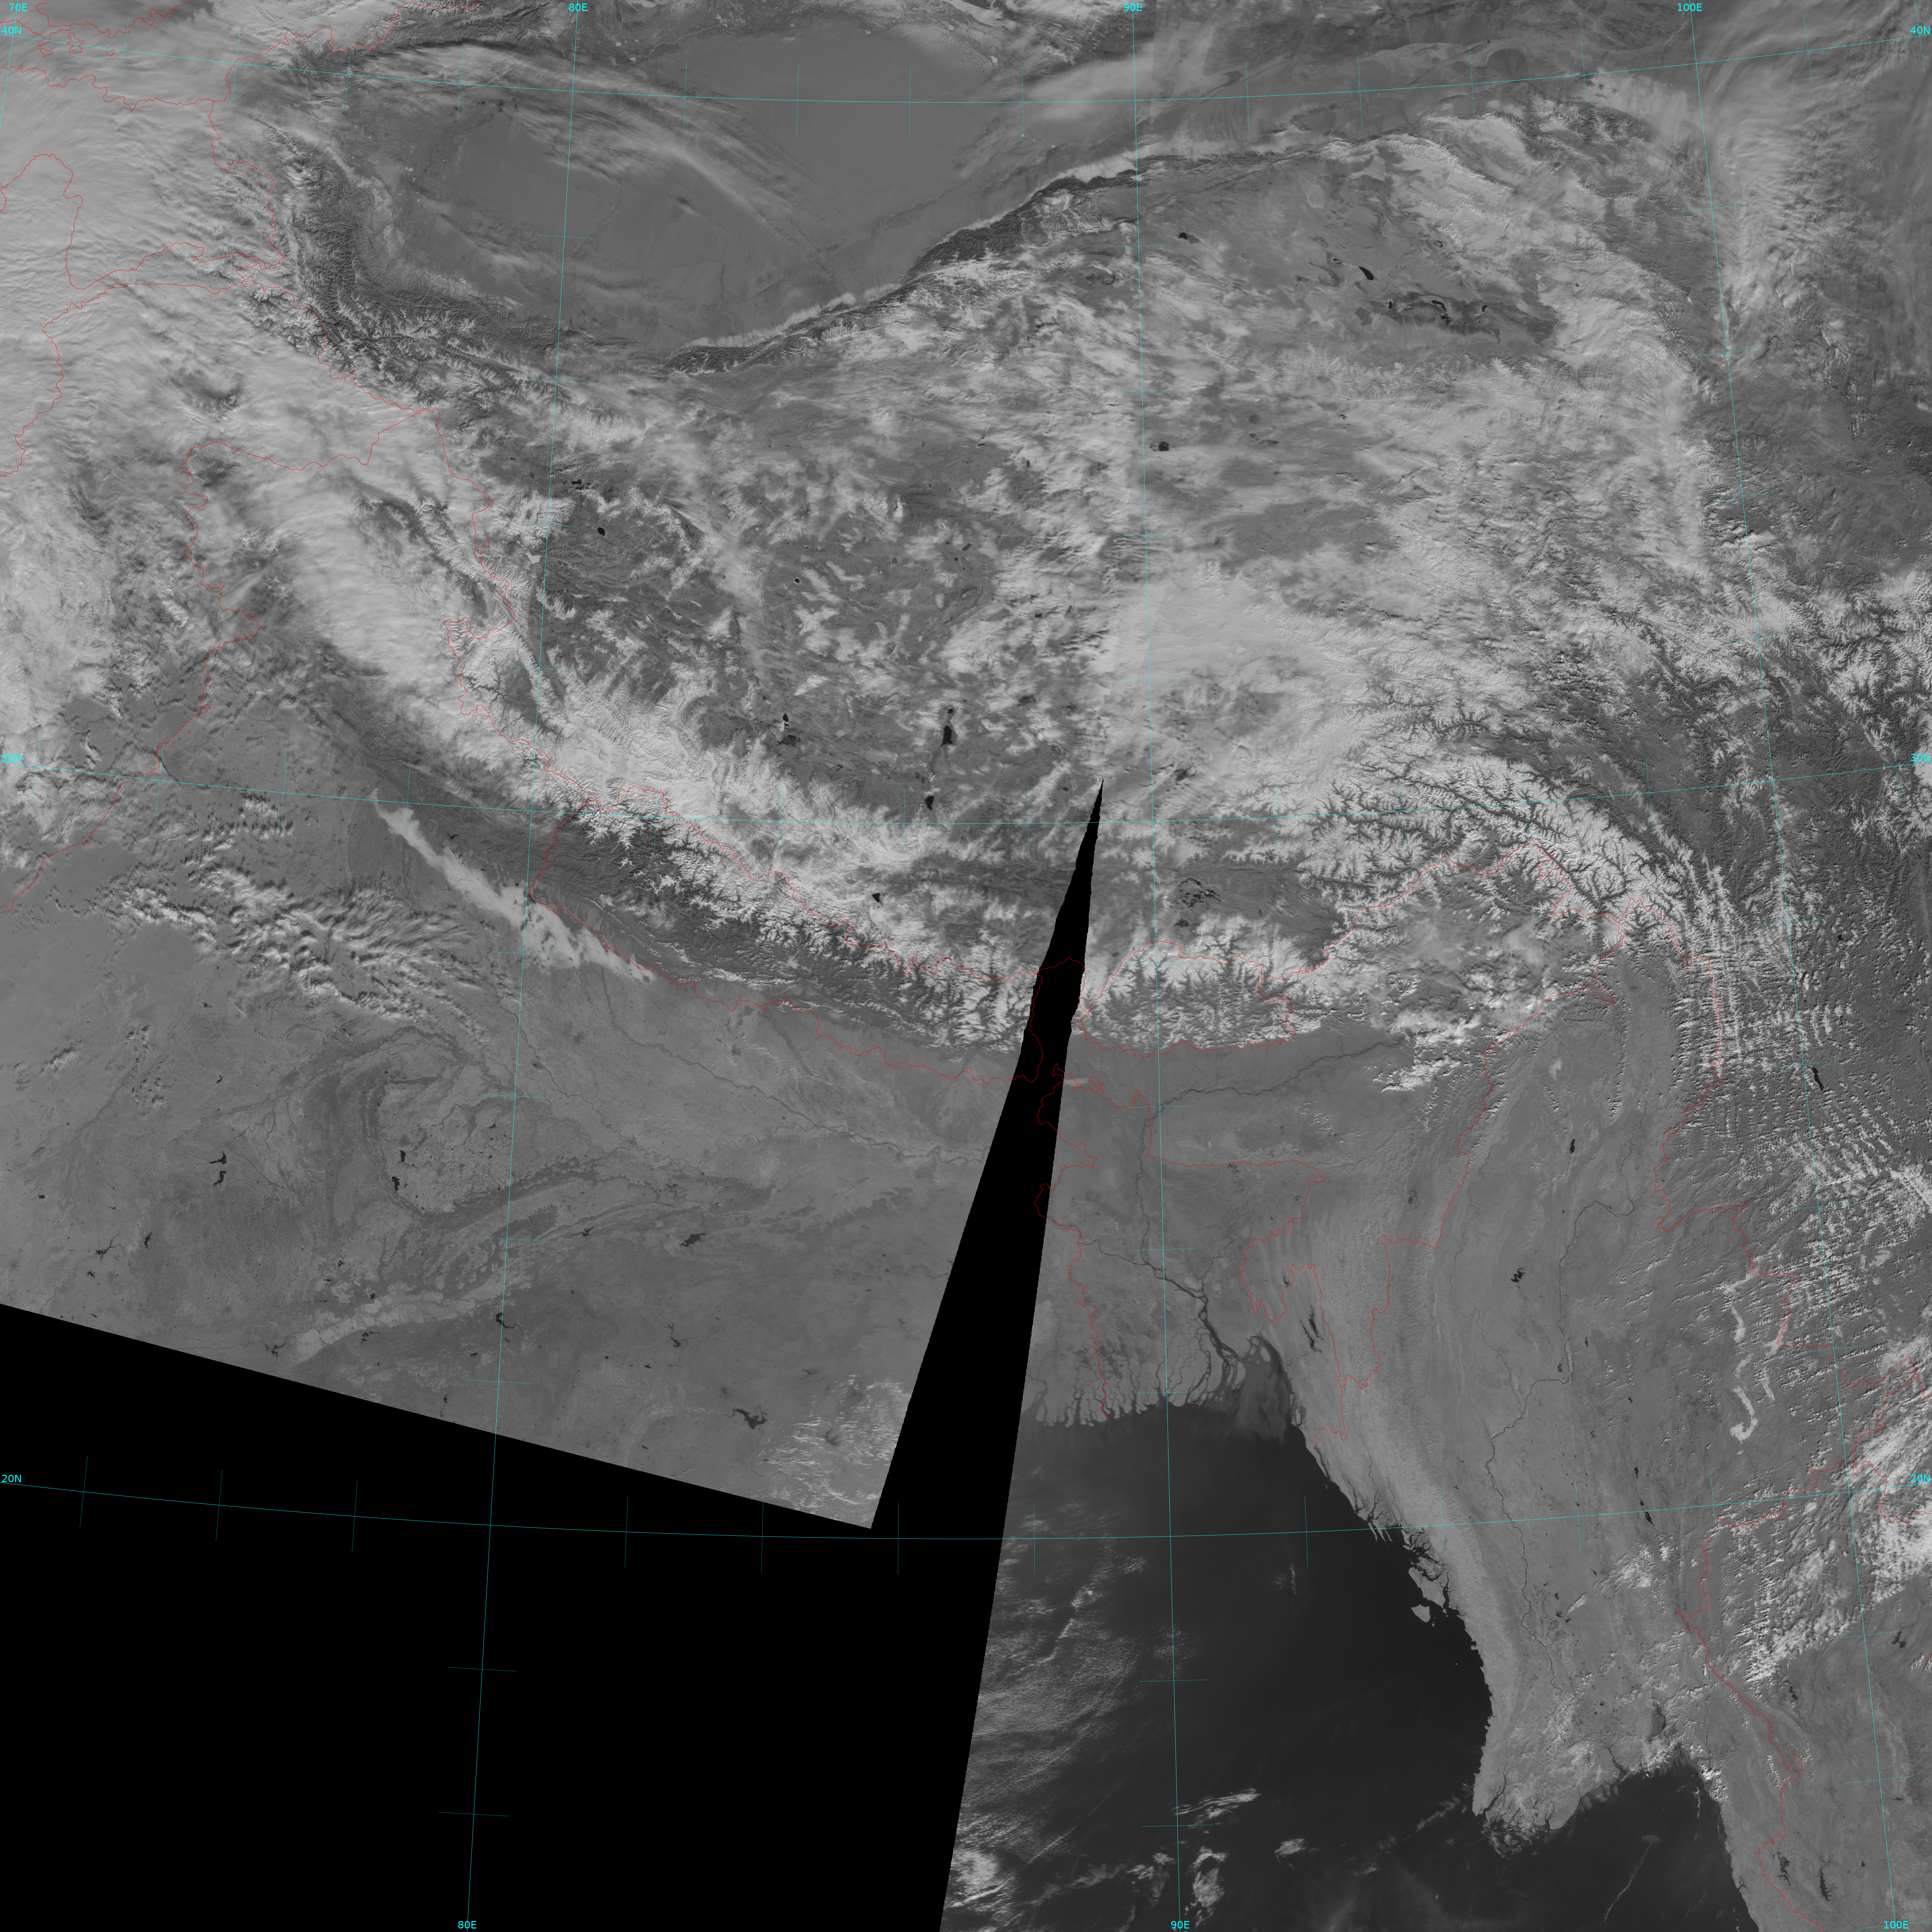
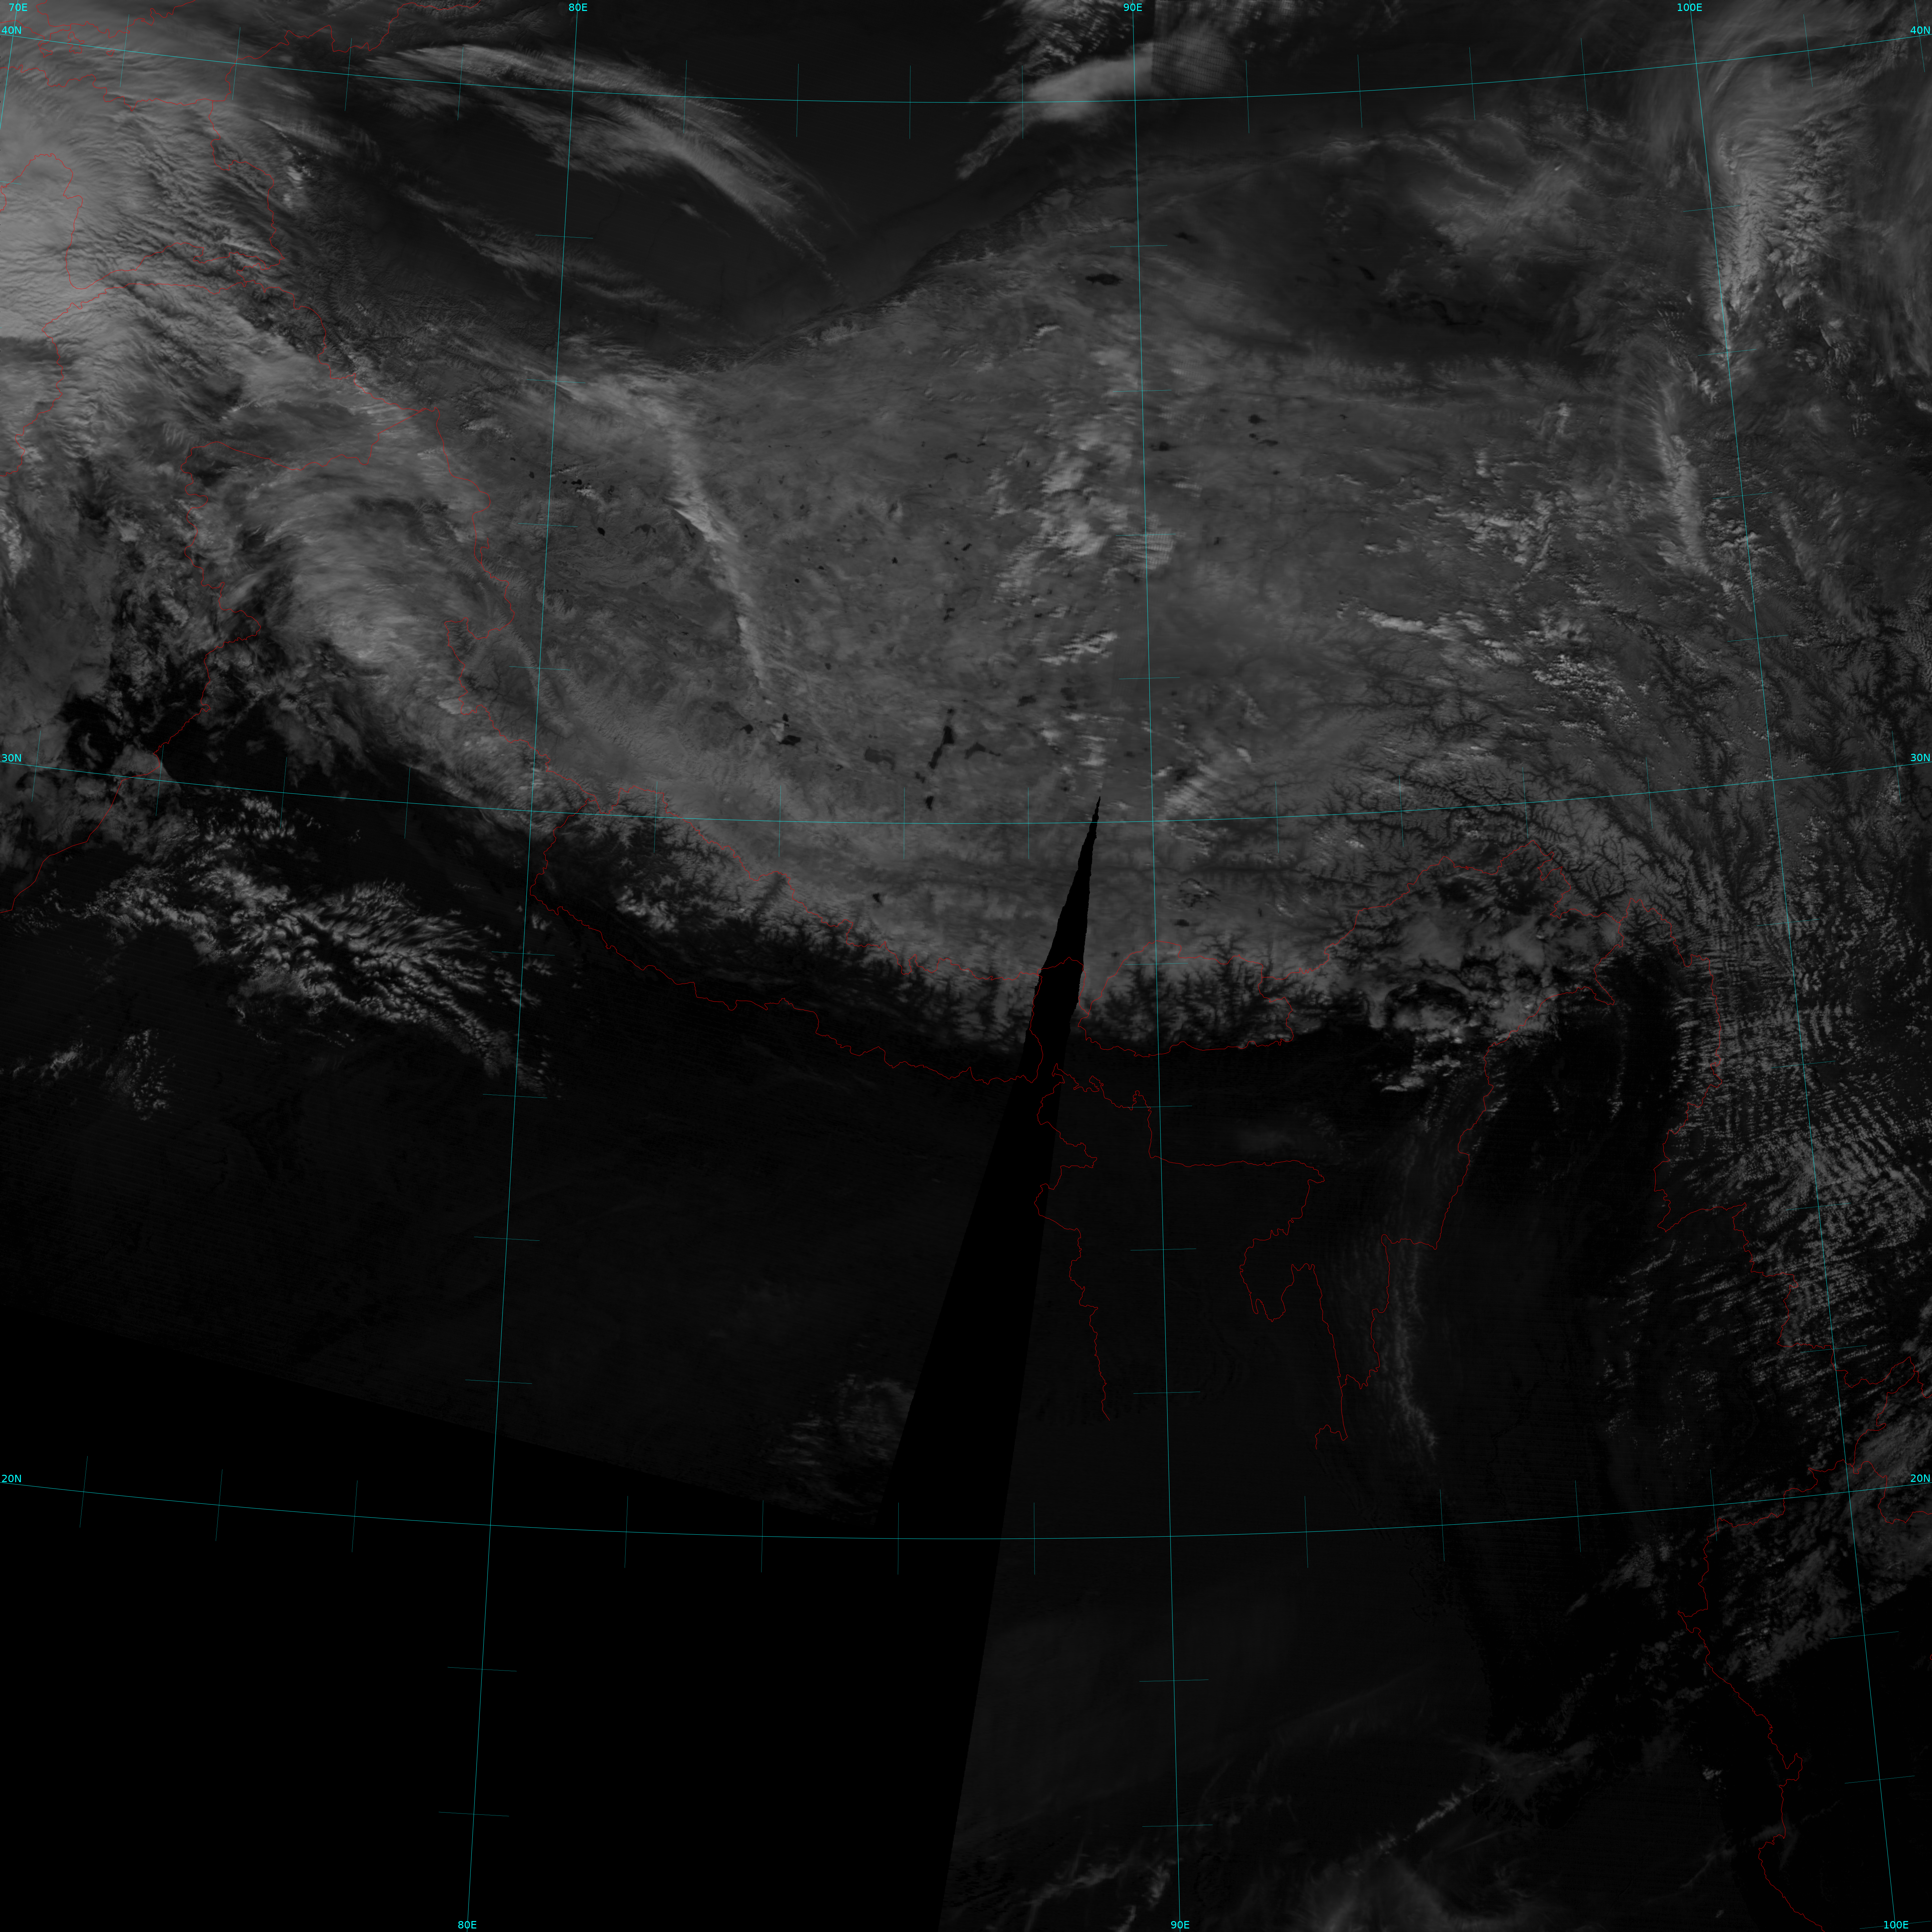
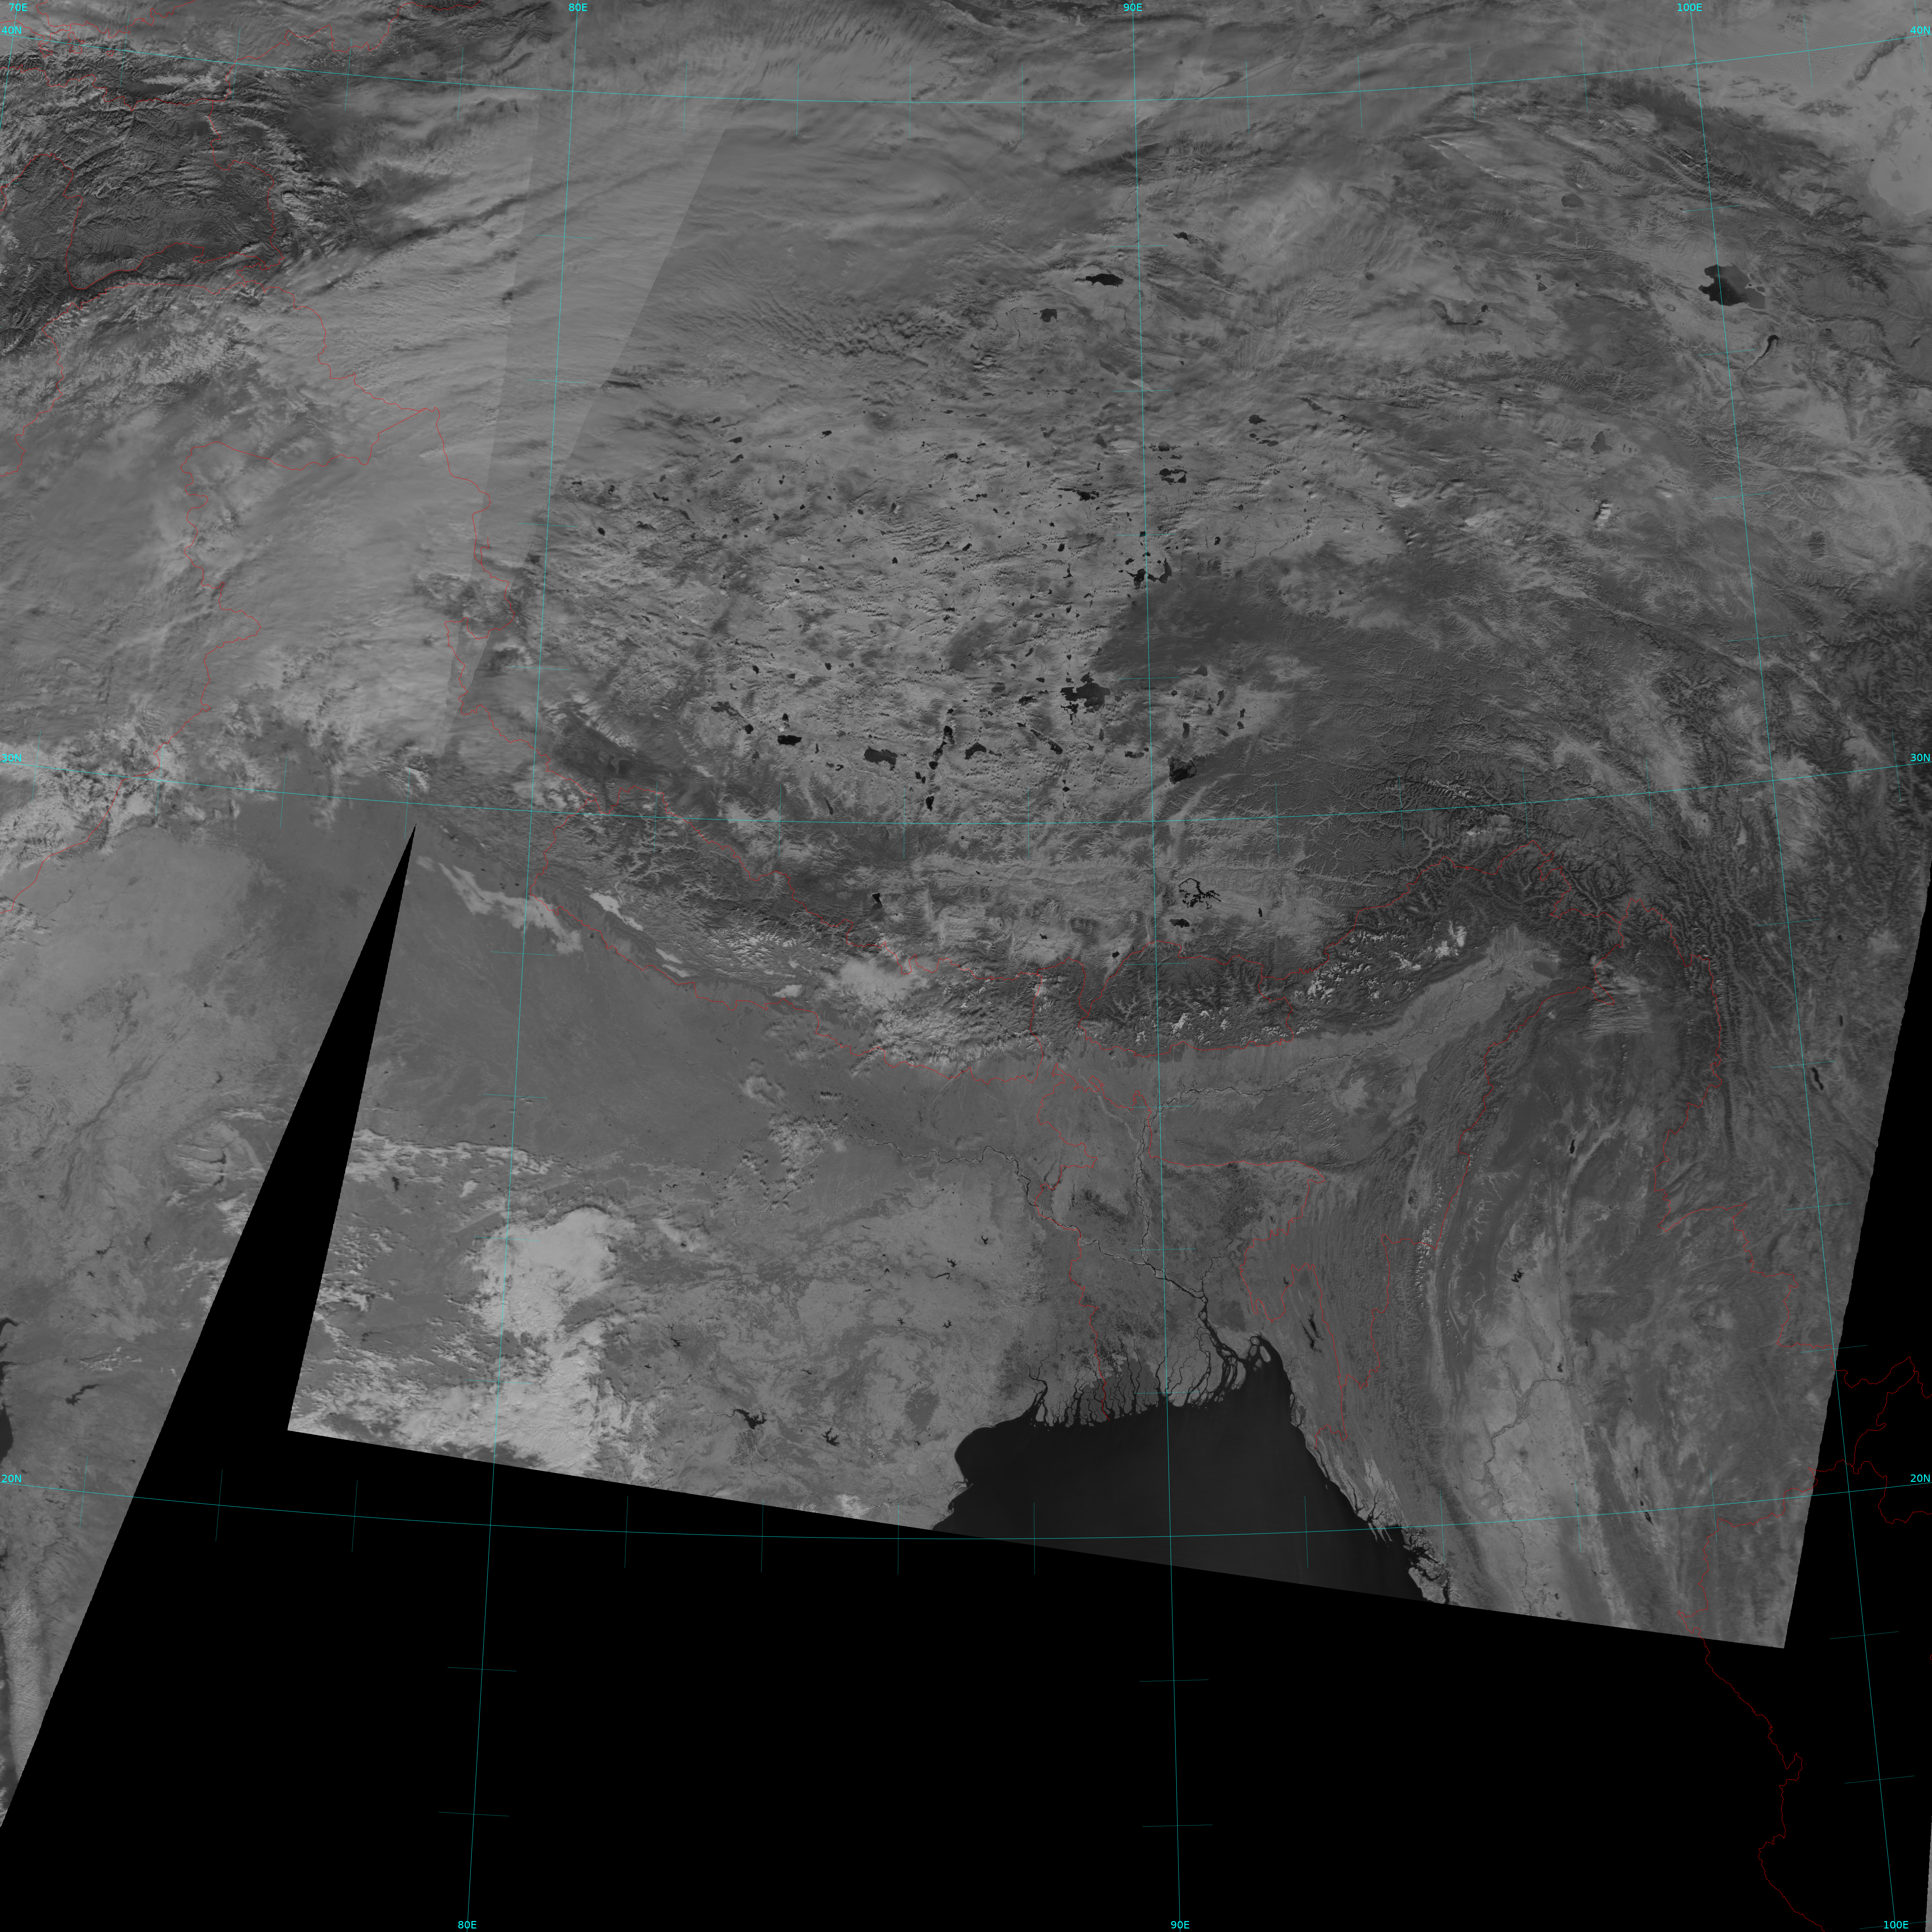
Terra MODIS Bands 2 (0.86 µm), 6 (1.62 µm) and 26 (1.38 µm) from 28 January 2004 (Click to enlarge)
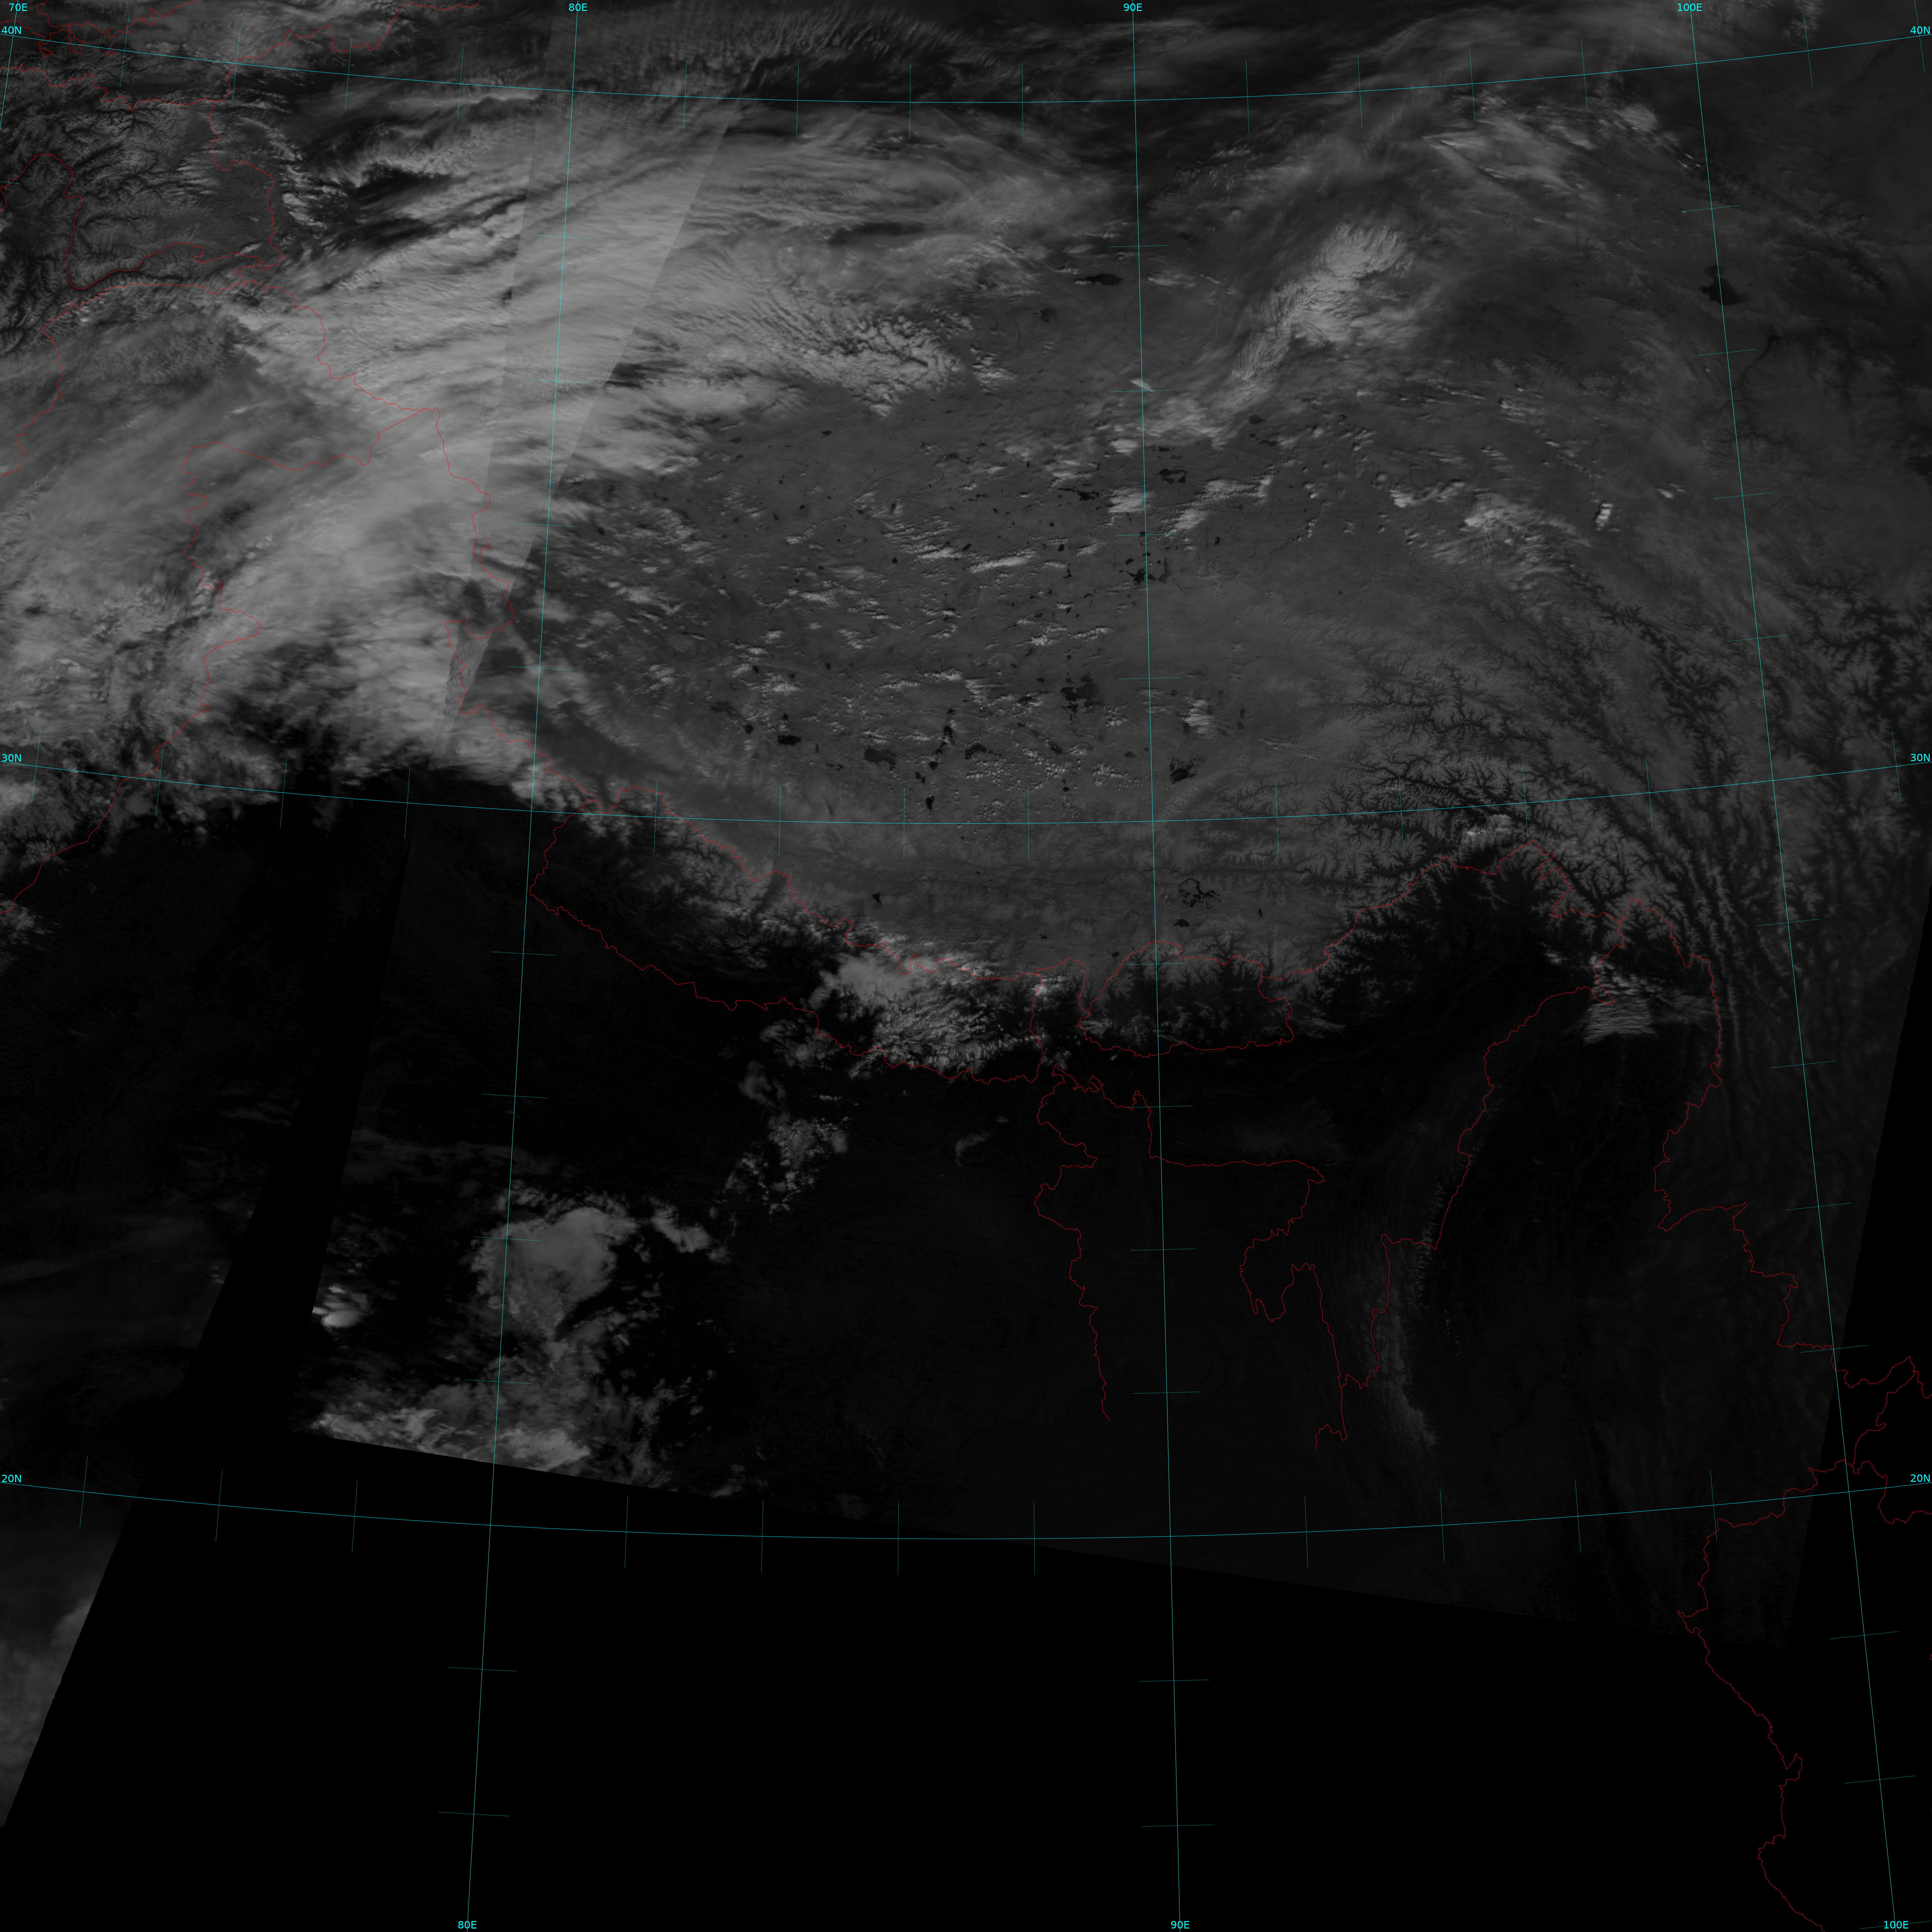
The satellites Terra (launched in 1999) and Aqua (launched in 2002) both carry the Moderate-Resolution Imaging Spectroradiometer (MODIS) instrument, an imager with 26 channels at wavelengths that range from 0.41 µm to 14.1 µm. There are simple ways to create useful imagery with this historical data with Polar2Grid software that was developed at CIMSS as part of the Community Satellite Software Package (CSPP). This blog post will show you how to create imagery as shown above (0.86 µm, 1.62 µm and 1.38 µm) over Mt. Everest on 28 January 2004. (Similar imagery from 29 January 2004: 0.86 µm, 1.62 µm, 1.38 µm, or toggles between 28/29 January at 0.86 µm, 1.62 µm and 1.38 µm)
The self-contained Polar2Grid software package can be downloaded from this link. (You may have to register your email address before accessing the site; registration is free). Once on the website, scroll down to find “Polar2Grid V2.3 Reprojection Software for Linux” (note that the version number will occasionally increment!) and download the gzipped tarfile. You should also download the documentation (it’s a pdf file) at that site. This will tell you what to do before you can successfully run the software: for example, the POLAR2GRID_HOME variable must be set:
export POLAR2GRID_HOME=/path/to/softwarebundle.
Next, order archived MODIS data. These data are available at the NASA LAADS (Level-1 and Atmosphere Archive and Distribution System) DAAC (Distributed Active Archive Center) at this link. If you click on ‘Find Data’ at that website, a long list of possible products will be displayed. MODIS data that are compatible with Polar2Grid are Level 1b Calibrated Radiances: MOD02 files, and for this example I chose 1-km and half-kilometer resolution (that is, MOD021KM, MOD02HKM). Geolocation files (MOD03) must also be selected.
Polar2Grid includes software to create a grid onto which the data will be projected; for the example above, I first ran the Polar2Grid script ./p2g_grid_helper.sh asia 87.0 28.0 500 -500 6000 6000 > myasiagrids.txt.
This creates a grid centered at 28 N, 87 E (west longitudes are negative) with a 500-m grid spacing in both x- and y-directions; the grid has a size of 6000×6000. If you don’t create a grid, the satellite data are placed on the native satellite grid, a grid that changes from day to day for a polar orbiter.
Once the MODIS data has been placed on your local machine, you are ready to use Polar2Grid to query what products can be created using this command
./polar2grid.sh modis gtiff --list-products -f /data-hdd/AckFriendData/MODIS/MOD02_03/day028/;
the -f flag identifies the directory holding the MODIS data and modis gtiff identifies the data type and output files to be created. The result of this is a (sometimes lengthy) list of products that can be created given the input. The following command creates geotiff:
./polar2grid.sh modis gtiff -p vis02 vis06 vis26 --grid-configs /home/scottl/Polar2Grid/polar2grid_v_2_3/bin/myasiagrids.txt -g asia -f /data-hdd/AckFriendData/MODIS/MOD02_03/day028/
This command creates Bands 2, 6 and 26 GeoTiffs, and the data are placed on the ‘asia’ grid defined above (and placed in the myasiagrids.txt file). The grids created do not have georeferencing embedded within the image; that is added with the add_coastlines shell script:
./add_coastlines.sh --add-grid --add-borders --borders-resolution=f --borders-outline='red' terra_modis_vis06_20040129_031000_asia.tif
The add-grid flag inserts lat/lon lines; add-borders includes country borders (with the outline color defined, and the resolution specified; for more control flags, refer to the documentation).
Other CIMSS blog posts that discuss Polar2Grid software are here , here and here.
(Added: GOES-9 was observing this part of the World in early 2004. Visible animations for 28 January and 29 January are available — click the dates).
View only this post
Read Less
![GOES-16 “Red” Visible (0.64 µm) images, with SPC Storm Reports plotted in red [click to play animation | MP4]](https://cimss.ssec.wisc.edu/satellite-blog/images/2020/05/200520_goes16_visible_spcStormReports_WY_MT_anim.gif)
![GOES-16 “Clean” Infrared Window (10.35 µm) images, with SPC Storm Reports plotted in cyan [click to play animation | MP4]](https://cimss.ssec.wisc.edu/satellite-blog/images/2020/05/200520_goes16_infrared_spcStormReports_WY_MT_anim.gif)


![Meteosat-8 Infrared Window (10.8 µm) images [click to play animation | MP4]](https://cimss.ssec.wisc.edu/satellite-blog/images/2020/05/200517_200518_meteosat8_infrared_Amphan_anim.gif)
![NOAA-20 VIIRS True Color RGB and Infrared Window (11.45 µm) images [click to enlarge]](https://cimss.ssec.wisc.edu/satellite-blog/images/2020/05/200518_07utc_noaa20_viirs_trueColorRGB_infraredWindow_Cyclone_Amphan_anim.gif)
![Suomi NPP VIIRS Day/Night Band (0.7 µm) and Infrared Window (11.45 µm) images [click to enlarge]](https://cimss.ssec.wisc.edu/satellite-blog/images/2020/05/200518_1938utc_suomiNPP_viirs_dayNightBand_infraredWindow_Cyclone_Amphan_anim.gif)
![NOAA-20 VIIRS Day/Night Band (0.7 µm) and Infrared Window (11.45 µm) images (credit: William Straka, CIMSS) [click to enlarge]](https://cimss.ssec.wisc.edu/satellite-blog/images/2020/05/200518_2028utc_noaa20_viirs_dayNightBand_infraredWindow_Cyclone_Amphan_anim.gif)
