GOES-17 (GOES-West) “Red” Visible (0.64 µm) and “Clean” Infrared Window (10.35 µm) images (above) displayed the formation of an orographic rotor cloud downwind (north-northeast) of the Kigluaik and Bendeleben Mountains in the Seward Peninsula of Alaska on 27 June 2020. Even though the highest terrain in those mountain ranges was only 3700-4700 feet... Read More
Topography, GOES-17 “Red” Visible (0.64 µm) and “Clean” Infrared Window (10.35 µm) images [click to play animation | MP4]
GOES-17
(GOES-West) “Red” Visible (
0.64 µm) and “Clean” Infrared Window (
10.35 µm) images
(above) displayed the formation of an orographic rotor cloud downwind (north-northeast) of the Kigluaik and Bendeleben Mountains in the
Seward Peninsula of Alaska on 27 June 2020. Even though the highest terrain in those mountain ranges was only 3700-4700 feet (1.1-1.4 km), the coldest cloud-top infrared brightness temperatures within the rotor cloud feature were around -50 to -51ºC.
A plot of rawinsonde data from Nome (below) showed the strong southwesterly winds that existed within most the troposphere on that day. The tropopause temperatures were around -51ºC at altitudes of 9.4-9.6 km — indicating that these high-altitude rotor clouds were forced by vertically-propagating waves initiated by interaction of the anomalously-strong southerly/southwesterly lower-tropospheric flow with the west-to-east oriented mountain ranges.
![Plot of rawinsonde data from Nome, Alaska [click to enlarge]](https://cimss.ssec.wisc.edu/satellite-blog/images/2020/06/200627_PAOM_RAOBS.GIF)
Plot of rawinsonde data from Nome, Alaska [click to enlarge]
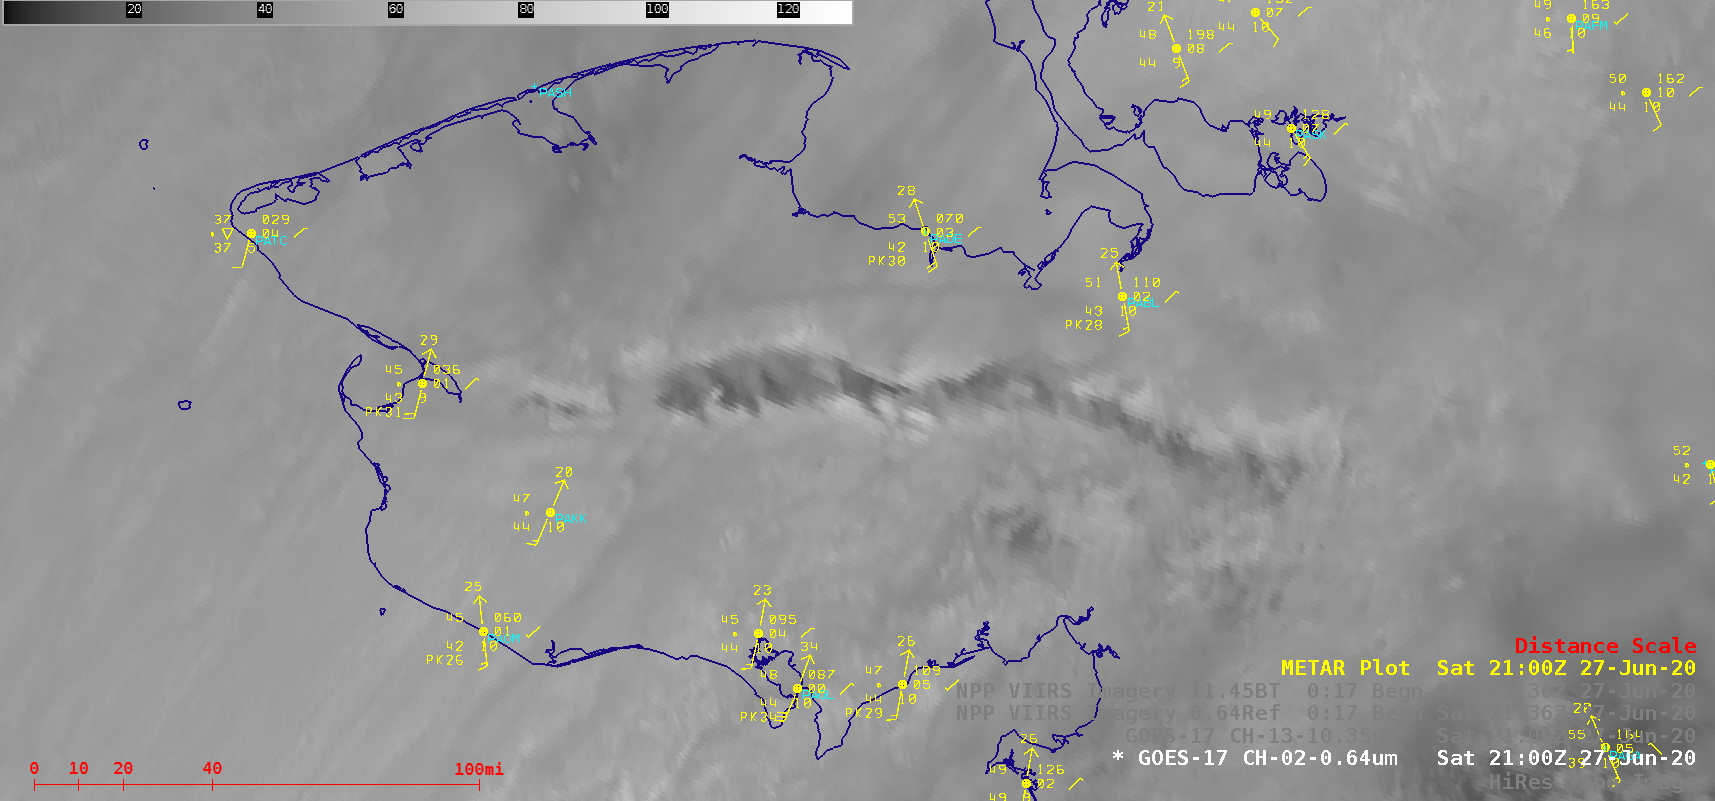
Comparisons of topography and Visible/Infrared images from Suomi NPP and GOES-17 around 1320 UTC and 2140 UTC are shown below. Since there is generally very little
parallax offset associated with imagery from polar-orbiting satellites (such as Suomi NPP), the rotor cloud appeared closer to the topography that helped to force development of that cloud feature.
![Topography, Suomi NPP VIIRS Visible (0.64 µm) and GOES-17 "Red" Visible (0.64 µm) images around 1320 UTC [click to enlarge]](https://cimss.ssec.wisc.edu/satellite-blog/images/2020/06/200627_1320utc_topo_suomiNPP_goes17_visible_AK_anim.gif)
Topography, Suomi NPP VIIRS Visible (0.64 µm) and GOES-17 “Red” Visible (0.64 µm) images around 1320 UTC [click to enlarge]
![Topography, Suomi NPP VIIRS Infrared Window (11.45 µm) and GOES-17 "Clean" Infrared Window (10.35 µm) images around 1320 UTC [click to enlarge]](https://cimss.ssec.wisc.edu/satellite-blog/images/2020/06/200627_1320utc_topo_suomiNPP_goes17_infrared_AK_anim.gif)
Topography, Suomi NPP VIIRS Infrared Window (11.45 µm) and GOES-17 “Clean” Infrared Window (10.35 µm) images around 1320 UTC [click to enlarge]
![Topography, Suomi NPP VIIRS Visible (0.64 µm) and GOES-17 "Red" Visible (0.64 µm) images around 2140 UTC [click to enlarge]](https://cimss.ssec.wisc.edu/satellite-blog/images/2020/06/200627_2140utc_topo_suomiNPP_goes17_visible_AK_anim.gif)
Topography, Suomi NPP VIIRS Visible (0.64 µm) and GOES-17 “Red” Visible (0.64 µm) images around 2140 UTC [click to enlarge]
![Topography, Suomi NPP VIIRS Infrared Window (11.45 µm) and GOES-17 "Clean" Infrared Window (10.35 µm) images around 2140 UTC [click to enlarge]](https://cimss.ssec.wisc.edu/satellite-blog/images/2020/06/200627_2140utc_topo_suomiNPP_goes17_infrared_AK_anim.gif)
Topography, Suomi NPP VIIRS Infrared Window (11.45 µm) and GOES-17 “Clean” Infrared Window (10.35 µm) images around 2140 UTC [click to enlarge]
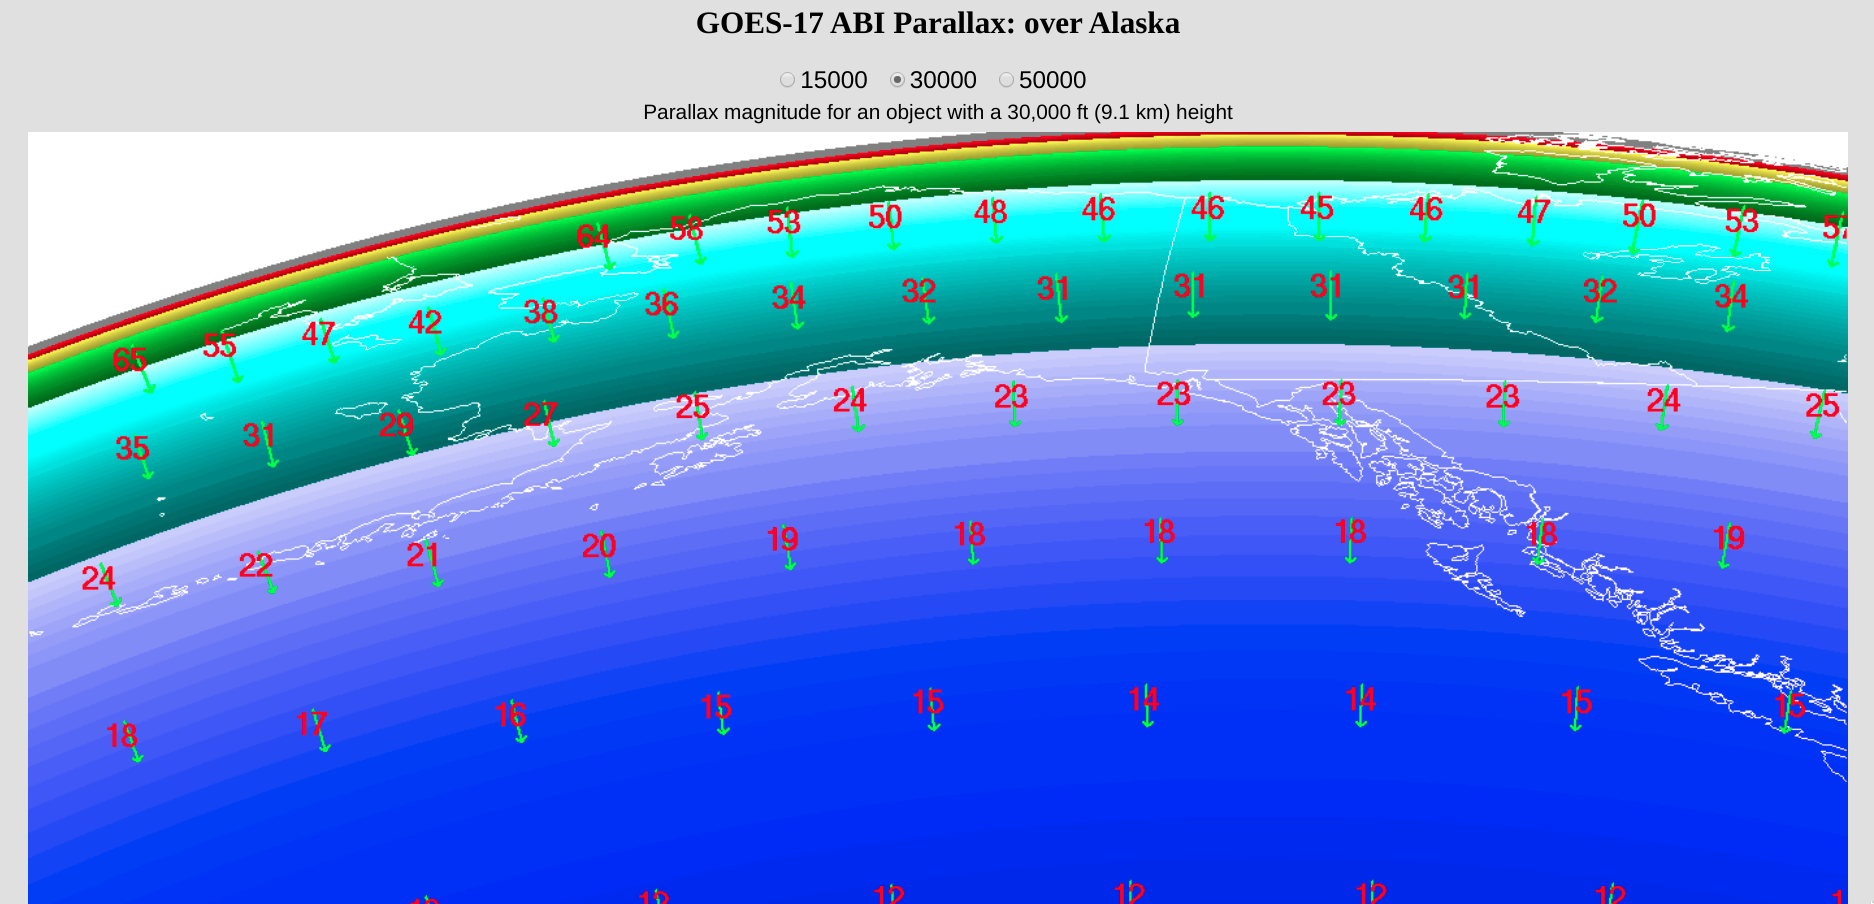
Plots of GOES-17 parallax correction vectors and displacements (in km) for a 30,00-feet (9.1 km) cloud feature at select points over the Alaska region (from
this site) are shown below. For such a cloud feature over the Seward Peninsula, the parallax offset would be about 40 km (25 miles) — which closely corresponded to the offset seen between the GOES-17 and Suomi NPP images shown above.
![Plots of GOES-17 parallax correction vectors and displacements (in km) for a 30,000-foot (9.1 km) cloud feature at select points over the Alaska region [click to enlarge]](https://cimss.ssec.wisc.edu/satellite-blog/images/2020/06/200627_parallax_AK.png)
Plots of GOES-17 parallax correction vectors and displacements (in km) for a 30,000-foot (9.1 km) cloud feature at select points over the Alaska region [click to enlarge]
View only this post
Read Less

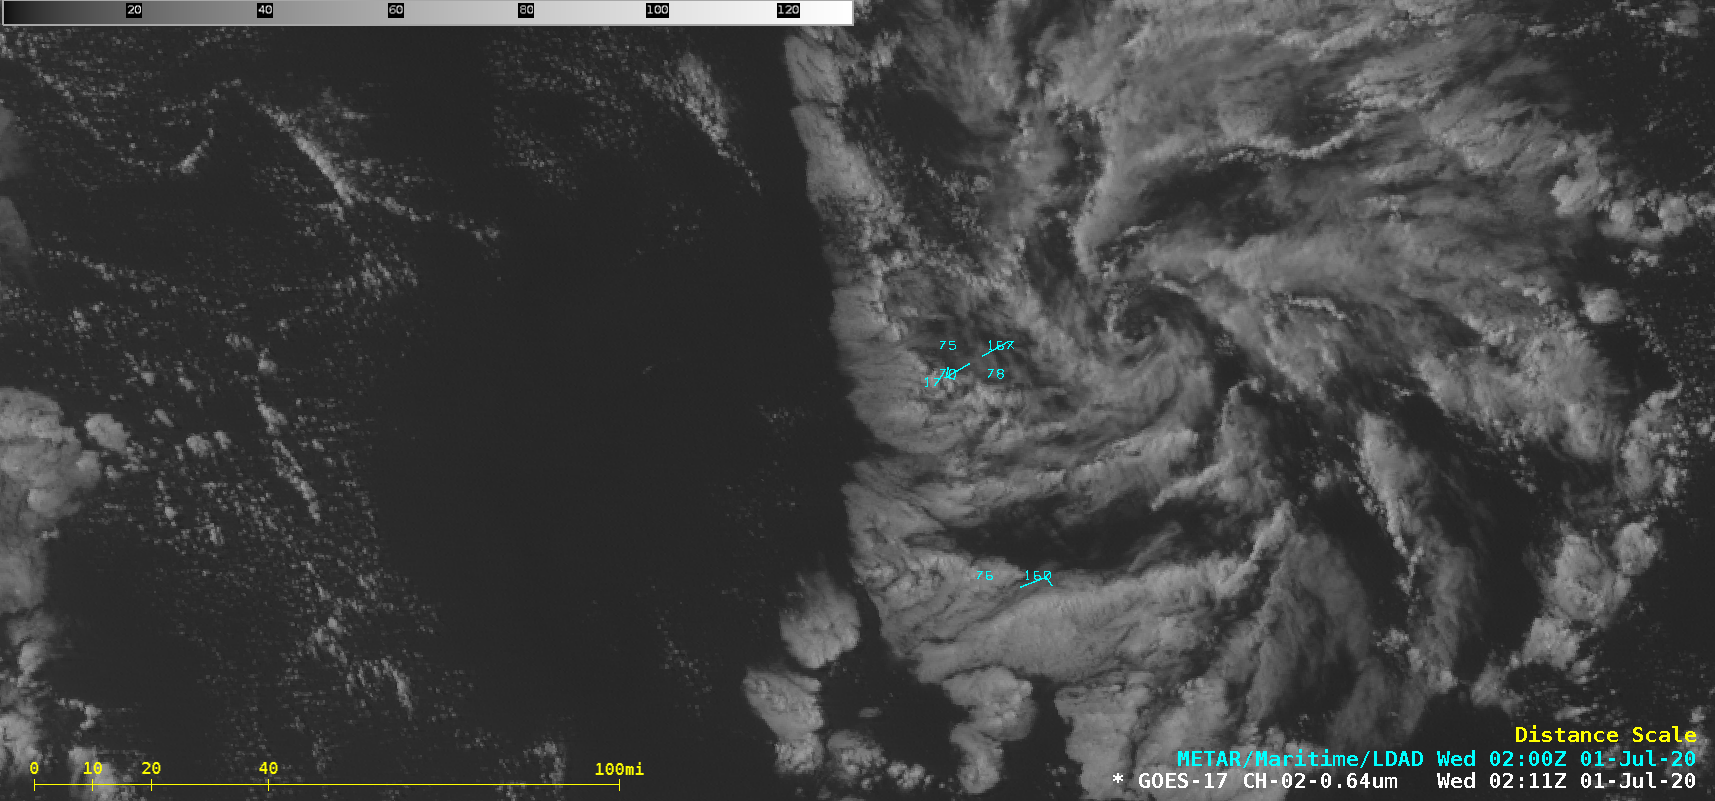
![GOES-17 “Red” Visible (0.64 µm) images [click to play animation | MP4]](https://cimss.ssec.wisc.edu/satellite-blog/images/2020/06/200630_goes17_visible_HI_actinoform_anim.gif)
![GOES-17 “Red” Visible (0.64 µm) images [click to play animation | MP4]](https://cimss.ssec.wisc.edu/satellite-blog/images/2020/06/200630_goes17_visible_HI_buoy51000_actinoform_anim.gif)
![Sequence of 3 hourly (at 0010, 0110 and 0210 UTC) panoramic camera views from Buoy 51000 [click to enlarge]](https://cimss.ssec.wisc.edu/satellite-blog/images/2020/06/200630_buoy51000_panoramic_images_anim.gif)
![True Color RGB and Infrared Window (11.45 µm) images from NOAA-20 and Suomi NPP [click to enlarge]](https://cimss.ssec.wisc.edu/satellite-blog/images/2020/06/200630_2307utc_noaa20_2357utc_suomiNPP_viirs_trueColorRGB_infraredWindow_HI_actinoform_anim.gif)
![Plots of rawinsonde data from Hilo, Hawai'i [click to enlarge]](https://cimss.ssec.wisc.edu/satellite-blog/images/2020/06/200630_PHTO_RAOBS.GIF)
![GOES-16 “Red” Visible (0.64 µm) images, with SPC Storm Reports plotted in red [click to play animation | MP4]](https://cimss.ssec.wisc.edu/satellite-blog/images/2020/06/200628_goes16_visible_spcStormReports_WY_SD_anim.gif)
![GOES-16 “Clean” Infrared Window (10.35 µm) images, with SPC Storm Reports plotted in cyan [click to play animation | MP4]](https://cimss.ssec.wisc.edu/satellite-blog/images/2020/06/200628_goes16_infrared_spcStormReports_WY_SD_anim.gif)
![Plot of rawinsonde data from Rapid City, SD [click to enlarge]](https://cimss.ssec.wisc.edu/satellite-blog/images/2020/06/200629_00UC_KRAP_RAOB.GIF)
![GOES-16 “Red” Visible (0.64 µm) images [click to play animation | MP4]](https://cimss.ssec.wisc.edu/satellite-blog/images/2020/06/200625_goes16_HudsonBay_ice_fast_anim.gif)
![Ice concentration departure from normal [click to enlarge]](https://cimss.ssec.wisc.edu/satellite-blog/images/2020/06/200622_HudsonBay_ice_concentration_departure.gif)
