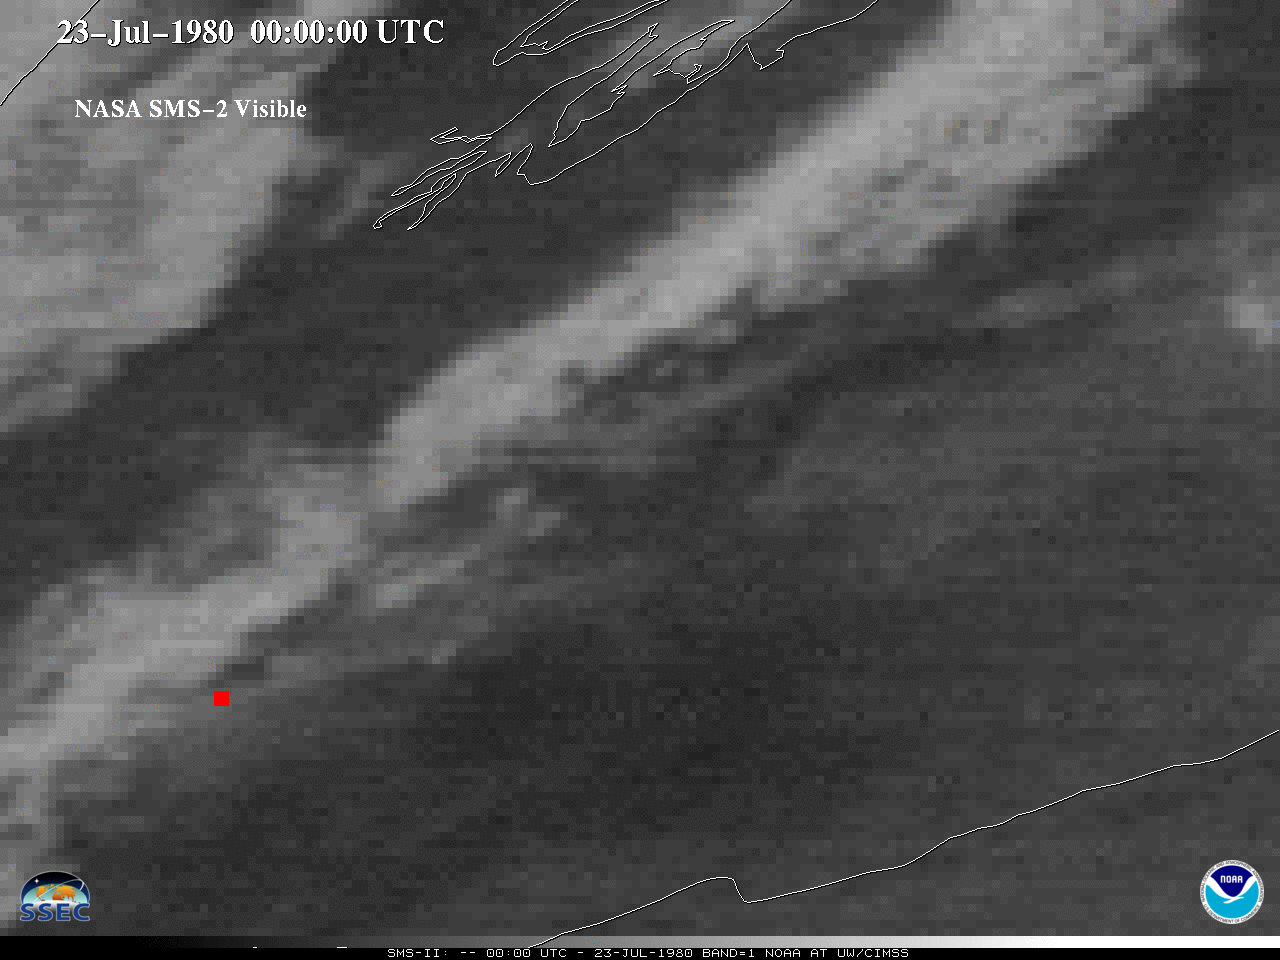
The main modern Mount St. Helens eruption was May 18, 1980 — yet there were also later paroxysmal eruptions, such as on June 12/13, 1980. Geostationary satellite imagery from NASA’s SMS-2 (Synchronous Meteorological Satellite) monitored two more Mount St. Helens eruptions on July 22th (local time), 1980, as shown above. Note that in... Read More
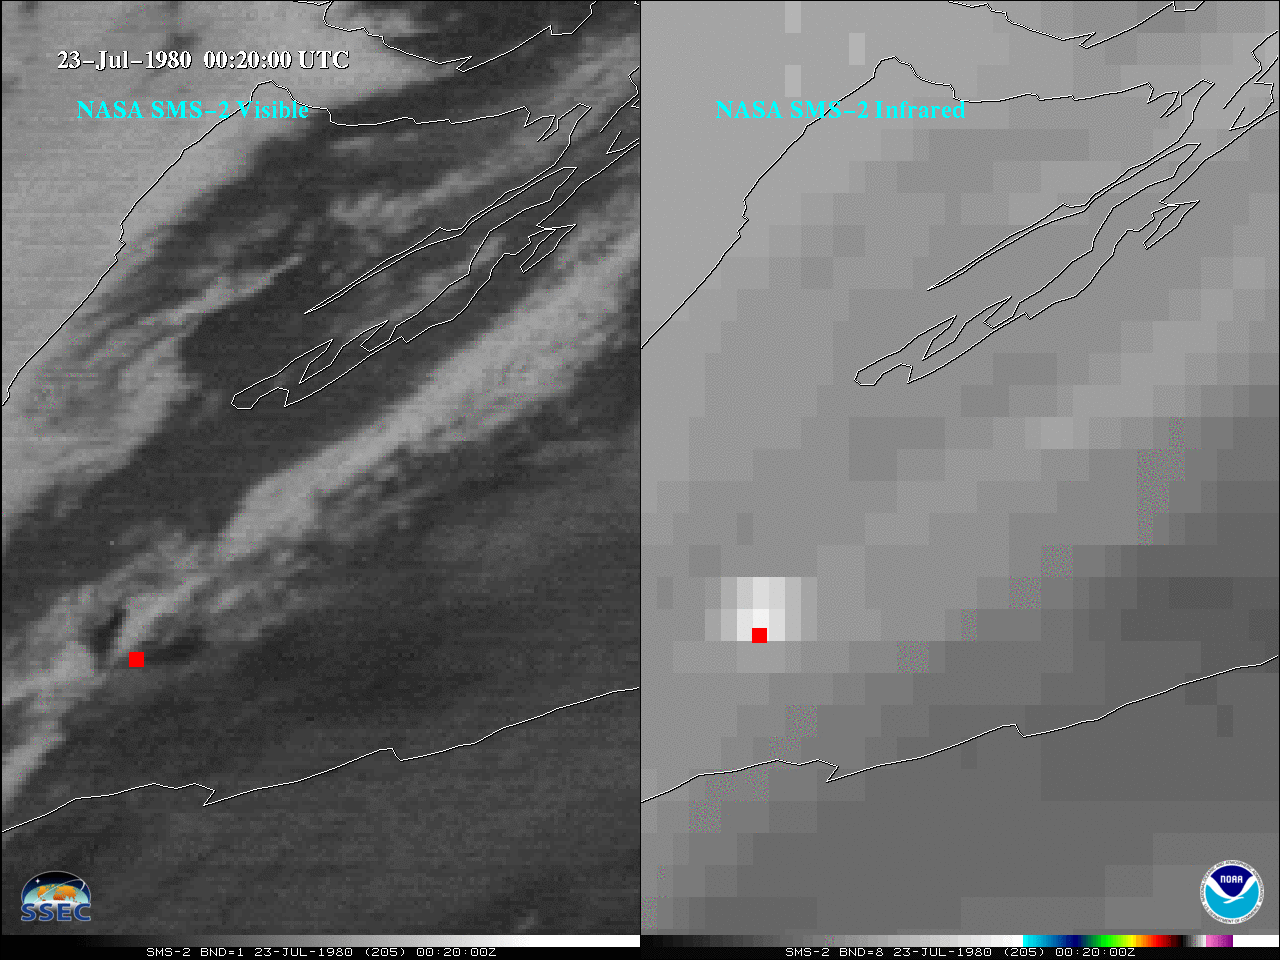
SMS-2 Visible and infrared (IR) from July 23, 1980. The red square represents the approximate location of Mount St. Helens. [click to play animation | MP4]
The main modern Mount St. Helens eruption was May 18, 1980 — yet there were also later paroxysmal eruptions, such as on June 12/13, 1980. Geostationary satellite imagery from NASA’s SMS-2 (Synchronous Meteorological Satellite) monitored two more Mount St. Helens eruptions on July 22th (local time), 1980, as shown above. Note that in “UTC-time”, the eruption took place on July 23rd. A similar side-by-side SMS-2 visible and infrared animation. This may be the first* “rapid scan” imaging of a volcanic ash plume (with a 3-minute cadence for almost an hour), where “rapid scan” is defined as satellite imagery less than 5 min apart.
There is a long history of rapid scan imaging from geostationary imagers, including from SMS-1/2, ATS-1, ATS-3, GOES-1, GOES-7 series, GOES-8 series, GOES-14 , Meteosat, etc and of course, AHI and the GOES-R series ABI where 1-min imagery is routine. Here’s a page where users can search historical meso-scale sector locations from the University of Wisconsin-Madison SSEC Satellite Data Services.
The monitoring of volcanic ash plumes and their attributes have greatly increased from 1980 to today. Moving from qualitative (somewhat after the fact imagery) to quantitative applications (that are much more timely)! Due to the large number of volcanoes, coupled with the increase in satellite observations, satellite observations are key in monitoring the world’s volcanoes for aviation safety and other uses. More on volcanic ash monitoring.
SMS-2
A similar loop as above (SMS-2 Visible and IR from July 23, 1980), but the in mp4 format. Both the day before and after, SMS-02 was in a routine scan mode of imagery every 30 minutes. The rapid scan imagery was just on July 23, 1980 for approximately one hour, starting at 00:14 UTC.
This webpage allows to customize the loop speed of the SMS visible and infrared side-by-side animation. This uses the hanis software.
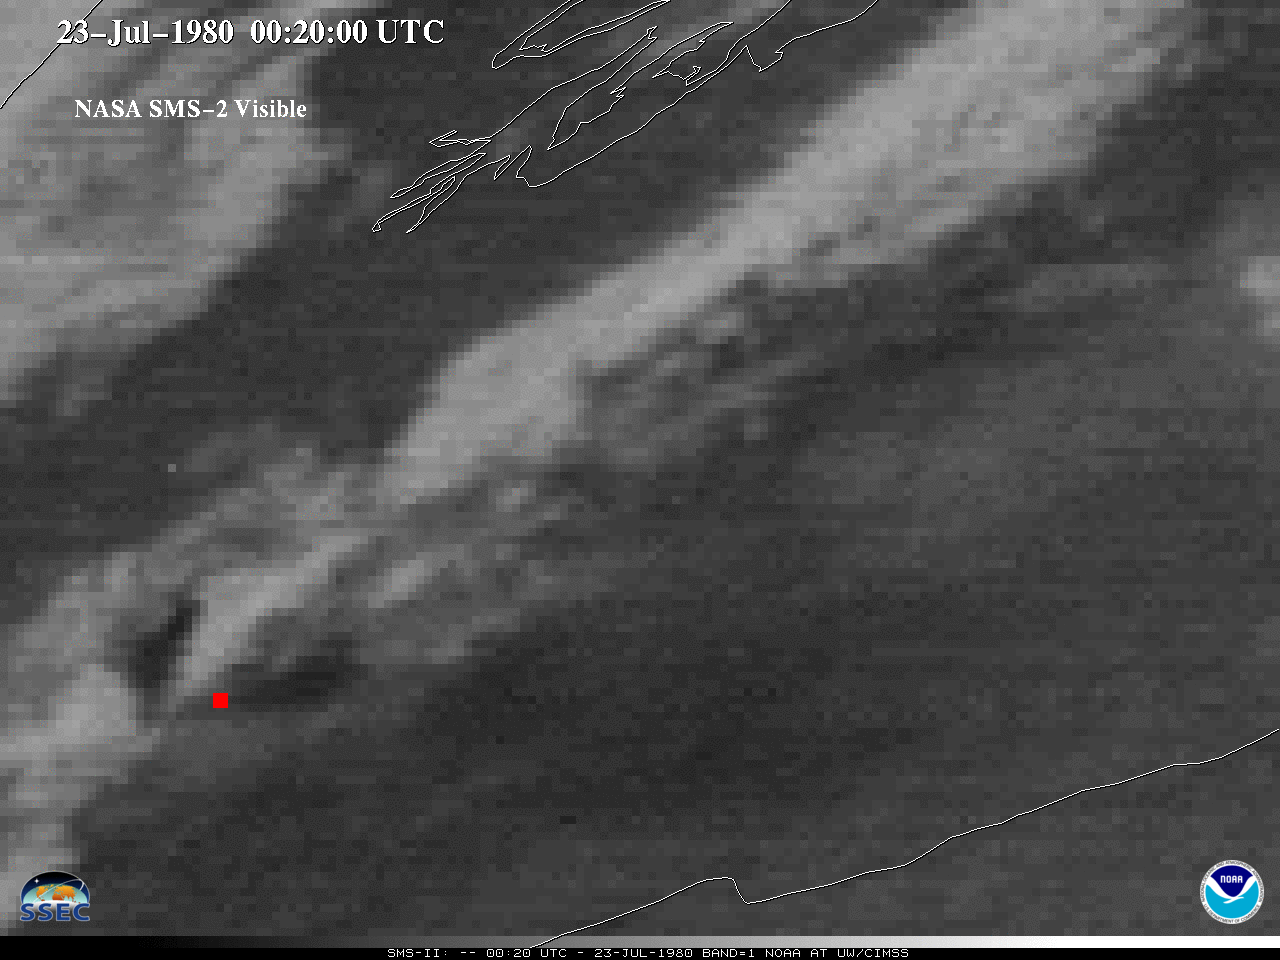
SMS-2 Visible from July 23, 1980 covering approximately one hour. The red square represents the approximate location of Mount St. Helens. [click to play animation | MP4]
The shadows from the plume are evident.
A longer duration (4-hr) SMS-02 IR animation (mp4) or (animated gif). The red square represents the approximate location of Mount St. Helens. Note the less than ideal image navigation.
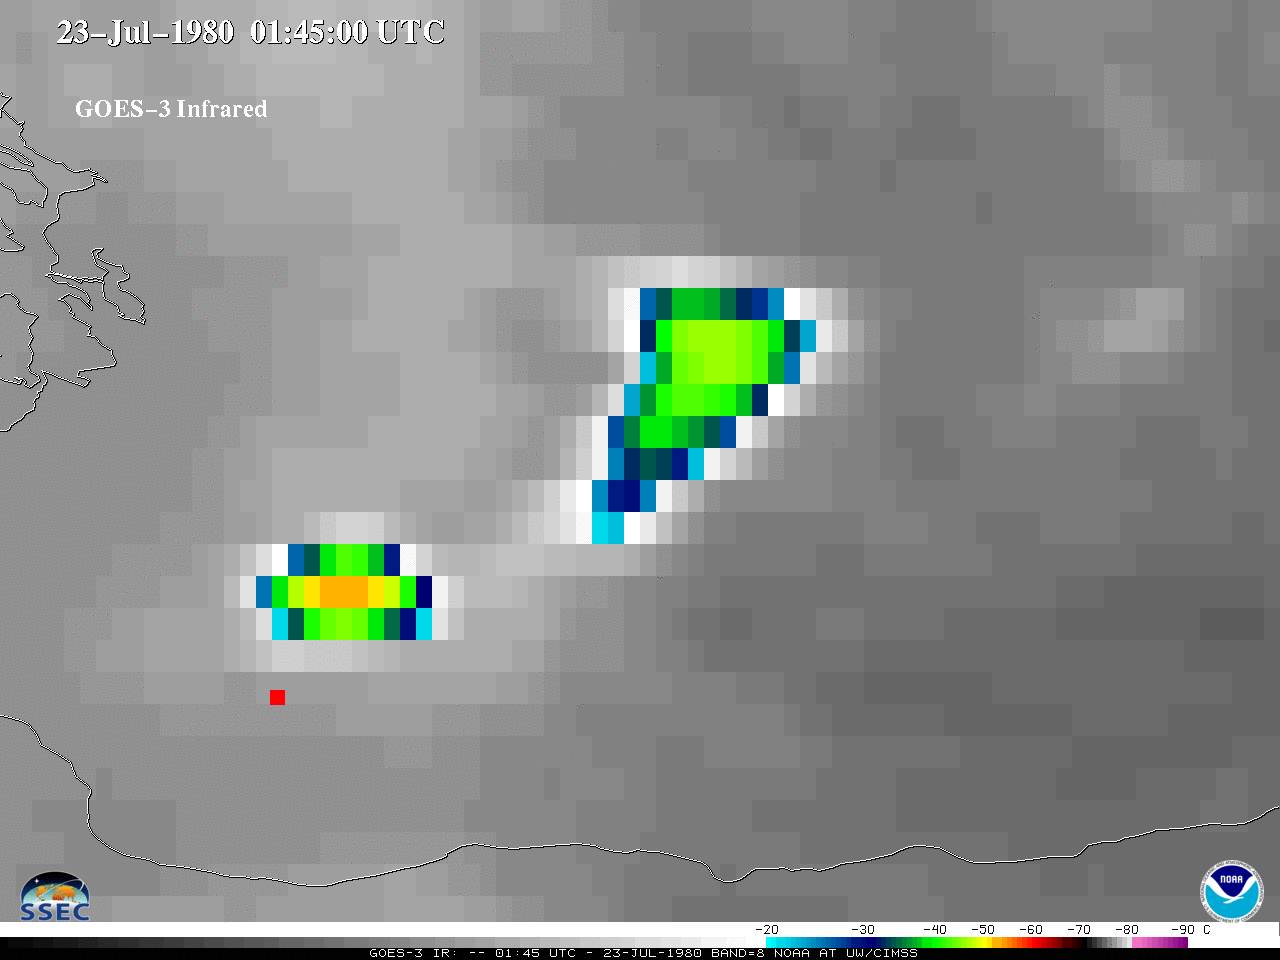
GOES-3
NOAA’s GOES-3 was also operating, although not in a rapid scan mode, so imagery was every 30 minutes.

GOES-3 IR July 23, 1980 over 4 hours. The red square represents the approximate location of Mount St. Helens. [click to play animation | MP4]
The two pulses are clearly evident.
H/T
Thanks to Jean Phillips, the SSEC Data Services, and the Scott’s (Bachmeier and Lindstrom). NASA SMS-2 and NOAA GOES-3 data are via the University of Wisconsin-Madison SSEC Satellite Data Services. More GOES-R series information.
* There may have been rapid scan satellite observations of volcanic ash plumes prior to this case in 1980, and if you know of any, please contact T. Schmit.
View only this post
Read Less
![GOES-16 “Red” Visible (0.64 µm) and “Clean” Infrared Window (10.35 µm) images [click to play animation | MP4]](https://cimss.ssec.wisc.edu/satellite-blog/images/2020/07/200725_goes16_visible_infrared_Hurricane_Hanna_TX_anim.gif)
![GOES-16 “Clean” Infrared Window (10.35 µm) images, with an overlay of GLM Flash Extent Density [click to play animation | MP4]](https://cimss.ssec.wisc.edu/satellite-blog/images/2020/07/200725_goes16_infrared_glmFlashExtentDensity_Hurricane_Hanna_TX_anim.gif)
![Infrared images from Suomi NPP and GOES-16 ABI [click to enlarge]](https://cimss.ssec.wisc.edu/satellite-blog/images/2020/07/200725_1923utc_suomiNPP_1926utc_goes16_infrared_Hurricane_Hanna_anim.gif)

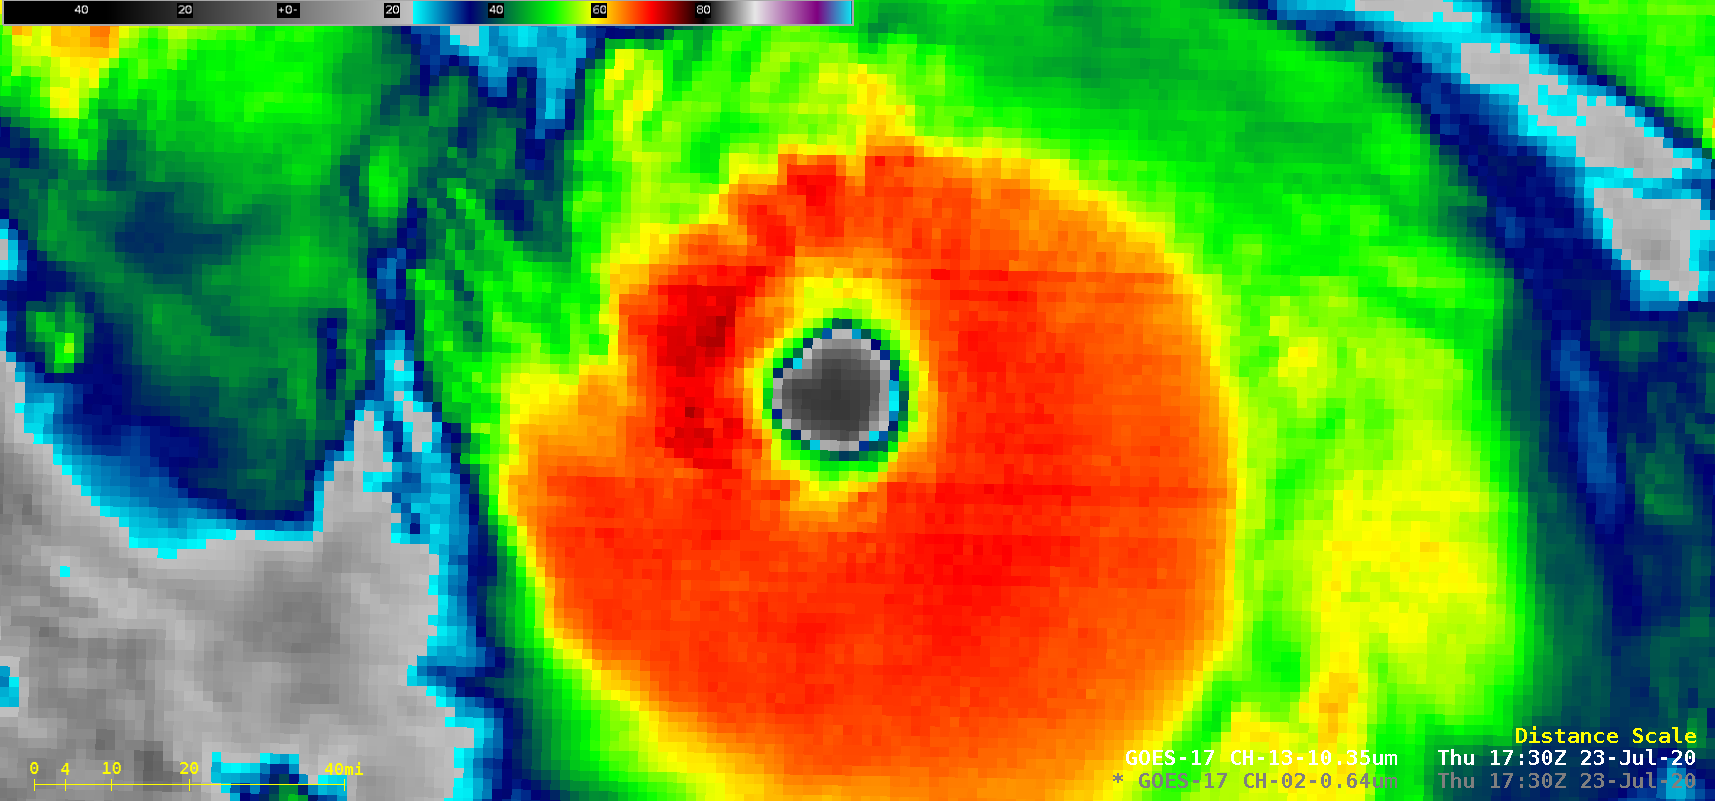
![GOES-17 “Red” Visible (0.64 µm) and “Clean” Infrared Window (10.35 µm) images [click to play animation | MP4]](https://cimss.ssec.wisc.edu/satellite-blog/images/2020/07/200722_goes17_visible_infrared_Hurricane_Douglas_anim.gif)
![GOES-17 “Red” Visible (0.64 µm) and “Clean” Infrared Window (10.35 µm) images [click to play animation | MP4]](https://cimss.ssec.wisc.edu/satellite-blog/images/2020/07/200723_goes17_visible_infrared_Hurricane_Douglas_anim.gif)
![GOES-17 “Red” Visible (0.64 µm) and “Clean” Infrared Window (10.35 µm) images at 1701 UTC [click to enlarge]](https://cimss.ssec.wisc.edu/satellite-blog/images/2020/07/200723_1701utc_goes17_visible_infrared_Hurricane_Douglas_anim.gif)
![Suomi NPP VIIRS Infrared Window (11.45 µm) image [click to enlarge]](https://cimss.ssec.wisc.edu/satellite-blog/images/2020/07/200723_1035utc_suomiNPP_viirs_infrared_Hurricane_Douglas.png)
![NOAA-20 True Color RGB and VIIRS Infrared Window (11.45 µm) images [click to enlarge]](https://cimss.ssec.wisc.edu/satellite-blog/images/2020/07/200723_2233utc_noaa20_viirs_trueColorRGB_infraredWindow_Hurricane_Douglas_anim.gif)
![GOES-17 “Red” Visible (0.64 µm) and “Clean” Infrared Window (10.35 µm) images [click to play animation | MP4]](https://cimss.ssec.wisc.edu/satellite-blog/images/2020/07/200724_goes17_visible_infrared_Hurricane_Douglas_anim.gif)


