Mount St. Helens: June 1980
SMS-2
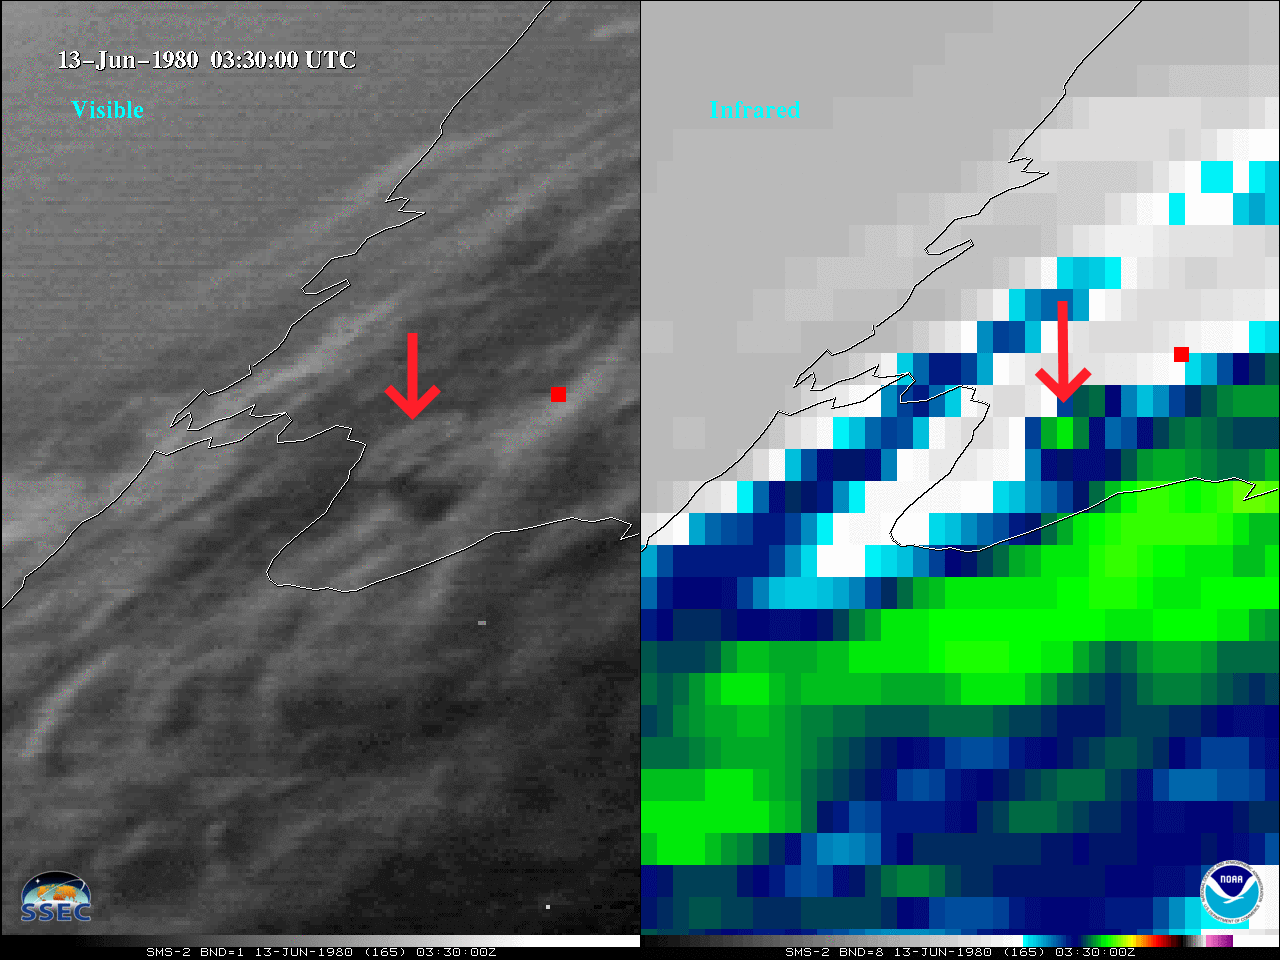
Visible and Infrared NASA SMS-2 animation on June 13, 1980 between 02:30 and 07:00 UTC. The red square denotes the approximate location of Mount St. Helens, and the arrows highlight the plumes of the two separate eruptions. [Click to play mp4]
The main Mount St. Helens eruption was May 18, 1980 — yet there were also later paroxysmal eruptions. Imagery from NASA’s SMS-2 (Synchronous Meteorological Satellite) monitored two more Mount St. Helens eruptions on June 12th (local time), 1980, as shown above. Note that in “UTC-time”, the eruption took place on June 13th. A similar side-by-side SMS-2 visible and infrared animation (without the arrows) is available here (in addition to one without the red location box).

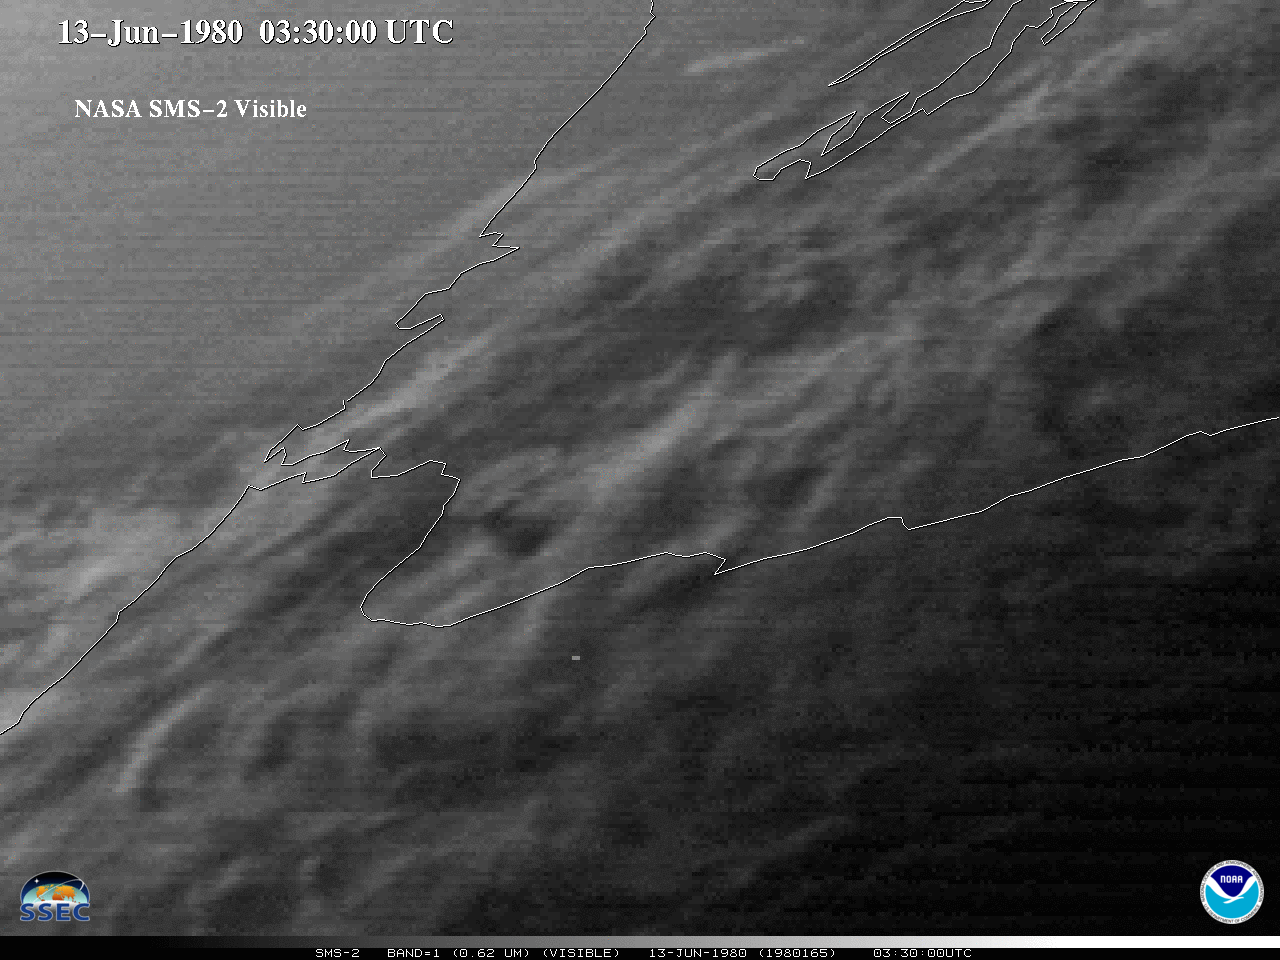
NASA SMS-2 visible animation from June 13th (02:00 to 04:00 UTC), 1980. The red square denotes the approximate location of Mount St. Helens. [Click to play mp4]
A visible band animation without the red square at the location of Mount St. Helens is shown above. The second plume coated Portland (OR) with ash. For more on this case, see Wikipedia and the USGS. Here’s the same loop and image, but without the red location box.
The volcanic ash plume was also evident in the infrared window band, below, but the imagery has fairly coarse spatial (and temporal) resolution compared to today’s GOES-R series ABI (which allows much improved volcanic cloud monitoring). This longer IR loop shows the 2nd plume as well.
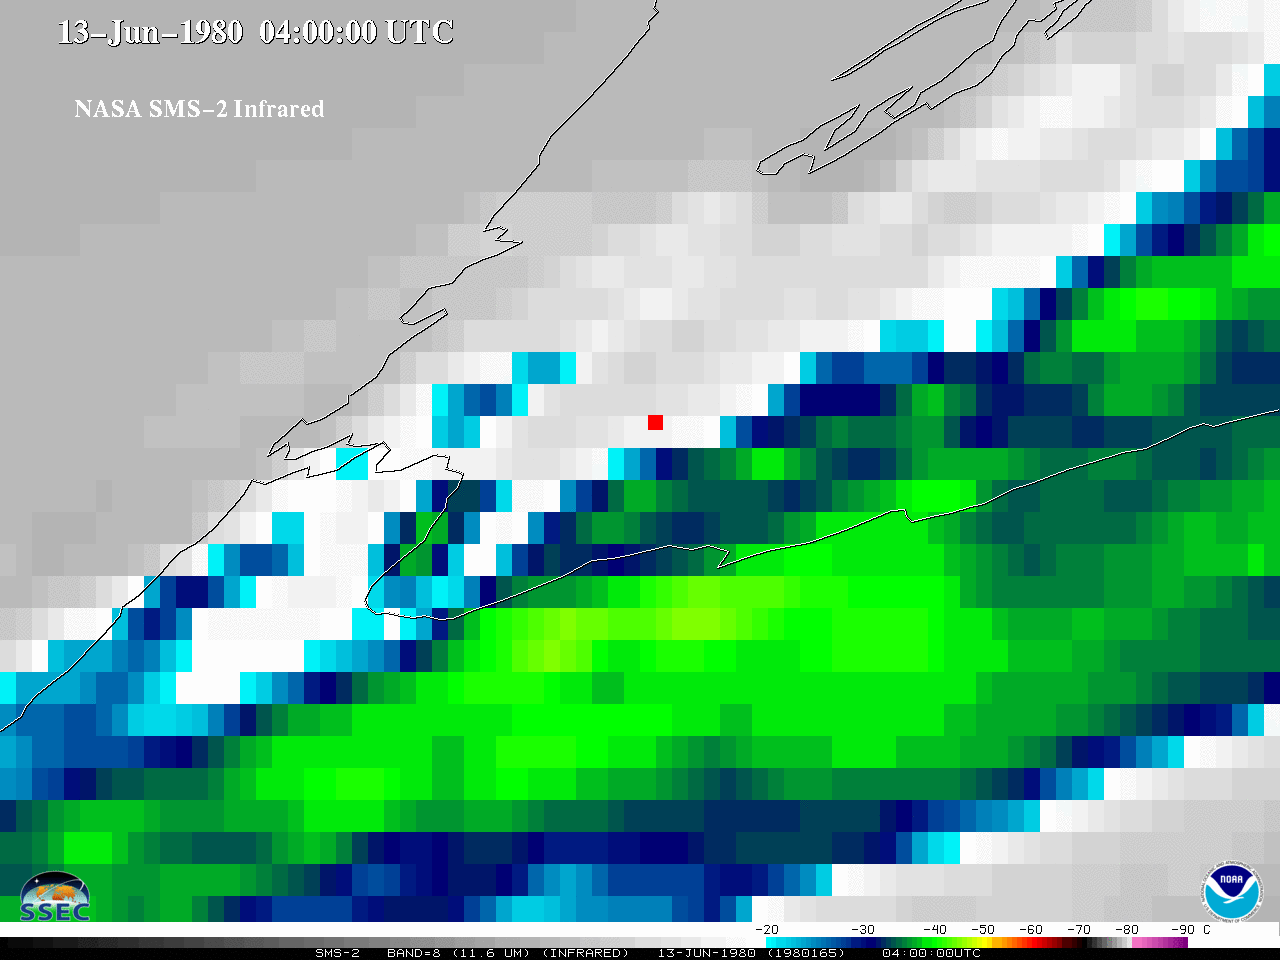
NASA SMS-2 infrared animation from June 13th (02:45 to 04:00 UTC), 1980. The red square denotes the approximate location of Mount St. Helens. [Click to play mp4]
Swipe between SMS-2 Visible and Infrared bands. Red square notes Mount St. Helens location.
[Not supported for every browser.]
Fade between a SMS-2 Visible and Infrared band.
Note that there is a geolocation offset between the two spectral bands. The satellite times listed are the image scan start times.
GOES-3
The experimental SMS series followed the ATS series, and was a precursor to the operational GOES.
GOES -3 also observed both volcanic ash plumes.
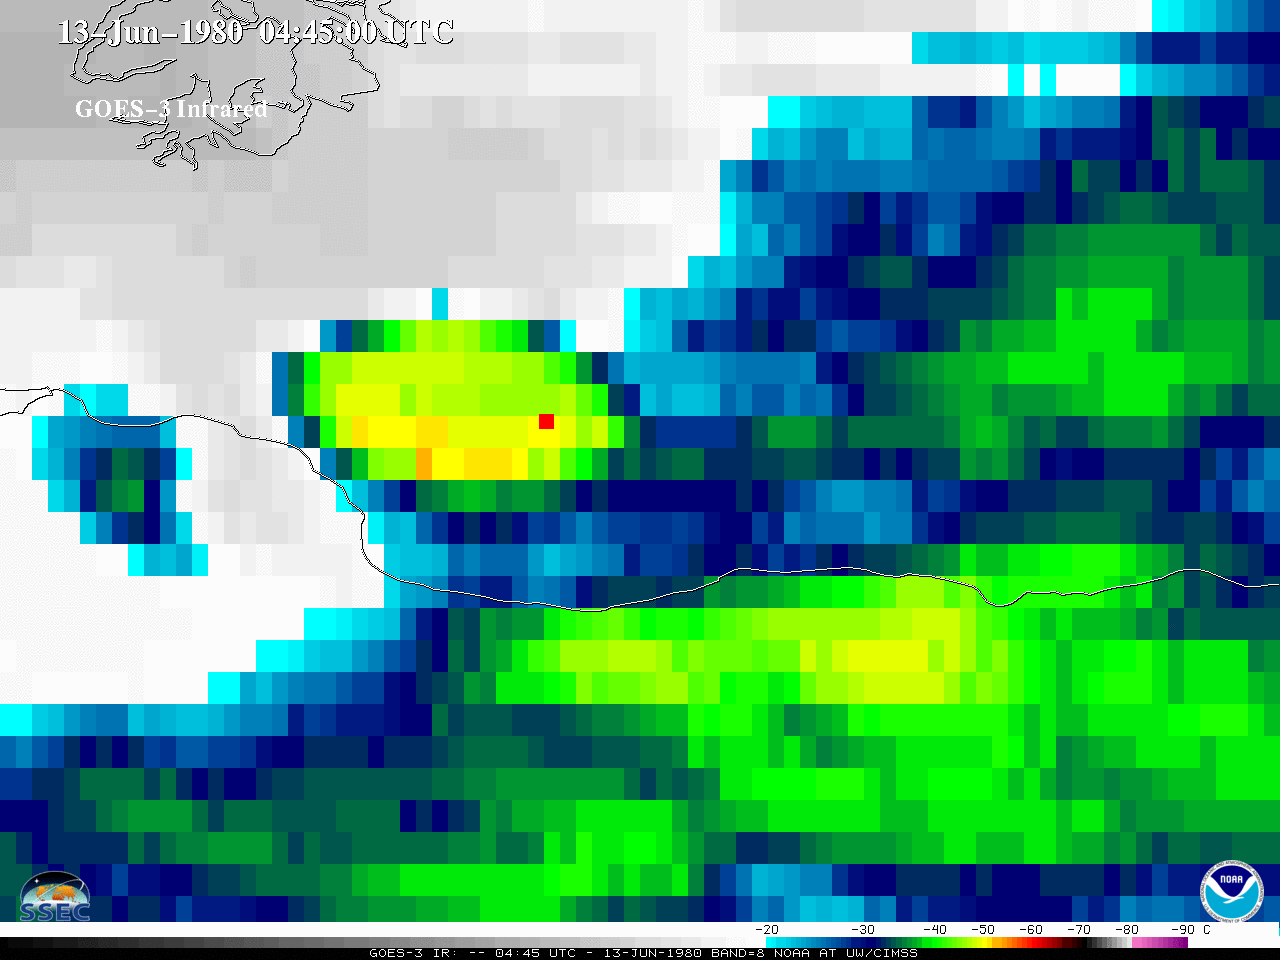
GOES-3 Infrared animation from June 13, 1980. [Click to play mp4]
A slightly longer GOES-3 infrared animation is available here. NASA SMS-2 and NOAA GOES-3 data are via the University of Wisconsin-Madison SSEC Satellite Data Services.