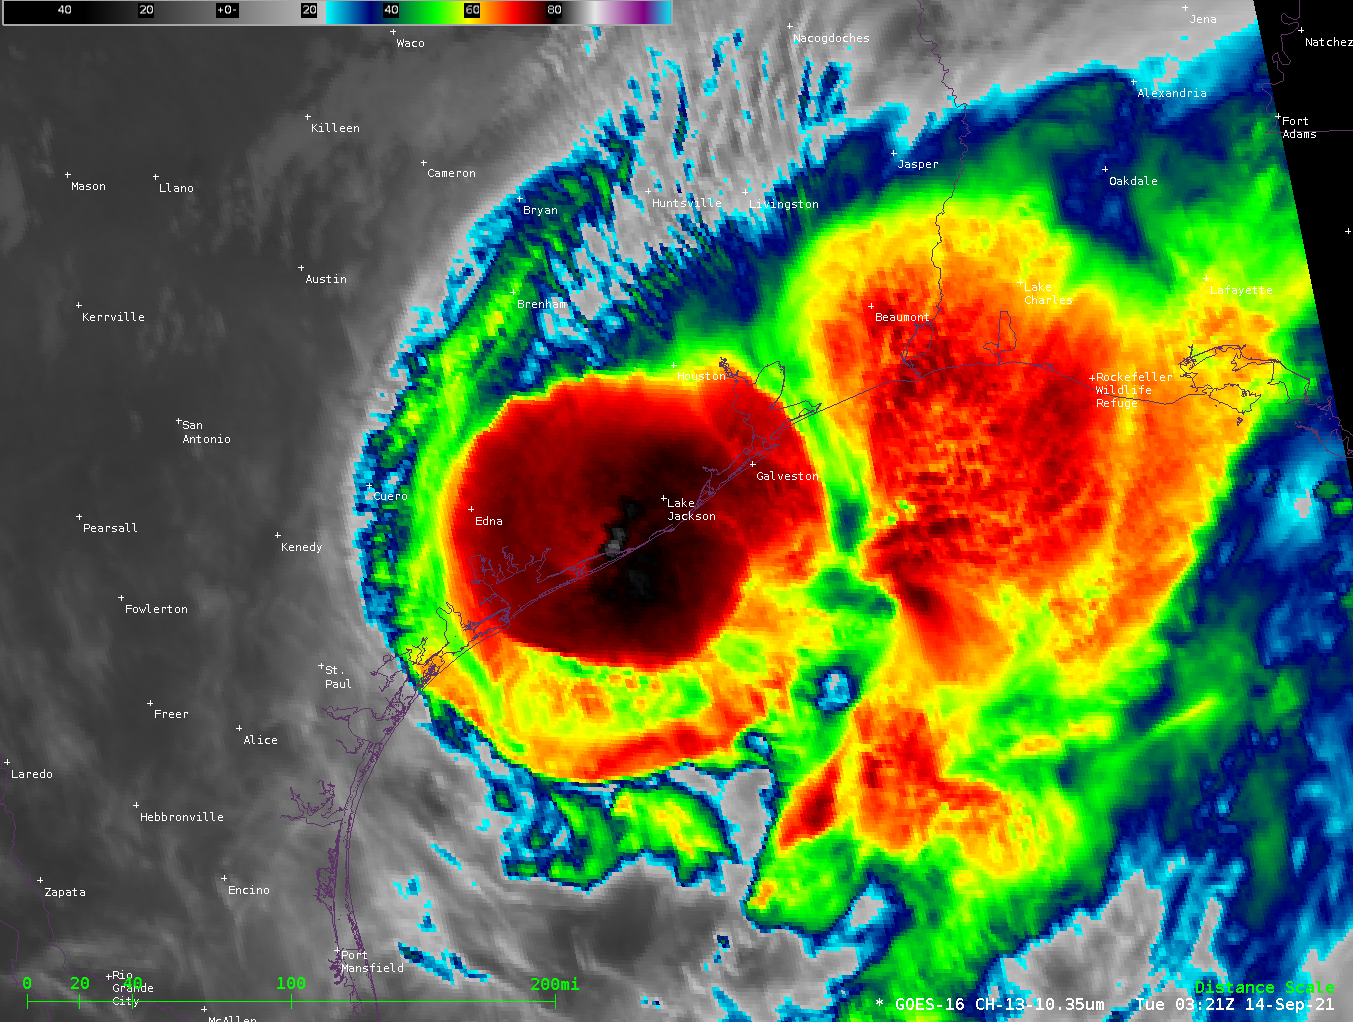
Hurricane Nicholas made landfall on the Gulf Coast shortly after 0530 UTC on 14 September. It is a challenge to determine the storm center from the animation above, although deep convection is suggestive of its location. Note the collapse of deep convection as well at the end of the animation. Radar imagery, below (from this site), is helpful in placing the storm center.
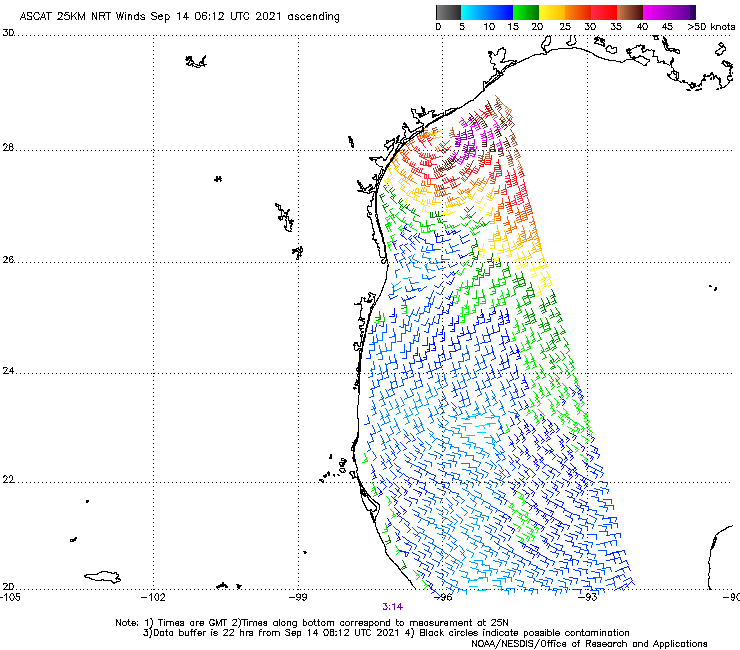
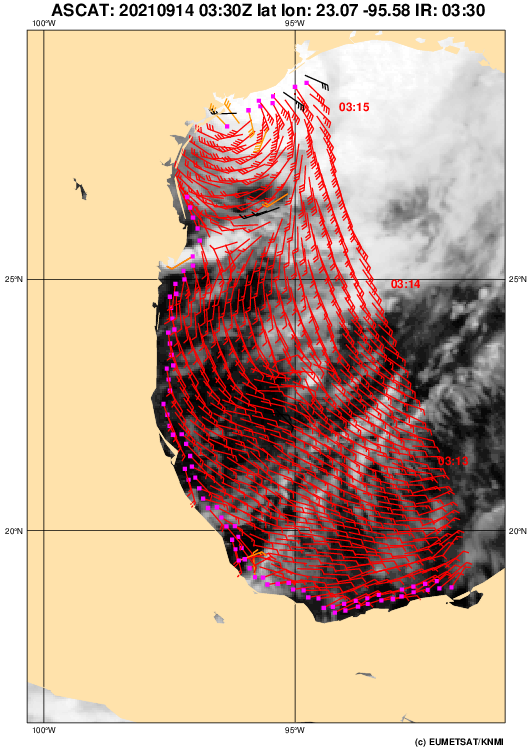
MetOp-B overflew Nicholas at 0315 UTC shortly before landfall. ASCAT winds (from this site) at 0315 UTC show the circulation center very close to the shoreline. A similar image from the OSI SAF Multiplatform viewer is here.
Nicholas is embedded in very moist air. A 24-hour MIMIC Total Precipitable Water animation, below, shows the moisture plume. Heavy rain is forecast for the central Gulf Coast.
Nicholas has weakened to a Tropical Storm as of 0900 UTC on 14 September. Refer to the National Hurricane Center website for more information.
View only this post Read Less


