
GOES-16 Dust RGB and Mid-level Water Vapor (6.9 µm) images [click to play animated GIF | MP4]
A sequence of 1-minute Mesoscale Domain Sector GOES-16 (GOES-East) Dust RGB and Mid-level Water Vapor (6.9 µm) images (above) showed the development of dense plumes of blowing dust (whose source regions were primarily in southeast Colorado and the Oklahoma/Texas Panhandles) on 15 December 2021. These dust plumes were being lofted by strong winds along and behind a cold front — which was associated with a rapidly-intensifying midlatitude cyclone. This storm then caused a broad swath of severe weather (SPC Storm Reports) as it moved rapidly northeastward toward the Great Lakes.
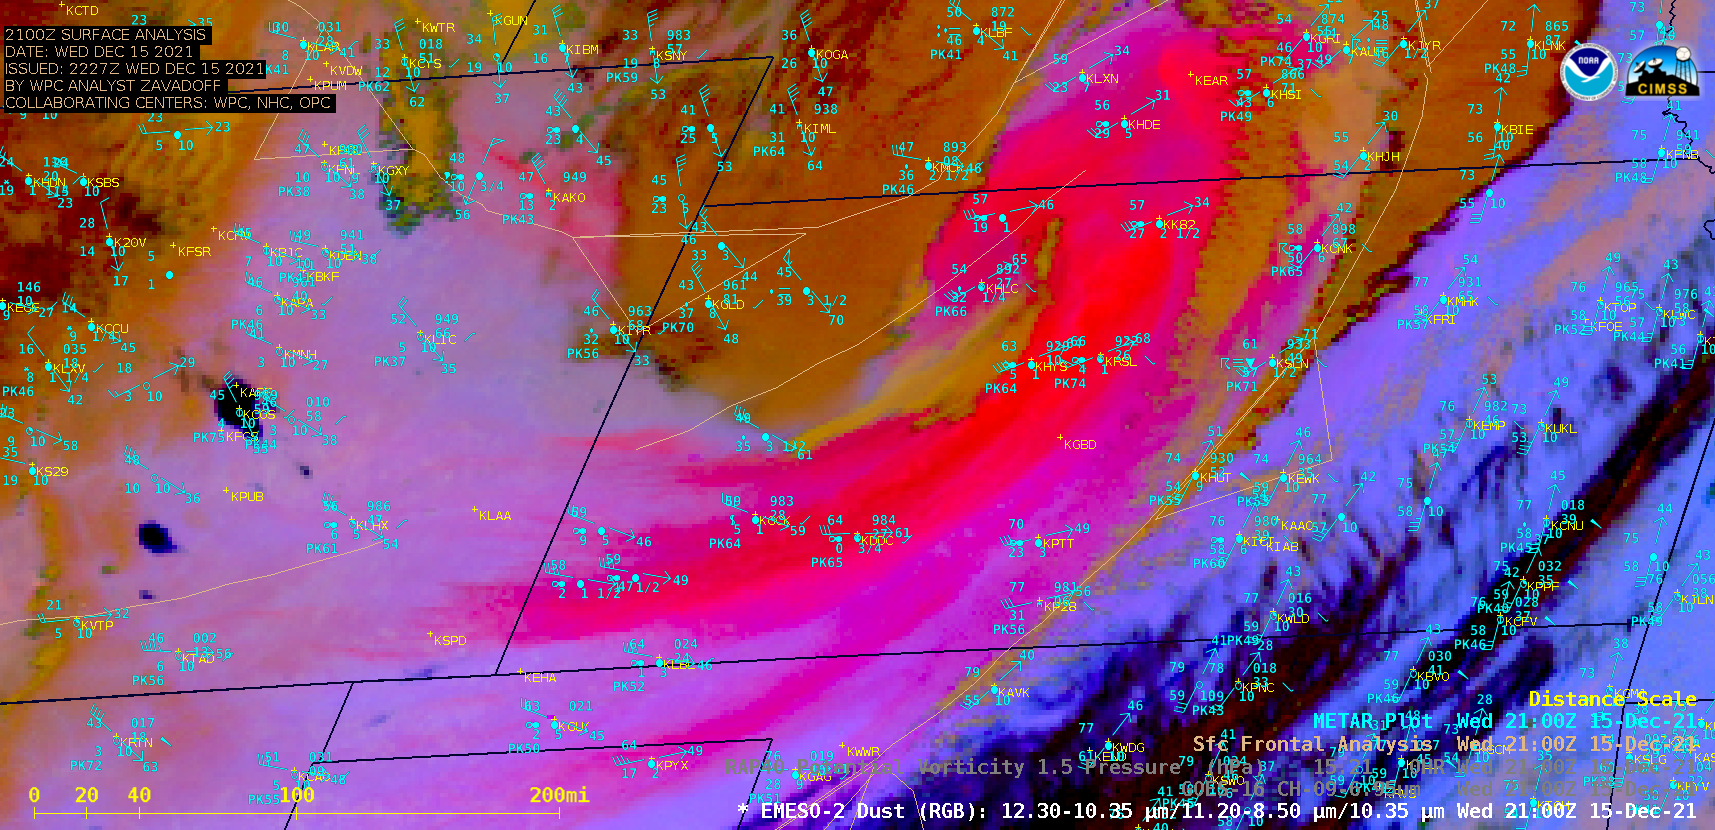
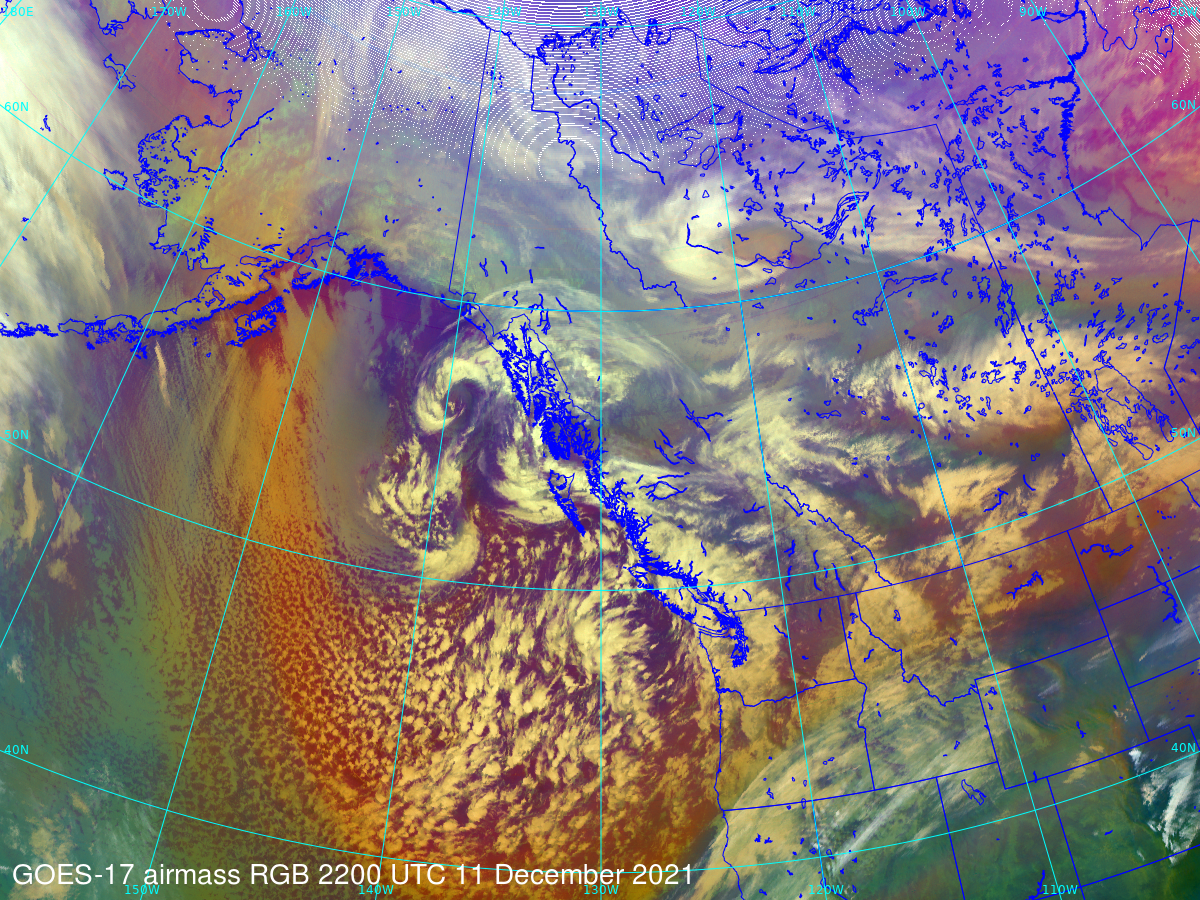
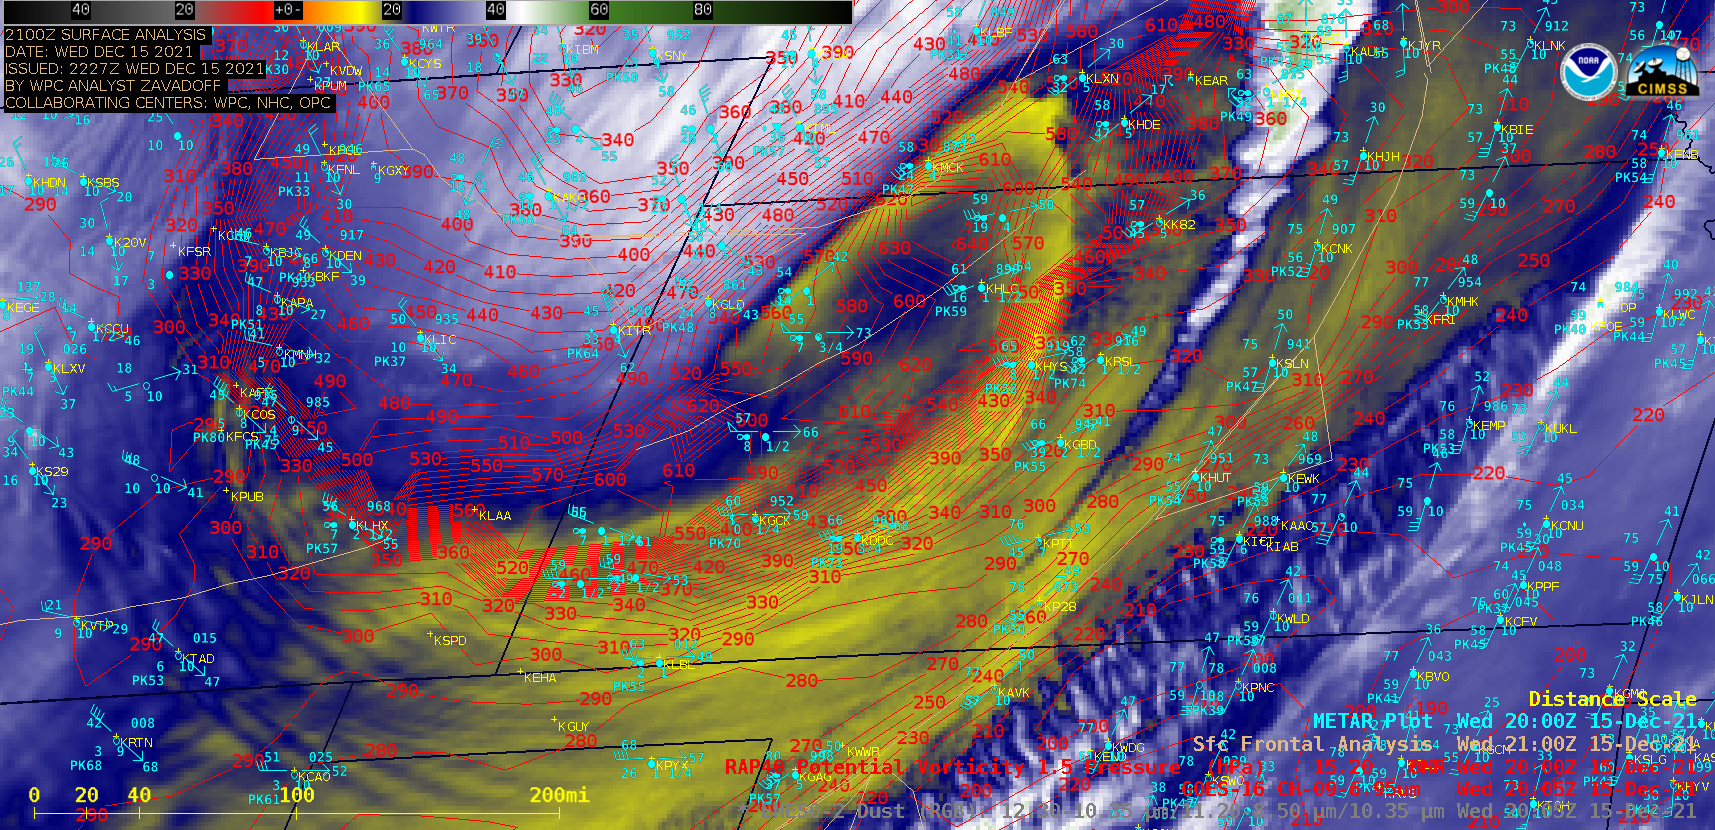
GOES-16 Mid-level Water Vapor images with and without contours of hourly RAP model PV1.5 pressure (below) identified a Potential Vorticity (PV) anomaly which tracked northeastward across the region, indicating that the “dynamic tropopause” descended to the 700-750 hPa pressure level — which helped to transfer the momentum of strong winds aloft toward the surface. The general appearance of the water vapor imagery was similar to that seen in other cases when a “sting jet” helped to transport momentum aloft to the surface where high winds were observed (a sting jet is often found near the hook-shaped “scorpion tail” portion of the water vapor signature). The downward transport of dry mid/upper tropospheric air was supported by a rapid decrease in surface dewpoint temperature, seen at at a number of sites where the dewpoint dropped to below 0ºF (for example, from west to east across Kansas at Johnson KS | Ulysses KS | Pratt KS). Note that the brightest shades of pink/magenta on the GOES-16 Dust RGB images were located behind the primary eastward-moving cold front, where stronger winds associated with the sting jet had descended to the surface.

GOES-16 Mid-level Water Vapor (6.9 µm) images, with and without contours of hourly RAP model PV1.5 pressure [click to play animated GIF | MP4]
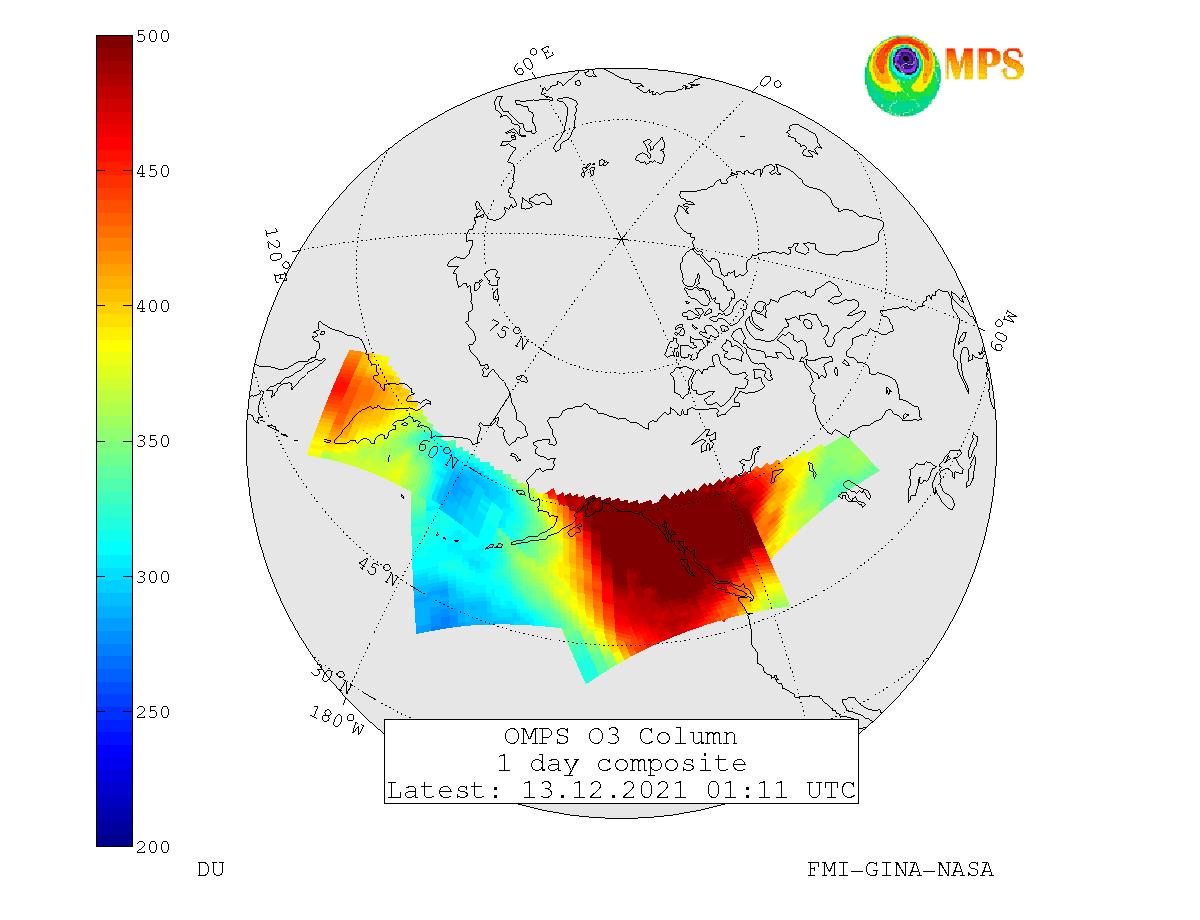
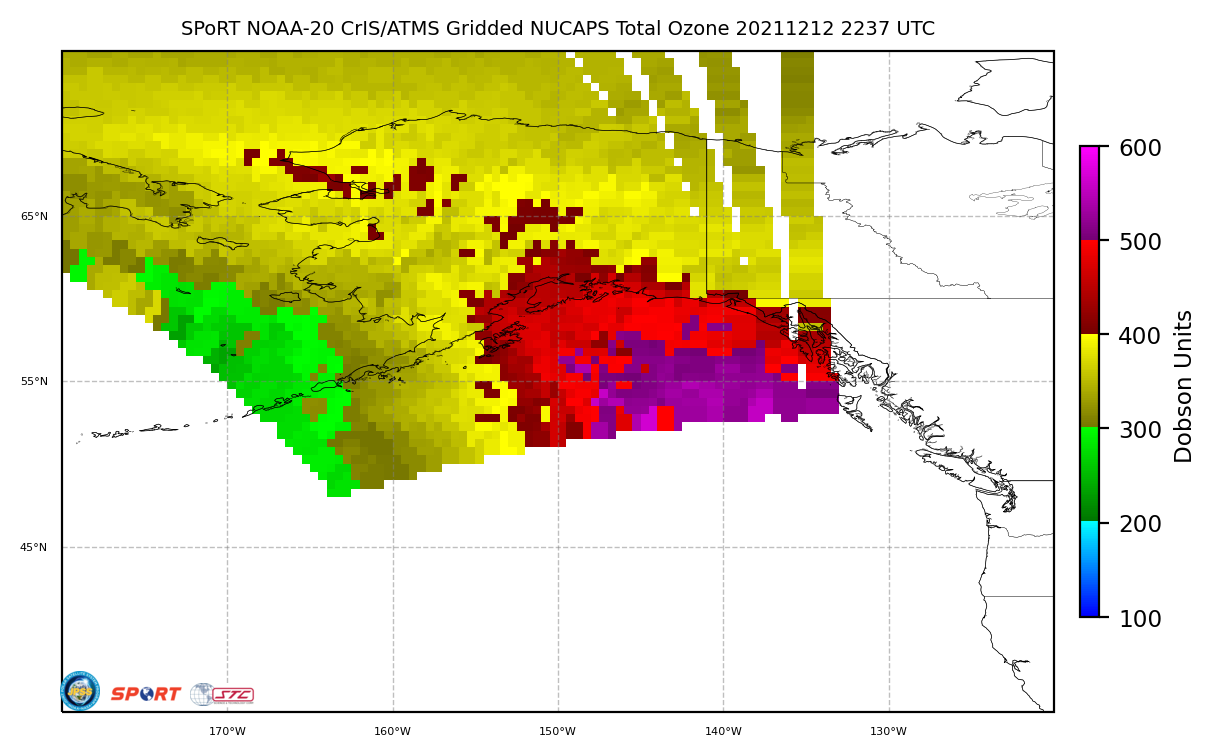
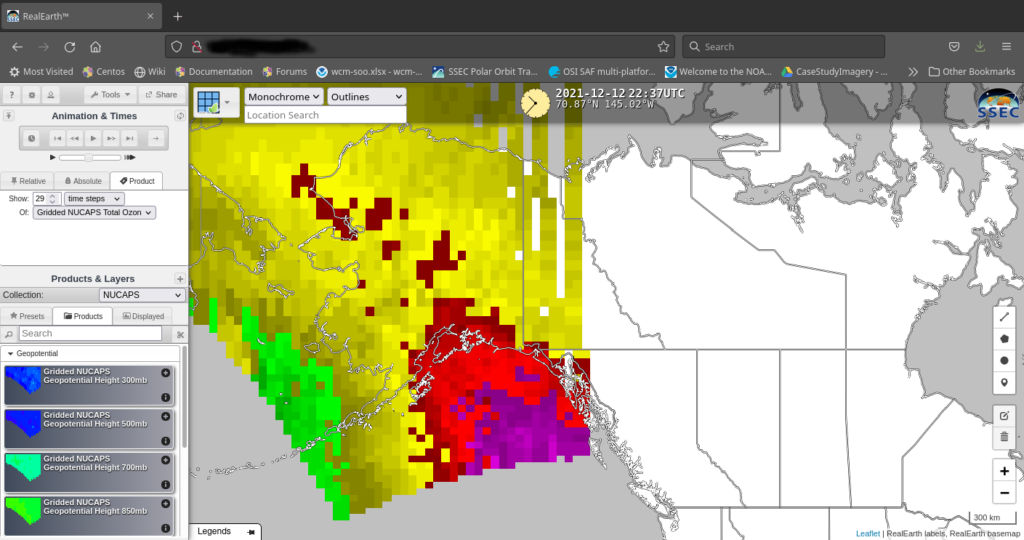
A toggle between NOAA-20 NUCAPS-derived Tropopause Height, Total Column Ozone and Total Column Ozone Anomaly from the NASA SPoRT site (below) supported the presence of a PV anomaly over northwestern Kansas around that time, characterized by a low tropopause with anomalously-high total column ozone (2000 UTC GOES-16 Water Vapor image + PV1.5 pressure).
NOAA-20 NUCAPS Tropopause Height, Total Column Ozone and Total Column Ozone Anomaly around 1948 UTC [click to enlarge]

GOES-16 True Color RGB images [click to play animated GIF | MP4]
GOES-16 True Color RGB images created using Geo2Grid (above) highlighted the tan-colored blowing dust plumes (along with a couple of brighter-white wildfire smoke plumes) as they progessed northeastward across Kansas and Nebraska. A larger-scale view of GOES-16 Dust RGB images (below) showed that during the subsequent nighttime hours into the next morning, the brighter pink/magenta signature of blowing dust that became entrained into the circulation of the midlatitude cyclone could be followed as it eventually moved over parts of Minnesota, Wisconsin, Upper Michigan and Lake Superior — and eventually over far southern Ontario, Canada.

GOES-16 Dust RGB images [click to play animated GIF | MP4]
View only this post Read Less


