GOES-17 (GOES-West) “Red” Visible (0.64 um) images (above) showed the motion of ice within Norton Sound — inbound early in the day, transitioning to outbound later in the day — on 28 May 2021. This ice motion was likely driven primarily by tidal motions within the Sound; for example, a plot of tide height for Unalakeet... Read More
![GOES-17 “Red” Visible (0.64 um) images [click to play animation | MP4]](https://cimss.ssec.wisc.edu/satellite-blog/images/2021/05/ak_ice-20210528_200255.png)
GOES-17 “Red” Visible (0.64 µm) images [click to play animation | MP4]
GOES-17
(GOES-West) “Red” Visible (
0.64 um) images
(above) showed the motion of ice within
Norton Sound — inbound early in the day, transitioning to outbound later in the day — on 28 May 2021. This ice motion was likely driven primarily by tidal motions within the Sound; for example, a plot of tide height for Unalakeet
(below) depicted rising tide (water moving into the Sound) from 04-20 UTC followed by falling tide (water moving out of the Sound) after 20 UTC.
![Plot of tide height at Unalakeet, Alaska on 28 May [click to enlarge]](https://cimss.ssec.wisc.edu/satellite-blog/images/2021/05/210528_Unalakeet_AK_tide.png)
Plot of tide height at Unalakeet, Alaska on 28 May [click to enlarge]
Farther inland over the
Alaska North Slope, comparisons of Suomi NPP VIIRS Visible (0.64 µm), Shortwave Infrared (3.74 µm) and Infrared Window (11.45 µm) images at 1838 and 2015 UTC
(below) revealed the formation and subsequent expansion of an “aircraft dissipation trail”. As an aircraft — likely headed to or from Prudhoe Bay — flew through a relatively thin cloud layer composed of supercooled water droplets, it caused glaciation of supercooled water droplets along its flight path (which then fell out of the cloud as snow).
![Suomi NPP VIIRS Visible (0.64 µm), Shortwave Infrared (3.74 µm) and Infrared Window (11.45 µm) images [click to enlarge]](https://cimss.ssec.wisc.edu/satellite-blog/images/2021/05/210528_suomiNPP_visible_shortwaveInfrared_infraredWindow_AK_aircraft_dissipation_trail_anim.gif)
Suomi NPP VIIRS Visible (0.64 µm), Shortwave Infrared (3.74 µm) and Infrared Window (11.45 µm) images [click to enlarge]
1-minute GOES-17 Day Cloud Phase Distinction RGB images created using Geo2Grid (below) showed the formation and growth of the aircraft dissipation trail.
![GOES-17 Day Cloud Phase Distinction RGB images [click to play animation | MP4]](https://cimss.ssec.wisc.edu/satellite-blog/images/2021/05/GOES-17_ABI_RadM2_cloud_phase_distinction_2021148_190059Z.png)
GOES-17 Day Cloud Phase Distinction RGB images [click to play animation | MP4]
===== 29 May Update =====
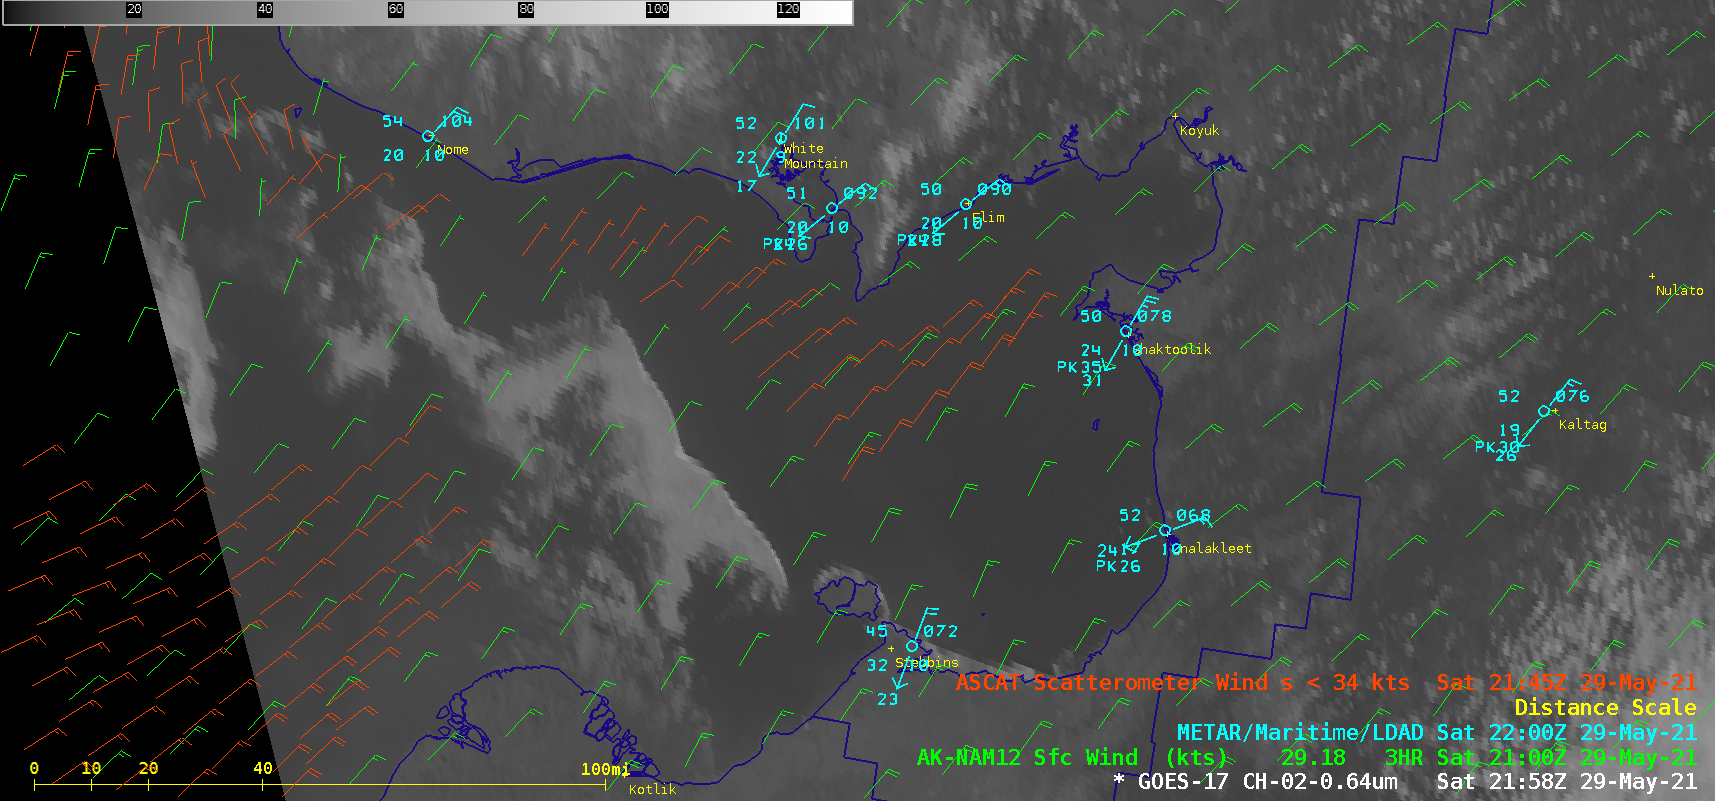
![GOES-17 “Red” Visible (0.64 um) images, with plots of NAM12 model winds (green barbs) and Metop-A ASCAT winds (red bars) [ click to play animation | MP4]](https://cimss.ssec.wisc.edu/satellite-blog/images/2021/05/ak_ns-20210529_215855.png)
GOES-17 “Red” Visible (0.64 um) images, with plots of NAM12 model surface winds (green barbs) and Metop-A ASCAT winds (red barbs) [click to play animation | MP4]
On the following day, 1-minute GOES-17 Visible images
(above) showed a similar inbound/outbound diurnal shift in the direction of ice flow within Norton Sound. Plots of NAM12 model surface winds and Metop-A ASCAT surface scatterometer winds indicated that the ice motion was generally orthogonal to surface wind direction — which reaffirmed that tides were the primary factor influencing ice motion during those 2 days.
View only this post
Read Less
![GOES-17 “Red” Visible (0.64 um) images [click to play animation | MP4]](https://cimss.ssec.wisc.edu/satellite-blog/images/2021/05/210528_goes17_visible_AK_ice_anim.gif)
![GOES-17 Day Cloud Phase Distinction RGB images [click to play animation | MP4]](https://cimss.ssec.wisc.edu/satellite-blog/images/2021/05/210528_goes17_dayCloudPhaseDistinction_AK_aircract_disspiation_trail_2_anim.gif)
![GOES-17 “Red” Visible (0.64 um) images, with plots of NAM12 model winds (green barbs) and Metop-A ASCAT winds (red bars) [ click to play animation | MP4]](https://cimss.ssec.wisc.edu/satellite-blog/images/2021/05/210529_goes17_visible_Norton_Sound_AK_ice_anim.gif)
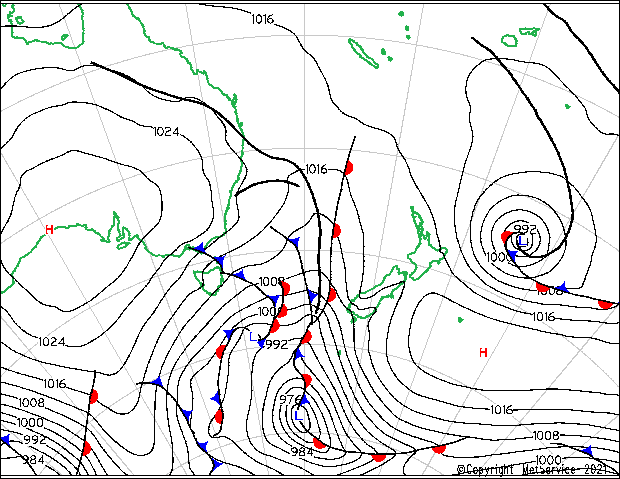
![GOES-17 "Clean" Infrared Window (10.3 um) images [click to play animation | MP4]](https://cimss.ssec.wisc.edu/satellite-blog/images/2021/05/210527_goes17_infrared_South_Pacific_subtropical_storm_anim.gif)
![NOAA-20 Infrared Window (11.45 um) image [click to enlarge]](https://cimss.ssec.wisc.edu/satellite-blog/images/2021/05/210527_1205utc_noaa20_viirs_infrared_NZ_subtropical_storm.png)
![Suomi NPP VIIRS Day/Night Band (0.7 um) image [click to enlarge]](https://cimss.ssec.wisc.edu/satellite-blog/images/2021/05/nz_sts_snpp_dnb-20210527_122909.png)
![Cross section of Suomi NPP ATMS Brightness Temperature anomaly [click to enlarge]](https://cimss.ssec.wisc.edu/satellite-blog/images/2021/05/210527_1256utc_suomiNPP_atms_btAnomaly_xsect_NZ_subtropical_storm.gif)

